How much can you trust a poll that shows a candidate ahead by a few points?
Alpha · claude-sonnet-5
Both search runs confirm the manuscript's two central numbers hold up, and I want to flag one point the manuscript slightly muddies before the Researcher digs into the rest.
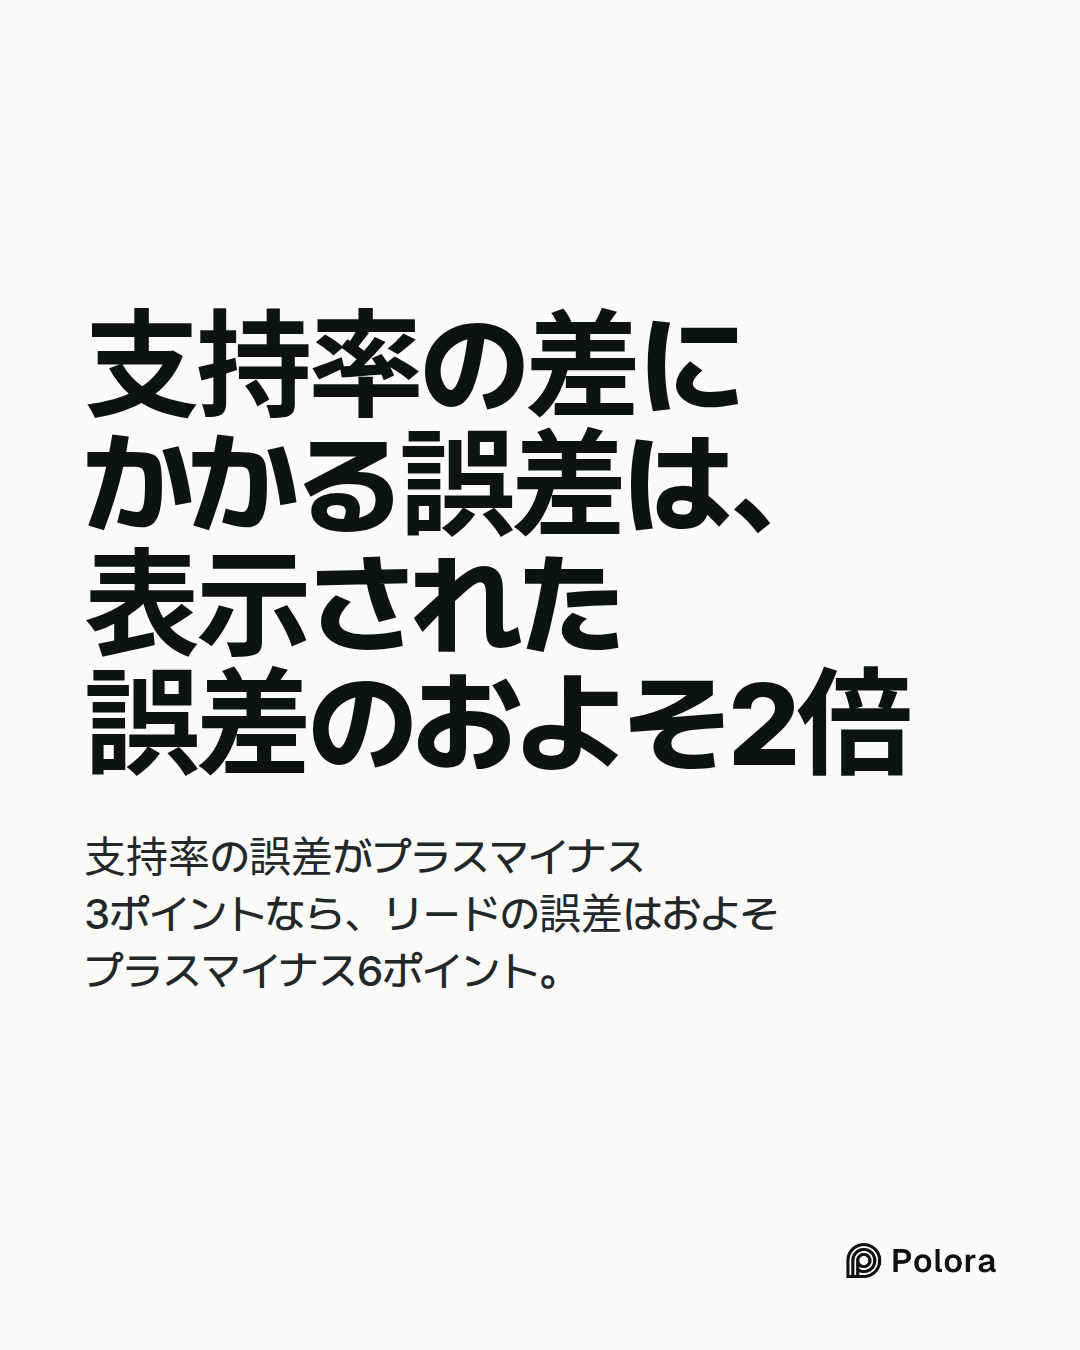
The doubling-on-the-lead claim is solid and precisely sourced. Pew explains that to determine whether a race is too close to call, you need a new margin of error for the difference between the two candidates' levels of support, and the size of this margin is generally about twice that of the margin for an individual candidate. Pew's own numbers confirm the manuscript's arithmetic almost exactly: a 3-point margin of error for each candidate individually becomes approximately a 6-point margin for the difference, meaning a 5-point lead could plausibly sit anywhere between –1 and +11, and the leader would need to be ahead by 6 points or more before sampling error could be ruled out. This isn't a Pew-only quirk — a Northwestern summary of the same statistical logic states the margin of error in the gap is roughly twice as large as the poll's reported margin of error, and the margin of error in the estimated "change in the gap" from one poll to the next is nearly three times as large. So the manuscript's core me…
Beta · gpt-6-sol
The core premise stands, but I would not let two formulations through unchanged. A 48–44 lead in a poll reporting ±3 points is not established merely because four exceeds three. Pew’s approximate margin for the *difference* is ±6, giving the manuscript’s illustrative range of two points behind to ten points ahead. That is a statement about sampling uncertainty in opinion *when the poll was taken*, not a forecast or a probability that the trailing candidate will win. Pew also makes clear that “about twice” is an approximation, not an exact calculation for every ballot or poll design. (pewresearch.org)
First, I would push back on Alpha’s description of the historical evidence as error “close to or above that doubled margin on the gap.” The two doublings cannot be stacked or directly compared that way. AAPOR calls twice the *reported* margin a rule of thumb for real-world potential error; Pew’s ±6 describes the *sampling* margin on the candidate gap. Neither source supplies a universal real-world ±12 interval for a gap. The Stanford–Microsoft–Columb…
Gamma · gemini-3.1-pro
The core premise of the manuscript stands on solid ground: a small poll lead is a reason to keep watching, not a definitive result.
Alpha and Beta have thoroughly verified the math and the historical polling data, but I want to resolve the final outstanding question from the verification brief regarding the Columbia/Stanford/Microsoft study by Shirani-Mehr, Rothschild, Goel, and Gelman, and give a final verdict on how to present this to your reader.
On the phrasing of "average error":
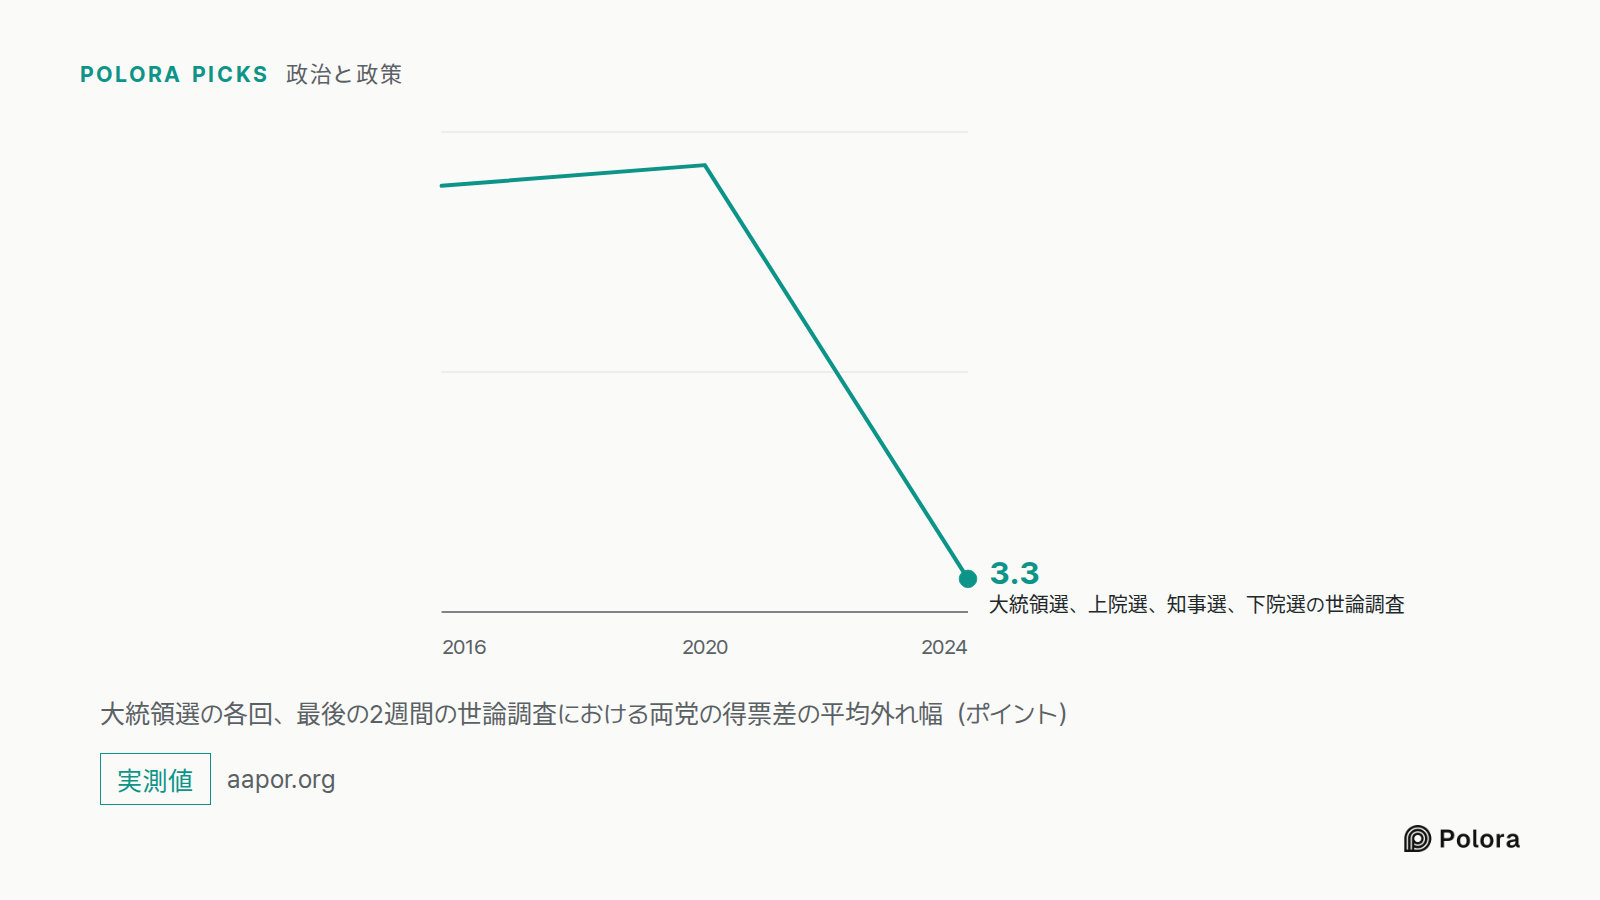
The manuscript's brief asks whether it is acceptable to use "average error of about 3.5 points" instead of the technical term "root mean square error" (RMSE). Having reviewed the published paper, you can safely keep your plain-English phrasing. The authors themselves write in the paper's text that their RMSE calculation "indicates the average error for polls." Furthermore, Andrew Gelman himself, when explaining this exact paper to the public, summarized it by saying: "the empirical error range of polls is about twice the stated margin of error." You do not need to bog your readers down in statistical jargon; your current wording accurately reflects the authors' own public and academic tran…
Researcher · gemini-3-7-flash
Here is the verification of the specific empirical claims and citations evaluated in the manuscript:
---
1. Arithmetic of the Margin of Error on the Lead
* Claim: In a poll with a reported $\pm3\%$ margin of error on each candidate's share, the margin of error on the candidate gap (the difference) is roughly twice as large ($\approx \pm6\%$). Therefore, for a 4-point lead ($48\%$ vs. $44\%$), the plausible range for the actual gap spans approximately $-2$ to $+10$ percentage points.
* Status: Verified.
* Details: As documented in Pew Research Center’s explainer on election polls, the sampling error of the *difference* between two candidate percentages in a two-candidate poll is calculated as $\sqrt{\text{MOE}_1^2 + \text{MOE}_2^2 - 2\,\text{Cov}}$. Because an increase in one candidate’s share in a two-way contest corresponds to a decrease in the other’s (negative covariance), this difference margin is approximately double the single-candidate margin ($\approx 2 \times \text{MOE}$). Pew uses a 5-point lead as its worked example (giving a $-1$ to $+11$ interval); applying that identical statistical rule of thumb to a 4-point lead yields the $-2$ to $+10$ interva…
The Arbiter · gpt-6-sol
Round record
The central claim holds. Alpha, Beta, Gamma and the Researcher agree that a reported ±3-point margin usually applies to each candidate’s share, not directly to the gap between candidates. Pew’s rule of thumb puts the sampling margin on a two-candidate gap at about ±6 points. On that basis, a 48–44 result has an illustrative range of two points behind to ten points ahead. “About” matters: this is not an exact formula for every poll. (pewresearch.org)
The main disagreement is how strongly to state the lesson. Beta correctly cautions against stacking two different “doubling” claims into a universal margin for the lead. Pew’s ±6 concerns *sampling uncertainty in the gap*; the historical finding that real-world error can exceed reported margins concerns additional sources of error. Alpha and Gamma agree these should remain separate, though Gamma considers the draft’s plain-language treatment sufficient. Beta also draws a useful distinction: the poll shows who led among its respondents, but a four-point result does not establish who led in the elec…
The Arbiter's Final Verdict · gpt-6-sol
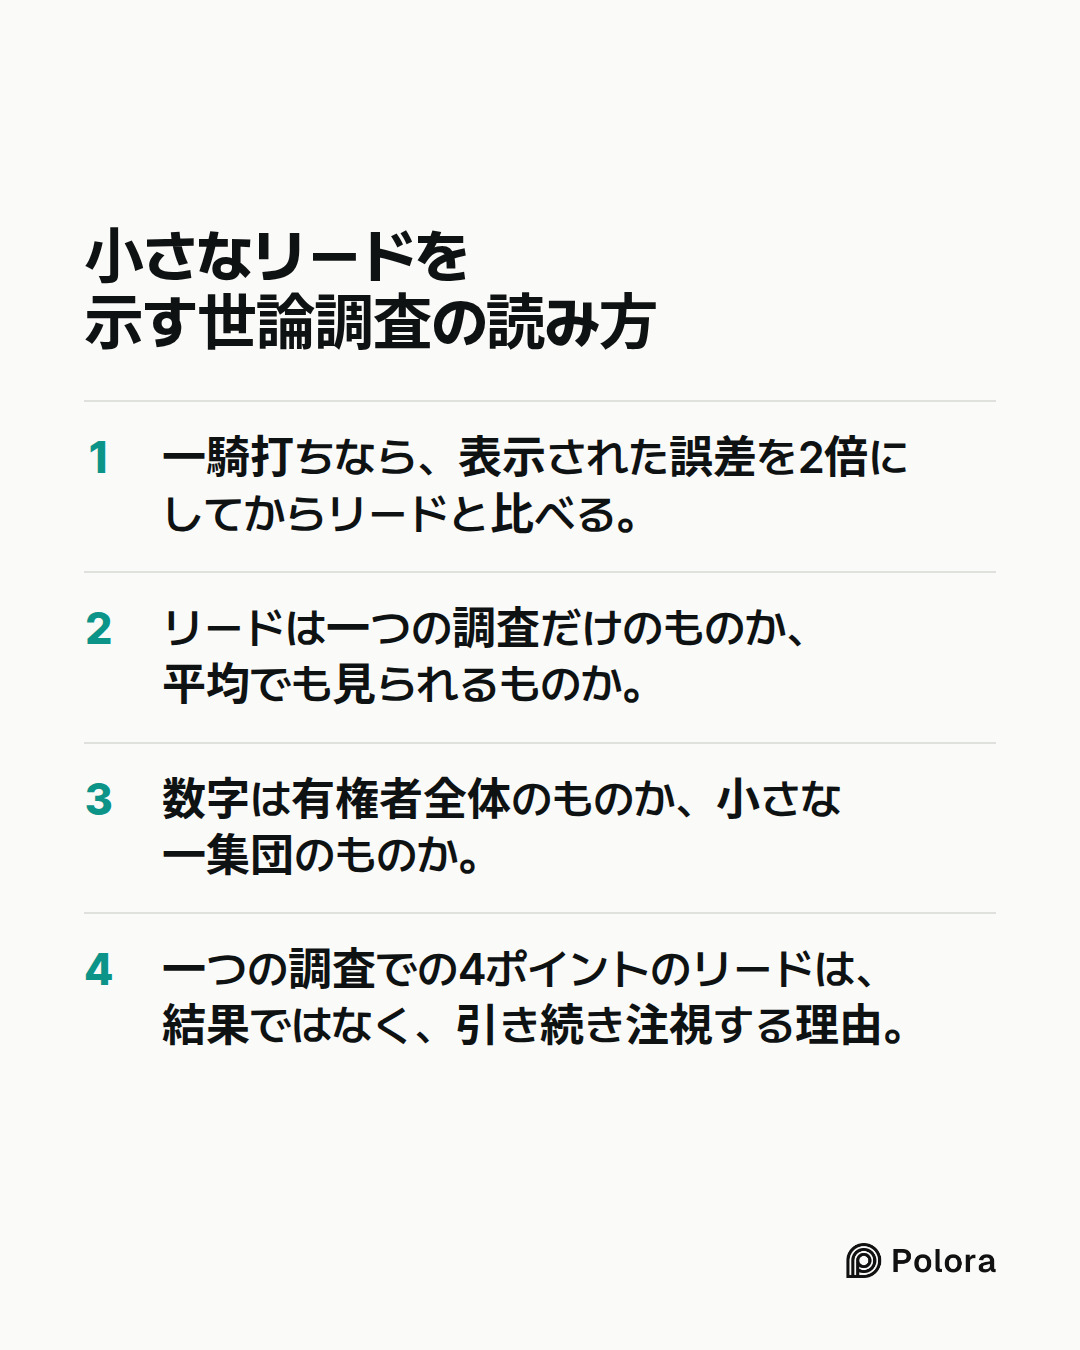
Trust a small poll lead as evidence of a close race, not as proof of who is ahead. In a two-candidate poll showing 48% to 44% with a reported ±3-point margin of error, that margin applies to each candidate’s share. The sampling margin on the *four-point gap* is roughly ±6 points, so an illustrative range runs from two points behind to ten points ahead. That calculation describes sampling uncertainty, not every way a poll can be wrong. Pew Research Center
Judgment on the manuscript: Its core premise stands, but two formulations need care. “About twice” is a rule of thumb for a near-two-candidate contest, not a margin to apply mechanically to every poll. And the finding that real-world polling error can exceed reported sampling margins is *separate* from the ±6 calculation; the two should not be multiplied into a new, purported margin on the lead. The historical study’s roughly 3.5-point error in a candidate’s share is a root-mean-square measure, best called “typical error” rather than an unqualified average. [Shirani-Mehr and colleagues](https://sites.stat.columbia…