대개는 알 수 없습니다. ±3%p라는 오차범위는 후보 한 명의 지지율에 붙는 값이라, 두 후보 격차의 오차는 약 6%p입니다. 실제 여론조사는 발표된 오차범위보다 더 크게 빗나가기도 합니다.
정치와 정책 · 2026-10-01
두 후보 격차의 오차범위는 발표된 숫자의 약 두 배
새 여론조사에서 한 후보는 48%, 다른 후보는 44%가 나왔고, 오차범위는 ±3%포인트라고 합니다. 많은 사람이 이것을 오차범위를 넘는 4%포인트 우세로 읽습니다. 그렇지 않습니다.
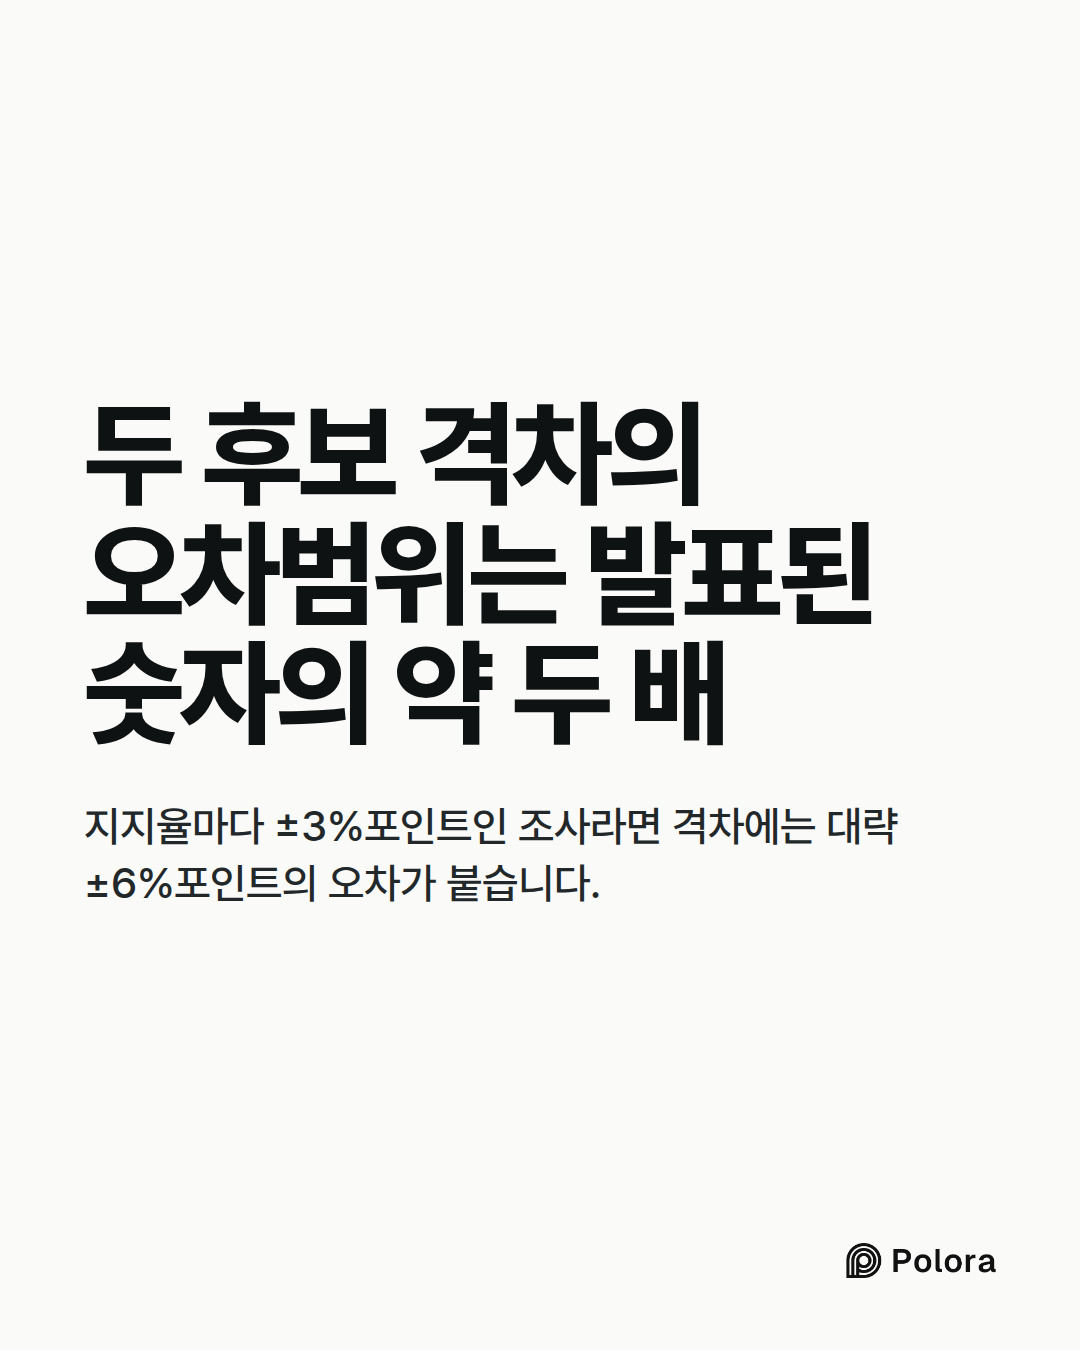
±3%포인트는 후보 한 명의 지지율에 따로 붙는 값입니다. 격차는 둘 다 불확실한 두 숫자의 차이이고, 양자 대결에서는 두 숫자가 서로 반대로 움직입니다. 표본에 한 후보 지지자가 우연히 너무 많이 잡혔다면 다른 후보 지지자는 거의 틀림없이 너무 적게 잡힌 것입니다. 그래서 격차의 오차는 어느 한 후보 지지율의 오차보다 큽니다. 미국의 조사 기관 퓨 리서치 센터는 격차의 오차범위가 대체로 후보 한 명에 대한 오차범위의 약 두 배라고 분명히 말합니다. 지지율마다 ±3%포인트인 조사라면 격차에는 대략 ±6%포인트의 오차가 붙습니다. 정확한 공식이 아니라 어림셈이고, 두 후보의 지지율을 합치면 거의 전체가 될 때 가장 잘 들어맞습니다.
이것을 4%포인트 우세에 적용해 보면, 실제 격차로 그럴듯한 범위는 앞선 후보가 약 2%포인트 뒤지는 경우부터 약 10%포인트 앞서는 경우까지입니다. 우세가 진짜일 수도 있고, 뒤진 것으로 나온 후보가 실제로는 앞서 있을 수도 있습니다. 퓨가 직접 든 예는 같은 규모의 조사에서 나온 5%포인트 우세입니다. 실제 격차는 -1%포인트에서 +11%포인트 사이 어디든 될 수 있습니다. 표본을 우연히 치우치게 뽑았을 가능성을 배제하려면 앞선 후보가 약 6%포인트는 앞서야 합니다.
발표되는 오차범위는 전체 표본에 대한 것입니다. 기사가 30세 미만 유권자나 특정 지역처럼 표본의 일부만 떼어 보면, 그 숫자 뒤에 있는 응답자는 훨씬 적어집니다. 퓨는 후보마다 ±8%포인트인 하위 집단을 예로 드는데, 이 경우 두 후보 격차의 오차는 ±16%포인트가 됩니다.
응답을 받기가 더 어려운 집단도 있습니다. 퓨에 따르면 젊은 층과 소수 인종은 조사에 덜 응답하기 때문에, 조사 기관은 이들의 응답에 더 큰 비중을 두어 실제 인구 비율에 맞춥니다. 가중치 부여라고 부르는 이 작업은 표본의 대표성을 높이지만 오차범위도 넓힙니다. 두 조사 사이에 한 하위 집단 안에서 극적인 변화가 보였다면, 그저 잡음일 때가 많습니다.
오차범위가 재는 것은 하나뿐입니다. 무작위로 뽑은 약 1,000명의 표본이 나머지 모든 사람과 조금 다를 가능성입니다. 카드 게임에서 판마다 들어오는 패가 달라지는 것과 같습니다. 여론조사가 틀릴 수 있는 다른 경로에 대해서는 아무것도 알려 주지 않습니다.
퓨는 그중 세 가지를 꼽습니다. 조사 방식으로는 아예 닿지 않는 사람들이 있는데, 이것을 포괄 오차라고 합니다. 응답을 덜 하려는 집단이 있는데, 이것은 무응답 오차입니다. 질문을 잘못 알아듣거나 속마음을 말하지 않는 사람들도 있는데, 이것은 측정 오차입니다. 선거 여론조사에는 추측이 하나 더 들어갑니다. 응답자 가운데 누가 실제로 투표할지 가려내는 일입니다. 조사 기관은 이를 위해 투표할 가능성이 높은 유권자를 추리는 모델을 만드는데, 투표율은 예측하기 어렵습니다.
연구자들이 여론조사를 실제 결과와 맞춰 보면, 차이는 발표된 오차범위가 말해 주는 것보다 큽니다. 스탠퍼드대와 마이크로소프트 리서치, 컬럼비아대의 통계학자들이 1998년부터 2014년까지 미국 주 단위 여론조사 4,000건 이상을 분석한 연구에서, 후보 지지율의 전형적인 오차는 약 3.5%포인트였습니다. 이 숫자는 평균제곱근오차, 곧 크게 빗나간 경우에 더 큰 비중을 주는 평균 방식으로 잰 것이고, 발표된 오차범위가 시사한 값의 대략 두 배입니다. 퓨와 여론조사 전문가들의 대표 단체인 미국여론조사협회(AAPOR)도 이제 실제로 생길 수 있는 오차를 발표된 수치의 약 두 배로 어림합니다. 이 두 배는 격차에 붙는 두 배와는 별개이고, 둘을 곱해 격차의 오차범위 하나로 만들어서는 안 됩니다. 발표된 오차범위는 둘 중 어느 것도 보여 주지 않습니다.
같은 주에 실시한 좋은 조사 두 개도 1~2%포인트씩 차이가 납니다. 서로 다른 사람들에게 닿았기 때문입니다. 여러 조사를 평균하면 이런 무작위 잡음이 상당 부분 상쇄되고, 조사 기관 한 곳의 버릇이 결과를 좌우하는 일도 줄어듭니다. AAPOR의 안내에 따르면 개별 결과에는 정상적인 변동에서 오는 잡음이 많은데, 평균을 보면 그런 결과 하나하나에 눈이 쏠리지 않고 흐름이 더 분명하게 보입니다.
평균에도 한계가 있습니다. 여론조사의 실제 오차가 발표된 오차범위의 약 두 배라는 것을 밝힌 바로 그 연구는, 같은 선거를 다룬 여론조사들이 같은 방향으로 빗나가는 경향이 있고 그 폭이 평균 약 1.5~2%포인트라는 것도 확인했습니다. 저자들은 조사 기관들이 같은 집단에 닿는 데 똑같이 애를 먹고, 누가 투표할지 가리는 규칙도 서로 비슷하기 때문일 것으로 봅니다. 모든 조사가 함께 안고 있는 오차는 평균으로도 지워지지 않습니다. 그래서 여러 조사에서 유지되는 우세는 조사 하나에서 나온 우세보다 훨씬 믿을 만하지만, 평균도 보증은 아닙니다.
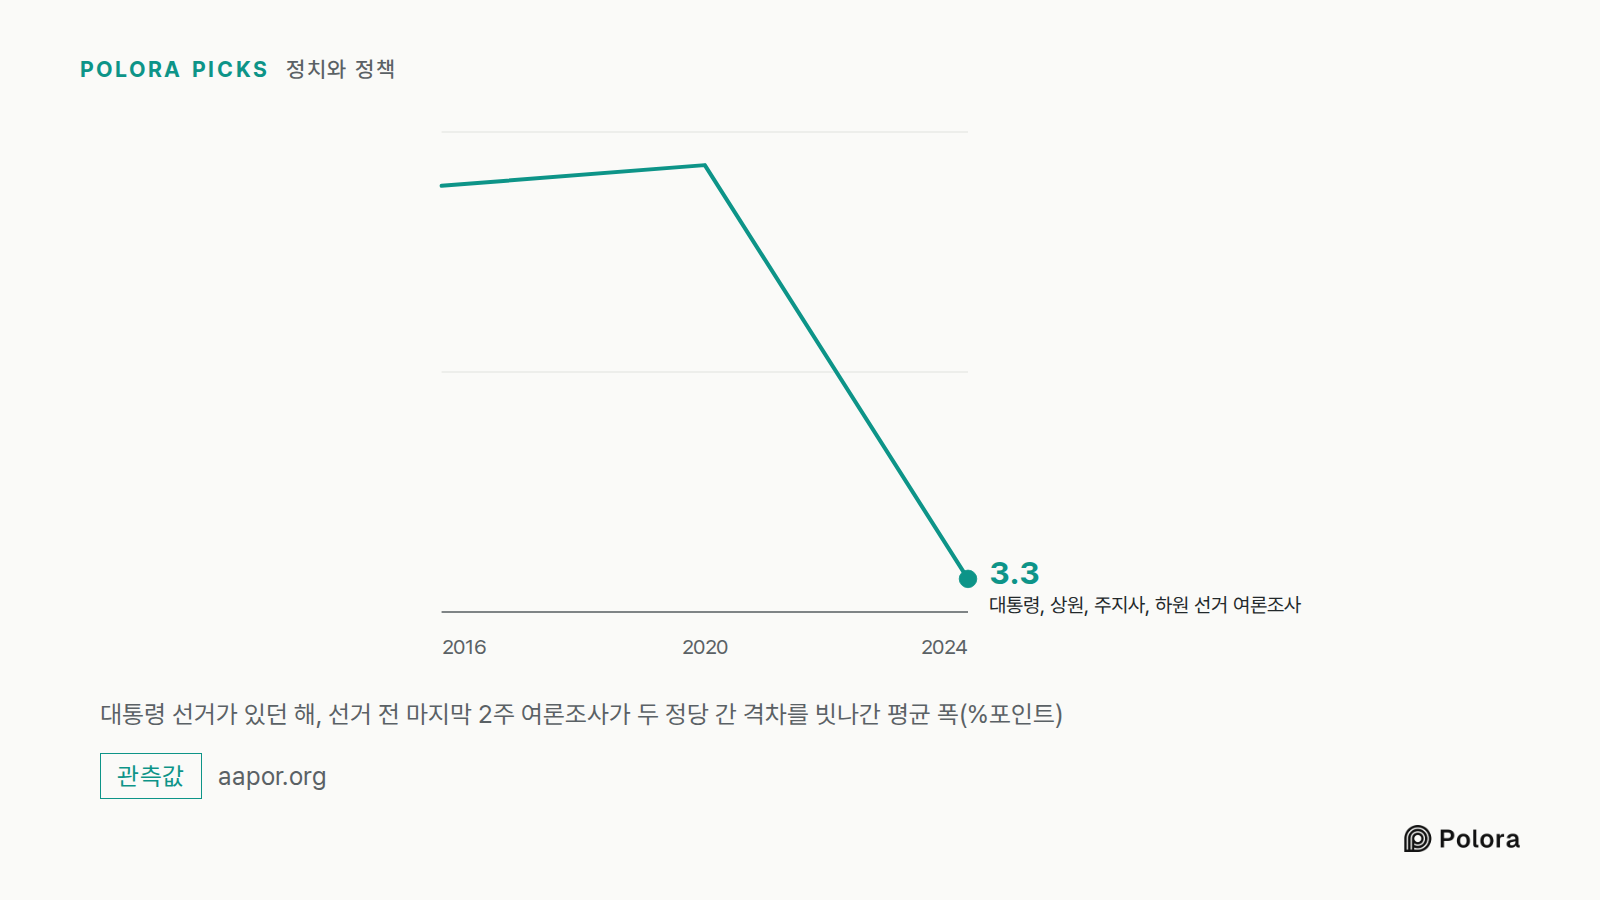
AAPOR는 대통령 선거가 있을 때마다 여론조사를 검토합니다. 2024년 보고서는 선거운동 마지막 2주 동안 실시된 대통령, 상원, 주지사, 하원 선거 여론조사 611건을 살폈습니다. 이 조사들은 두 정당 간 최종 격차를 평균 3.3%포인트 빗나갔습니다. 2020년의 5.3%포인트, 2016년의 5.2%포인트보다 나아진 결과입니다. 전국 단위 대통령 선거 조사는 평균 2.6%포인트, 주 단위 대통령 선거 조사는 3.0%포인트 빗나갔습니다. 보고서는 주 단위 조사가 1944년 이후 어느 대통령 선거 때보다 정확했다고 밝힙니다.
이 수치는 격차 자체의 오차, 곧 기사 제목에 나오는 우세 폭과 같은 숫자에 대한 오차입니다. 그러니 성적이 좋은 해에도 마지막 여론조사는 보통 뉴스가 되는 우세 폭만큼이나 격차를 빗나간 셈입니다. 게다가 이것은 마지막 2주 동안의 조사입니다. 선거일보다 한 달 이상 앞서 실시된 조사는 이 기준에 들어가지 않고, 그 뒤로 유권자의 마음이 움직일 시간도 더 많습니다.
빗나간 방향도 중요합니다. 2016년, 2020년, 2024년에는 여론조사가 공화당을 과소평가했고, 그 폭은 격차 기준으로 2024년 2.7%포인트, 2020년 4.6%포인트였습니다. 2022년 중간선거에서는 평균 오차가 작았고 방향도 반대여서, 공화당을 0.6%포인트 과대평가했습니다. AAPOR에 따르면 1930년대 이후 두 정당은 거의 같은 빈도로 과소평가되었고, 여론조사가 대통령 선거 두어 번을 넘겨 연달아 같은 방향으로 빗나가는 일은 드뭅니다. 지난 선거의 오차는 다음 선거의 오차를 알려 주는 믿을 만한 길잡이가 아닙니다.
대통령 선거가 있던 해, 선거 전 마지막 2주 여론조사가 두 정당 간 격차를 빗나간 평균 폭(%포인트) · 2016 · 2020 · 2024 · 대통령, 상원, 주지사, 하원 선거 여론조사 · 3.3
브라질은 10월 4일에 투표하고, 브라질 유권자들도 같은 질문을 하고 있습니다. BBC 브라질판(BBC News Brasil)은 브라질 신문 오 포부(O Povo)에 다시 실린 기사에서 어떤 여론조사도 벗어날 수 없는 산수를 정리했습니다. 오차범위를 ±3%포인트로 만들려면 약 1,068명을 조사해야 합니다. ±2%포인트에는 약 2,401명, ±1%포인트에는 약 9,604명이 필요한데, 대부분의 여론조사에는 너무 비싼 규모입니다. 오차범위를 절반으로 줄이려면 조사 인원이 약 네 배 필요합니다.
그래서 여론조사는 1%포인트가 아니라 몇 %포인트의 오차범위로 만족합니다. 같은 기사에 따르면 브라질 선거 여론조사는 대부분 ±2%포인트 안팎을 발표합니다. 몇 %포인트의 우세가 그렇게 자주 잡음 안에 머무는 것도 이 때문입니다. BBC가 인용한 미시간대학교의 조사통계학자 하파엘 니시무라는 여론조사를 예측이 아니라 그 순간을 찍은 스냅사진이라고 설명합니다. 시간을 두고 이어진 여러 조사가 영화에 더 가깝다는 것입니다.
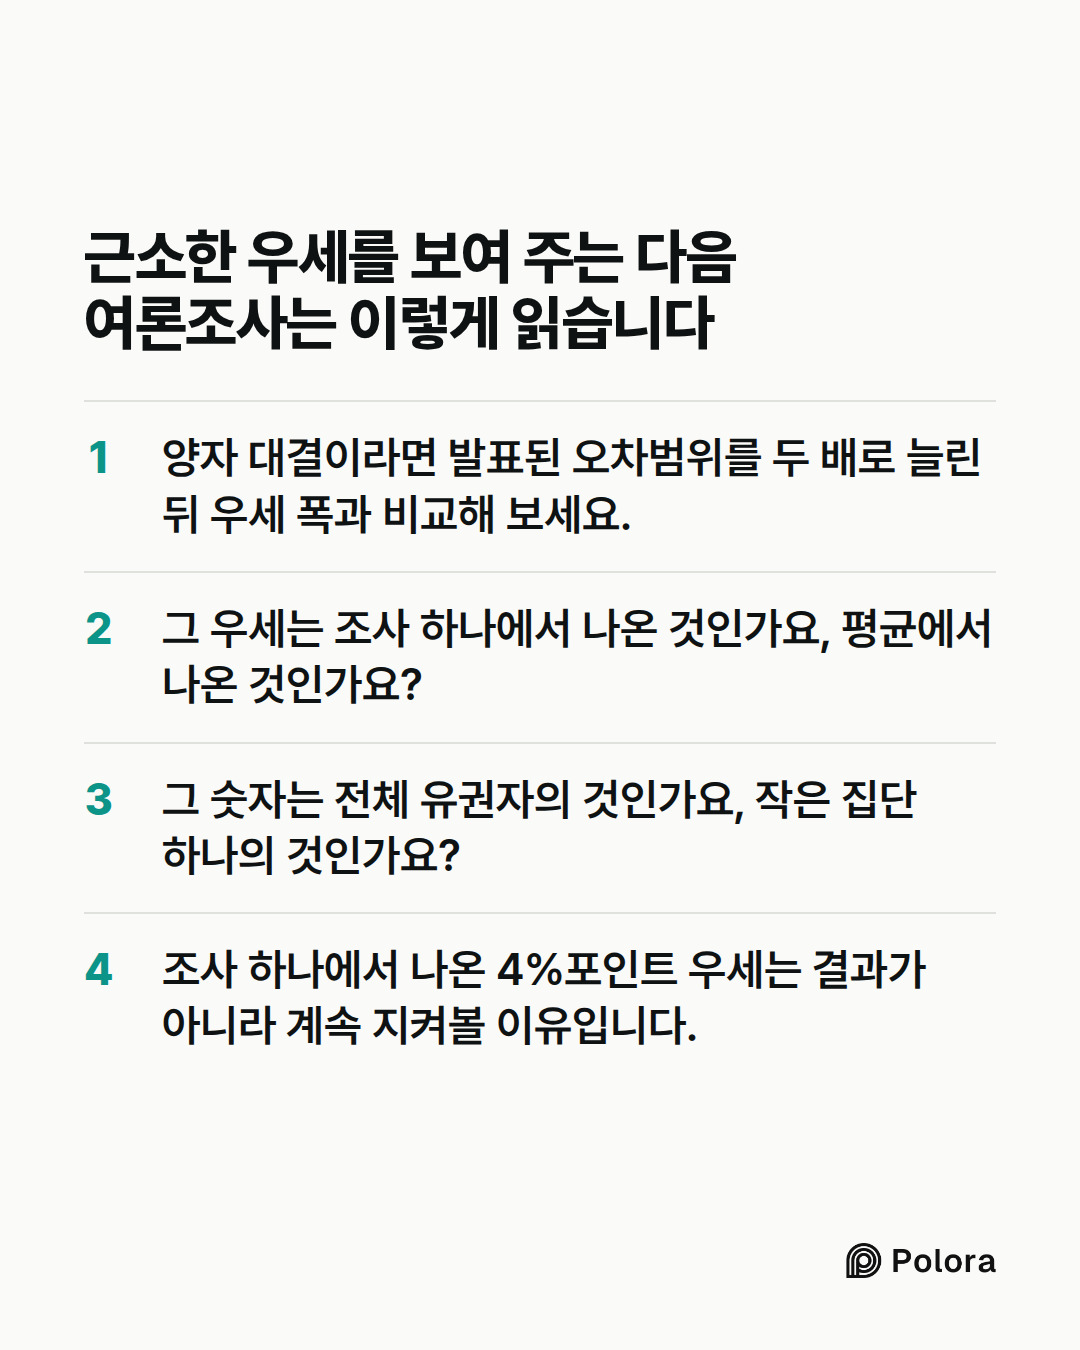
양자 대결이라면 발표된 오차범위를 두 배로 늘린 뒤 우세 폭과 비교해 보세요. 우세가 그보다 작다면, 그 조사로 알 수 있는 것은 응답자 가운데 누가 앞섰는지뿐이고 전체 유권자 가운데 누가 앞서 있는지는 아닙니다. 조사가 말해 주는 것은 접전이라는 사실입니다. 우세가 그보다 크더라도 여전히 예측은 아닙니다. 오차범위가 빼놓은 오차들이 그대로 남아 있고, 선거일 전에 여론이 움직일 수 있기 때문입니다.
그다음에는 숫자 하나 너머를 보세요. 그 우세는 조사 하나에서 나온 것인가요, 평균에서 나온 것인가요? 그 숫자는 전체 유권자의 것인가요, 작은 집단 하나의 것인가요? 성적이 좋았던 2024년에도 마지막 여론조사가 격차를 평균 약 3%포인트 빗나갔다는 점을 기억해 두세요. 그렇다고 여론조사가 쓸모없다는 말은 아닙니다. 여러 조사를 모아 보면 대개 몇 %포인트 안에 들어옵니다. 접전은 원래 몇 %포인트 차이로 보이는 법이고, 조사 하나에서 나온 4%포인트 우세는 결과가 아니라 계속 지켜볼 이유입니다.
How much can you trust a poll that shows a candidate ahead by a few points?
Alpha · claude-sonnet-5
Both search runs confirm the manuscript's two central numbers hold up, and I want to flag one point the manuscript slightly muddies before the Researcher digs into the rest.
The doubling-on-the-lead claim is solid and precisely sourced. Pew explains that to determine whether a race is too close to call, you need a new margin of error for the difference between the two candidates' levels of support, and the size of this margin is generally about twice that of the margin for an individual candidate. Pew's own numbers confirm the manuscript's arithmetic almost exactly: a 3-point margin of error for each candidate individually becomes approximately a 6-point margin for the difference, meaning a 5-point lead could plausibly sit anywhere between –1 and +11, and the leader would need to be ahead by 6 points or more before sampling error could be ruled out. This isn't a Pew-only quirk — a Northwestern summary of the same statistical logic states the margin of error in the gap is roughly twice as large as the poll's reported margin of error, and the margin of error in the estimated "change in the gap" from one poll to the next is nearly three times as large. So the manuscript's core me…
Beta · gpt-6-sol
The core premise stands, but I would not let two formulations through unchanged. A 48–44 lead in a poll reporting ±3 points is not established merely because four exceeds three. Pew’s approximate margin for the *difference* is ±6, giving the manuscript’s illustrative range of two points behind to ten points ahead. That is a statement about sampling uncertainty in opinion *when the poll was taken*, not a forecast or a probability that the trailing candidate will win. Pew also makes clear that “about twice” is an approximation, not an exact calculation for every ballot or poll design. (pewresearch.org)
First, I would push back on Alpha’s description of the historical evidence as error “close to or above that doubled margin on the gap.” The two doublings cannot be stacked or directly compared that way. AAPOR calls twice the *reported* margin a rule of thumb for real-world potential error; Pew’s ±6 describes the *sampling* margin on the candidate gap. Neither source supplies a universal real-world ±12 interval for a gap. The Stanford–Microsoft–Columb…
Gamma · gemini-3.1-pro
The core premise of the manuscript stands on solid ground: a small poll lead is a reason to keep watching, not a definitive result.
Alpha and Beta have thoroughly verified the math and the historical polling data, but I want to resolve the final outstanding question from the verification brief regarding the Columbia/Stanford/Microsoft study by Shirani-Mehr, Rothschild, Goel, and Gelman, and give a final verdict on how to present this to your reader.
On the phrasing of "average error":
The manuscript's brief asks whether it is acceptable to use "average error of about 3.5 points" instead of the technical term "root mean square error" (RMSE). Having reviewed the published paper, you can safely keep your plain-English phrasing. The authors themselves write in the paper's text that their RMSE calculation "indicates the average error for polls." Furthermore, Andrew Gelman himself, when explaining this exact paper to the public, summarized it by saying: "the empirical error range of polls is about twice the stated margin of error." You do not need to bog your readers down in statistical jargon; your current wording accurately reflects the authors' own public and academic tran…
Researcher · gemini-3-7-flash
Here is the verification of the specific empirical claims and citations evaluated in the manuscript:
---
1. Arithmetic of the Margin of Error on the Lead
* Claim: In a poll with a reported $\pm3\%$ margin of error on each candidate's share, the margin of error on the candidate gap (the difference) is roughly twice as large ($\approx \pm6\%$). Therefore, for a 4-point lead ($48\%$ vs. $44\%$), the plausible range for the actual gap spans approximately $-2$ to $+10$ percentage points.
* Status: Verified.
* Details: As documented in Pew Research Center’s explainer on election polls, the sampling error of the *difference* between two candidate percentages in a two-candidate poll is calculated as $\sqrt{\text{MOE}_1^2 + \text{MOE}_2^2 - 2\,\text{Cov}}$. Because an increase in one candidate’s share in a two-way contest corresponds to a decrease in the other’s (negative covariance), this difference margin is approximately double the single-candidate margin ($\approx 2 \times \text{MOE}$). Pew uses a 5-point lead as its worked example (giving a $-1$ to $+11$ interval); applying that identical statistical rule of thumb to a 4-point lead yields the $-2$ to $+10$ interva…
The Arbiter · gpt-6-sol
Round record
The central claim holds. Alpha, Beta, Gamma and the Researcher agree that a reported ±3-point margin usually applies to each candidate’s share, not directly to the gap between candidates. Pew’s rule of thumb puts the sampling margin on a two-candidate gap at about ±6 points. On that basis, a 48–44 result has an illustrative range of two points behind to ten points ahead. “About” matters: this is not an exact formula for every poll. (pewresearch.org)
The main disagreement is how strongly to state the lesson. Beta correctly cautions against stacking two different “doubling” claims into a universal margin for the lead. Pew’s ±6 concerns *sampling uncertainty in the gap*; the historical finding that real-world error can exceed reported margins concerns additional sources of error. Alpha and Gamma agree these should remain separate, though Gamma considers the draft’s plain-language treatment sufficient. Beta also draws a useful distinction: the poll shows who led among its respondents, but a four-point result does not establish who led in the elec…
The Arbiter's Final Verdict · gpt-6-sol
Trust a small poll lead as evidence of a close race, not as proof of who is ahead. In a two-candidate poll showing 48% to 44% with a reported ±3-point margin of error, that margin applies to each candidate’s share. The sampling margin on the *four-point gap* is roughly ±6 points, so an illustrative range runs from two points behind to ten points ahead. That calculation describes sampling uncertainty, not every way a poll can be wrong. Pew Research Center
Judgment on the manuscript: Its core premise stands, but two formulations need care. “About twice” is a rule of thumb for a near-two-candidate contest, not a margin to apply mechanically to every poll. And the finding that real-world polling error can exceed reported sampling margins is *separate* from the ±6 calculation; the two should not be multiplied into a new, purported margin on the lead. The historical study’s roughly 3.5-point error in a candidate’s share is a root-mean-square measure, best called “typical error” rather than an unqualified average. [Shirani-Mehr and colleagues](https://sites.stat.columbia…