2030년까지 가장 크게 성장할 여자 프로 스포츠 리그는 어디일까, AI 모델들의 예측은?
AI 모델들의 예측으로는 증가율에서 하키 PWHL이 가장 빠릅니다. 절대 증가폭은 TV 계약 갱신을 앞둔 축구 NWSL이 근소하게 앞섰고, 정체 위험이 가장 큰 곳으로는 배구 LOVB가 꼽혔습니다.
문화와 예술 · 2026-09-28
북미의 여자 프로 스포츠 리그 다섯 곳이 모두 커지고 있지만, 출발점은 저마다 다릅니다. 농구의 WNBA와 축구의 NWSL은 이미 자리 잡은 사업입니다. 하키의 PWHL, 소프트볼의 AUSL, 배구의 LOVB는 출범한 지 몇 시즌밖에 되지 않았습니다. 다섯 곳 가운데 네 곳이 팀을 늘리고 있고, AUSL만 2027년에도 여섯 팀을 유지합니다. 2026 시즌이 끝난 뒤부터 2030년까지 어느 리그가 가장 크게 성장할지는 간단한 질문처럼 들립니다. 하지만 작은 리그는 규모가 두 배가 되어도, 큰 리그가 5분의 1만큼 커질 때보다 늘어난 양이 적을 수 있습니다.
2026년 9월 28일, 폴로라는 이 질문을 OpenAI, xAI, Anthropic이 만든 AI 모델들에게 던졌습니다. 세 모델은 각자 한 가지 관점을 맡았습니다. 하나는 TV와 스트리밍 수입을, 하나는 관중과 팬을, 하나는 경기장과 리그 확장 같은 인프라를 봤습니다. 연구원 역할의 모델이 공개 자료로 이들의 사실관계를 확인했고, 판결 역할의 모델이 최종 결론을 냈습니다. 성장은 경기당 평균 관중과 중계권 수입으로 쟀고, 새 팀이 생기는 것은 보조 근거로만 삼았습니다.
※ 중계권 수입 : TV 방송사와 스트리밍 서비스가 리그 경기를 내보낼 권리를 얻는 대가로 리그에 내는 돈
증가율로 보느냐 증가폭으로 보느냐에 따라 1위가 다르다
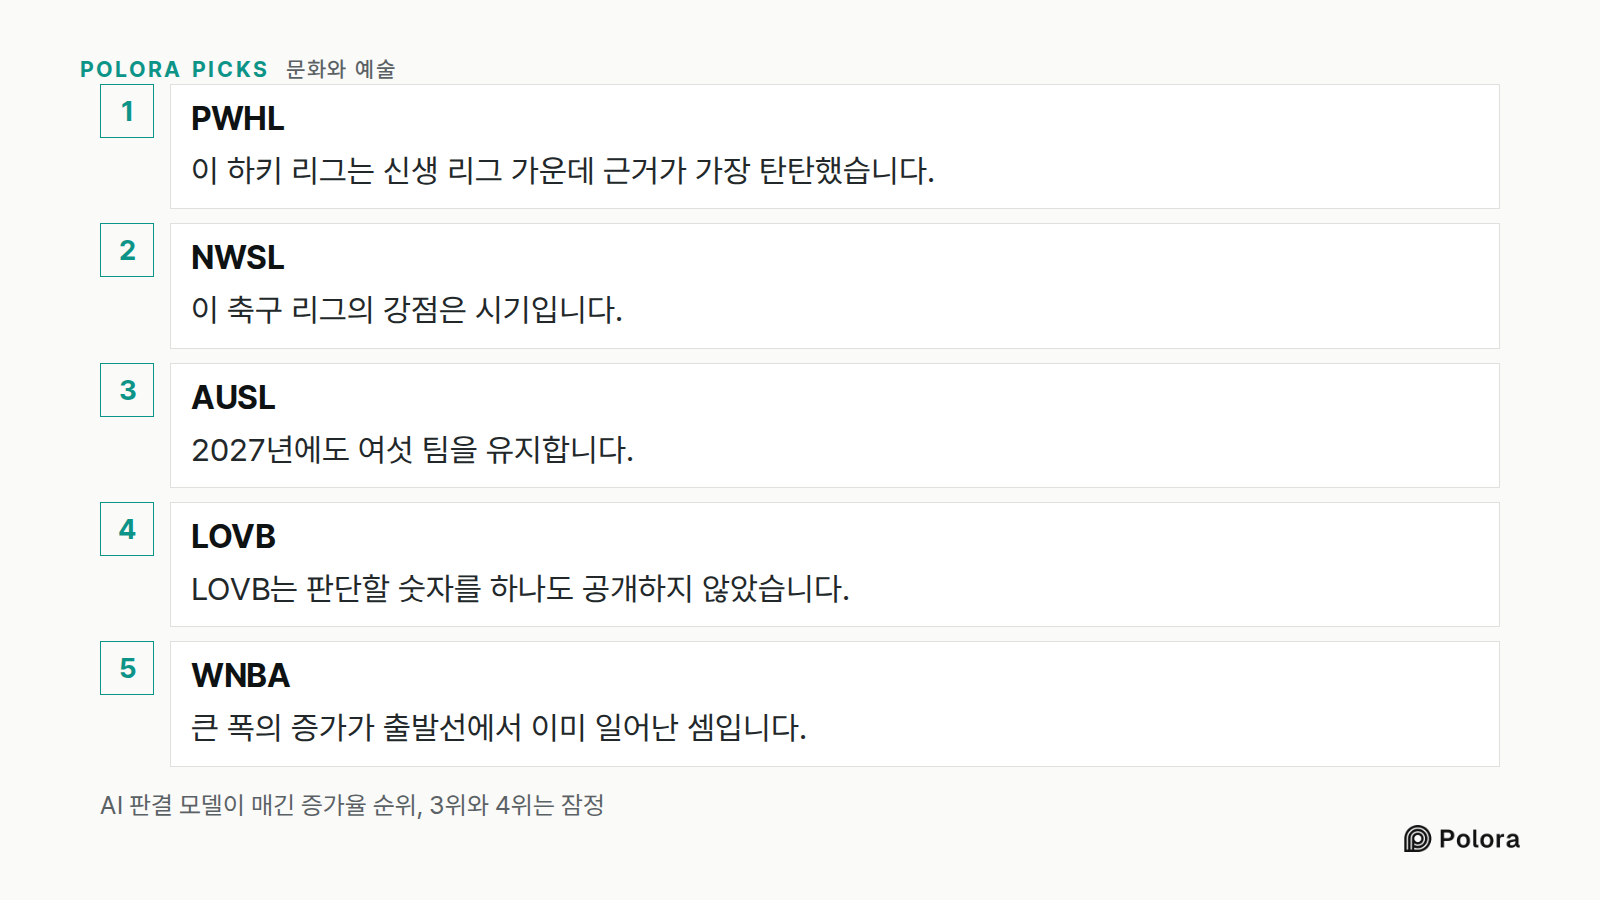
AI 모델들은 처음부터 이 질문에 답이 두 개라는 데 동의했습니다. 증가율은 각 리그를 자기 출발점과 비교합니다. 이 기준으로 판결 모델의 최종 순위는 PWHL이 1위, NWSL이 2위였습니다. AUSL과 LOVB가 잠정적으로 3위와 4위, WNBA가 마지막이었습니다. 증가폭은 경기당 실제로 늘어난 관중 수와 늘어난 금액을 말합니다. 전체 증가폭에서 판결 모델은 NWSL을 WNBA보다 근소하게 앞에 두었고, PWHL이 3위였습니다. 다만 증가폭 안에서도 두 잣대는 서로 다른 쪽을 가리킵니다. 경기당 늘어난 관중만 보면 판결 모델은 PWHL, NWSL, WNBA 순으로 매겼습니다. 늘어난 TV 수입으로는 NWSL이 1위였습니다. AUSL과 LOVB는 증가폭 순위에 아예 넣지 않았습니다. 두 리그 모두 순위를 매기는 데 필요한 수치를 공개하지 않기 때문입니다.
첫 라운드의 그림은 달랐습니다. 전문 분야를 맡은 세 모델은 모두 처음에 WNBA를 증가폭 1위로 꼽았는데, 가장 큰 사업이라는 이유에서였습니다. 판결 모델은 두 가지를 짚으며 반박했습니다. 2026년 말에 규모가 크다는 것과 2026년 이후에 성장한다는 것은 다르고, 총관중과 경기당 평균 관중도 다르다는 것입니다. 두 번째 라운드에서 TV 수입 담당 모델은 늘어날 TV 수입에서 NWSL을 WNBA 앞으로 올렸습니다. 팬 담당 모델은 이 변경을 받아들였고, 인프라 담당 모델은 TV 수입 판단을 TV 수입 담당 모델에 맡겼습니다. 판결 모델은 이렇게 합친 순위가 점수가 아니라 판단이라고 덧붙였습니다. 경기당 관중 수와 금액은 서로 더할 수 없기 때문입니다.
AI 판결 모델이 매긴 증가율 순위, 3위와 4위는 잠정 · PWHL · NWSL · AUSL · LOVB · WNBA · 이 하키 리그는 신생 리그 가운데 근거가 가장 탄탄했습니다. · 이 축구 리그의 강점은 시기입니다. · 2027년에도 여섯 팀을 유지합니다. · LOVB는 판단할 숫자를 하나도 공개하지 않았습니다. · 큰 폭의 증가가 출발선에서 이미 일어난 셈입니다.
AI 모델들이 증가율 1위로 하키 리그 PWHL을 꼽은 이유
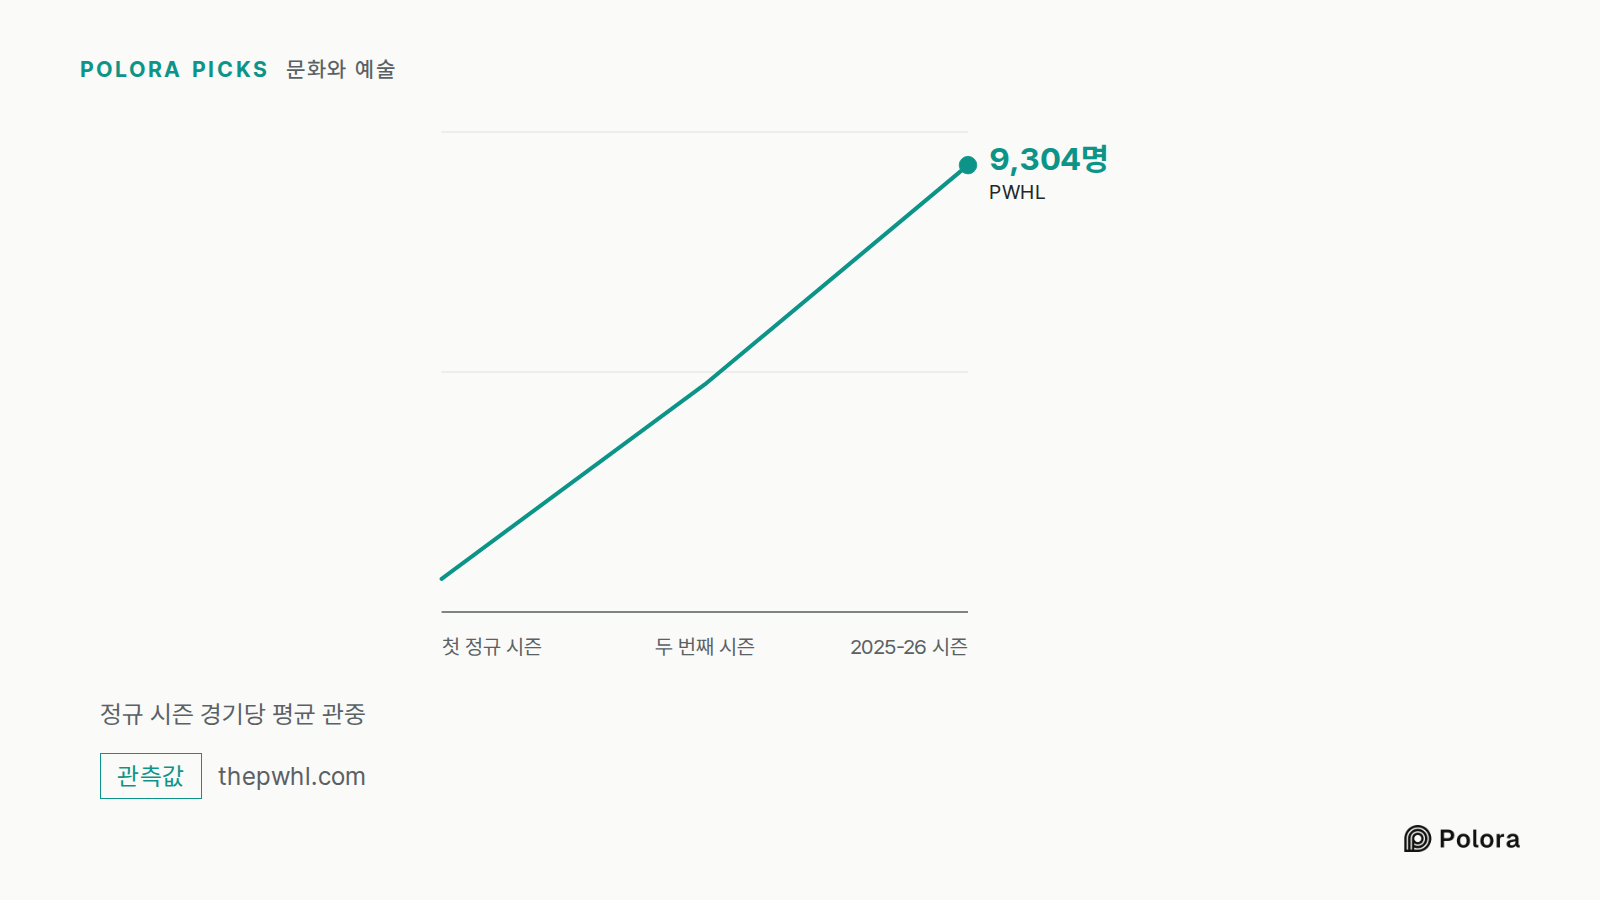
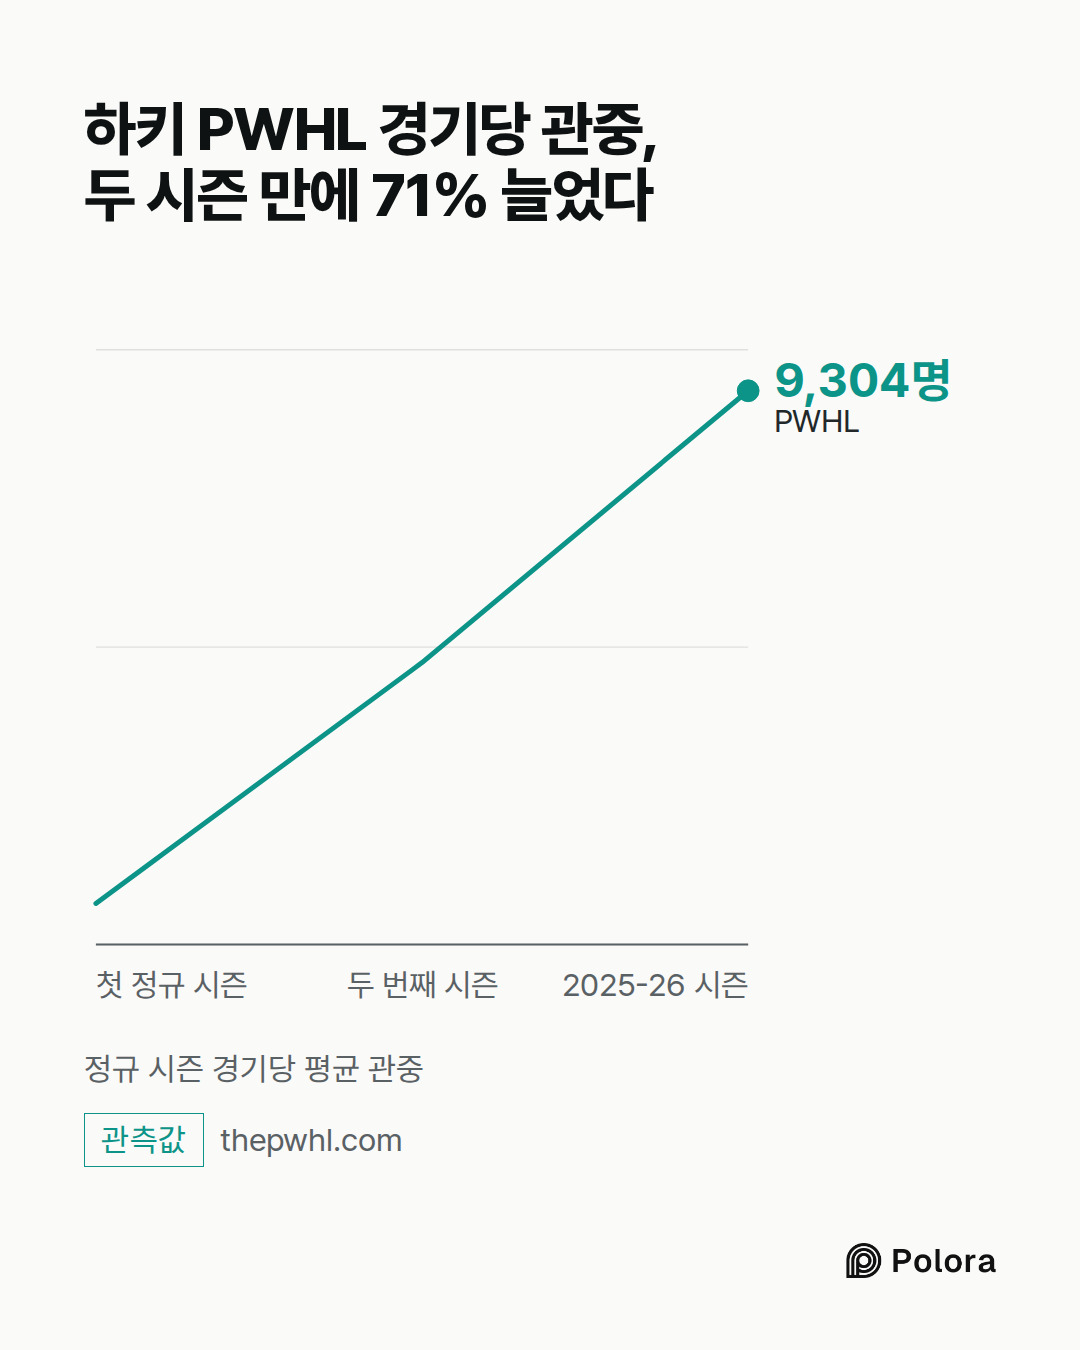
이 하키 리그는 신생 리그 가운데 근거가 가장 탄탄했습니다. 공개된 경기당 평균 관중은 첫 정규 시즌 5,448명, 두 번째 시즌 7,260명이었습니다. 2025-26 시즌에는 120경기에 1,116,497명이 들어 평균 9,304명에 이르렀습니다. 두 시즌 만에 71% 늘어난 것으로, 다른 신생 리그 가운데 이런 기록을 가진 곳은 없습니다.
2026-27 시즌부터 이 리그는 방송사 Scripps와 함께 미국에서 처음으로 시즌 전체를 다루는 전국 TV 계약을 시작합니다. 매주 한 경기는 무료 전국 채널인 ION에서, 두 경기는 광고 기반 무료 스트리밍 채널에서 방송됩니다. 계약 금액은 공개되지 않았습니다. 디트로이트, 해밀턴, 라스베이거스, 새너제이에 새 팀 네 곳이 생기면서 리그는 여덟 구단에서 열두 구단으로 늘어나고, 그중 몇 팀은 북미 남자 프로 하키 최상위 리그인 NHL 팀용으로 지어진 경기장을 씁니다. 연구원 모델은 새 팀들이 평균을 끌어내릴 수도, 끌어올릴 수도 있으며 실제로 경기를 치르기 전에는 누구도 알 수 없다고 경고했습니다. 판결 모델은 PWHL의 근거가 TV 수입보다 관중 쪽에 더 단단히 서 있다고 결론지었습니다.
정규 시즌 경기당 평균 관중 · 첫 정규 시즌 · 두 번째 시즌 · 2025-26 시즌 · PWHL · 9,304명
이 축구 리그의 강점은 시기입니다. CBS, ESPN, Prime Video, Scripps와 맺은 지금의 중계 계약은 2024년에 시작해 2027년까지이므로, 예측 기간 안에 새 계약을 협상해야 합니다. WNBA에는 2030년 전에 이런 재협상 시점이 없습니다. 판결 모델이 증가폭에서 NWSL을 근소한 우세로 본 이유가 이것입니다.
새 계약으로 얼마나 늘어날지는 공개된 숫자로 계산할 수 없습니다. 지금 계약의 가치로 널리 알려진 4년간 2.4억 달러는 리그의 공식 발표에 나오지 않습니다. 연구원 모델은 이 금액에 중계 제작비가 포함되어 있어서 해마다 6,000만 달러의 현금으로 읽으면 안 된다는 점도 짚었습니다. 관중도 확정되지 않았습니다. 2026 시즌은 아직 진행 중이었고, 외부 집계로는 평균 약 10,800~10,900명이었지만 공식 최종 수치는 아닙니다.
새 경기장들은 2028년에 들어옵니다. 애틀랜타와 콜럼버스가 합류해 리그는 18개 구단이 됩니다. Gotham 구단은 뉴욕 퀸스의 경기장인 Etihad Park로 옮기고, 덴버의 전용 경기장도 문을 열 예정입니다. 인프라 담당 모델은 처음에 다음 TV 계약이 이 경기장들이 제때 문을 여는 데 달려 있다고 주장했습니다. 연구원 모델이 이를 뒷받침하는 출처를 찾지 못하자 이 주장을 거둬들였습니다. 판결 모델은 이런 사업이 수용 규모나 입지를 개선할 뿐 수요를 보장하지는 않는다고 짚었습니다.
이 농구 리그는 증가율에서 마지막이었지만, 판결 모델은 그것이 전망이 약하다는 뜻은 아니라고 했습니다. 이유는 두 가지였습니다. WNBA는 훨씬 큰 사업에서 출발하므로 같은 양이 늘어도 증가율은 작게 나옵니다. 그리고 Disney, NBCUniversal, Amazon과 맺은 주요 계약은 2026년에 시작해 2036년까지 이어집니다. 계약 기간 전체로 약 22억 달러라고 보도됐지만, 공식 발표에는 금액이 없습니다. 큰 폭의 증가가 출발선에서 이미 일어난 셈입니다. 2030년까지 남은 것은 주로 계약에 들어 있는 인상분과 작은 추가 계약들이고, 그 조건은 공개되지 않았습니다.
관중은 이미 많습니다. 보도된 2026년 평균 11,474명은 리그 발표가 아니라 330경기에 379만 명이 들었다는 외부 집계에서 나온 수치입니다. 2028년에 클리블랜드, 2029년에 디트로이트, 2030년에 필라델피아가 합류해 리그는 18개 팀이 되고, 필라델피아의 새 경기장도 이 일정에 맞춰 문을 여는 것을 목표로 하고 있습니다. AI 모델들은 새 팀이 총관중은 늘리겠지만 경기당 관중을 반드시 끌어올리지는 않는다는 데 의견을 같이했습니다.
가장 젊은 두 리그는 리그 전체의 평균 관중도, 중계 계약 금액도 공개하지 않습니다. 이 공백 때문에 논의에서 유일하게 의견이 제대로 갈렸습니다. AUSL에는 고무적인 신호가 있습니다. 챔피언십 시리즈 첫 경기는 ABC에서 732,000명이 시청했고, 2026년 ESPN 시청률은 150% 올랐습니다. 25번의 매진이 있었고, 2028년까지 시즌마다 50경기를 독점 중계하는 ESPN과의 3년 계약도 있습니다. 미국 프로야구 메이저리그(MLB)가 수천만 달러를 투자했지만 정확한 금액은 공개되지 않았습니다. 2027년에도 여섯 팀을 유지합니다. LOVB는 2026년 66경기를 모두 TV나 스트리밍으로 내보냈고, USA Network에서 방송된 첫 다섯 경기의 평균 시청자는 115,000명이었습니다. 로스앤젤레스, 샌프란시스코, 미네소타, 마이애미를 더해 여섯 팀에서 열 팀으로 커지고 있습니다.
관중 증가율에서 TV 수입 담당 모델과 인프라 담당 모델은 AUSL을 앞에 두었습니다. 안정된 여섯 개 연고지, 지역 운영의 연속성, ESPN과의 약속, 야구계의 후원을 근거로 들었습니다. 팬 담당 모델은 LOVB 쪽이었습니다. 이 리그와 연결된 유소년 배구 클럽망이 어린 선수와 그 가족을 표를 사는 관중으로 바꿀 수 있다는 주장이었습니다. 연구원 모델은 유소년 선수가 돈을 내는 팬이 된다는 것을 보여 주는 공개 수치가 없으므로, 공개된 자료로는 순서를 정할 수 없다고 판단했습니다. 판결 모델은 증가율에서 AUSL에 근소하고 잠정적인 우위를 주면서, AUSL의 다음 ESPN 협상이 예측 기간 안에 있다는 자기 나름의 이유를 더했습니다. 증가폭에서는 두 리그 모두 순위를 매기지 않았습니다.
전문 분야를 맡은 세 모델이 모두 LOVB를 골랐고, 판결 모델도 동의했습니다. 숫자가 나빠서가 아닙니다. LOVB는 판단할 숫자를 하나도 공개하지 않았습니다. 걱정은 이 리그가 돈을 내고 꾸준히 찾아오는 팬층을 보여 주거나 TV 수입을 밝히기 전에 네 팀을 한꺼번에 늘린다는 데 있습니다. 새 연고지마다 자체 티켓 판매 조직과 경기장, 그리고 계속 찾아오는 팬이 필요합니다. 새 경기장 가운데 확정된 곳은 두 곳뿐이었습니다. 로스앤젤레스의 실내 경기장 Intuit Dome과 미네소타의 대학 경기장 Maturi Pavilion입니다. 나머지는 아직 발표되지 않았습니다.
판결 모델은 이것이 리그 사이의 위험을 비교한 것이지 재정 문제의 신호는 아니라고 했습니다. 팬 담당 모델은 같은 이야기를 반대쪽에서 했습니다. LOVB는 다섯 리그 가운데 가장 크게 뻗어 나갈 여지가 있을 수 있고, 가능한 결과의 폭이 그만큼 넓다는 것이 바로 정체할 여지도 남긴다는 것입니다.
판결 모델은 자기 결론의 가장 튼튼한 토대로 두 가지를 꼽았습니다. PWHL의 세 시즌에 걸친 관중 증가와, 2027년에 끝나는 NWSL의 TV 계약입니다. 연구원 모델은 WNBA의 길고 폭넓은 TV 계약도 공개 기록으로 뒷받침된다고 보았습니다. 나머지 순위의 상당 부분은 추론에 기댄 예측이고, 수치를 공개하지 않는 리그에 대해서는 늘어날 금액도 증가율도 정직하게 계산할 수 없었습니다.
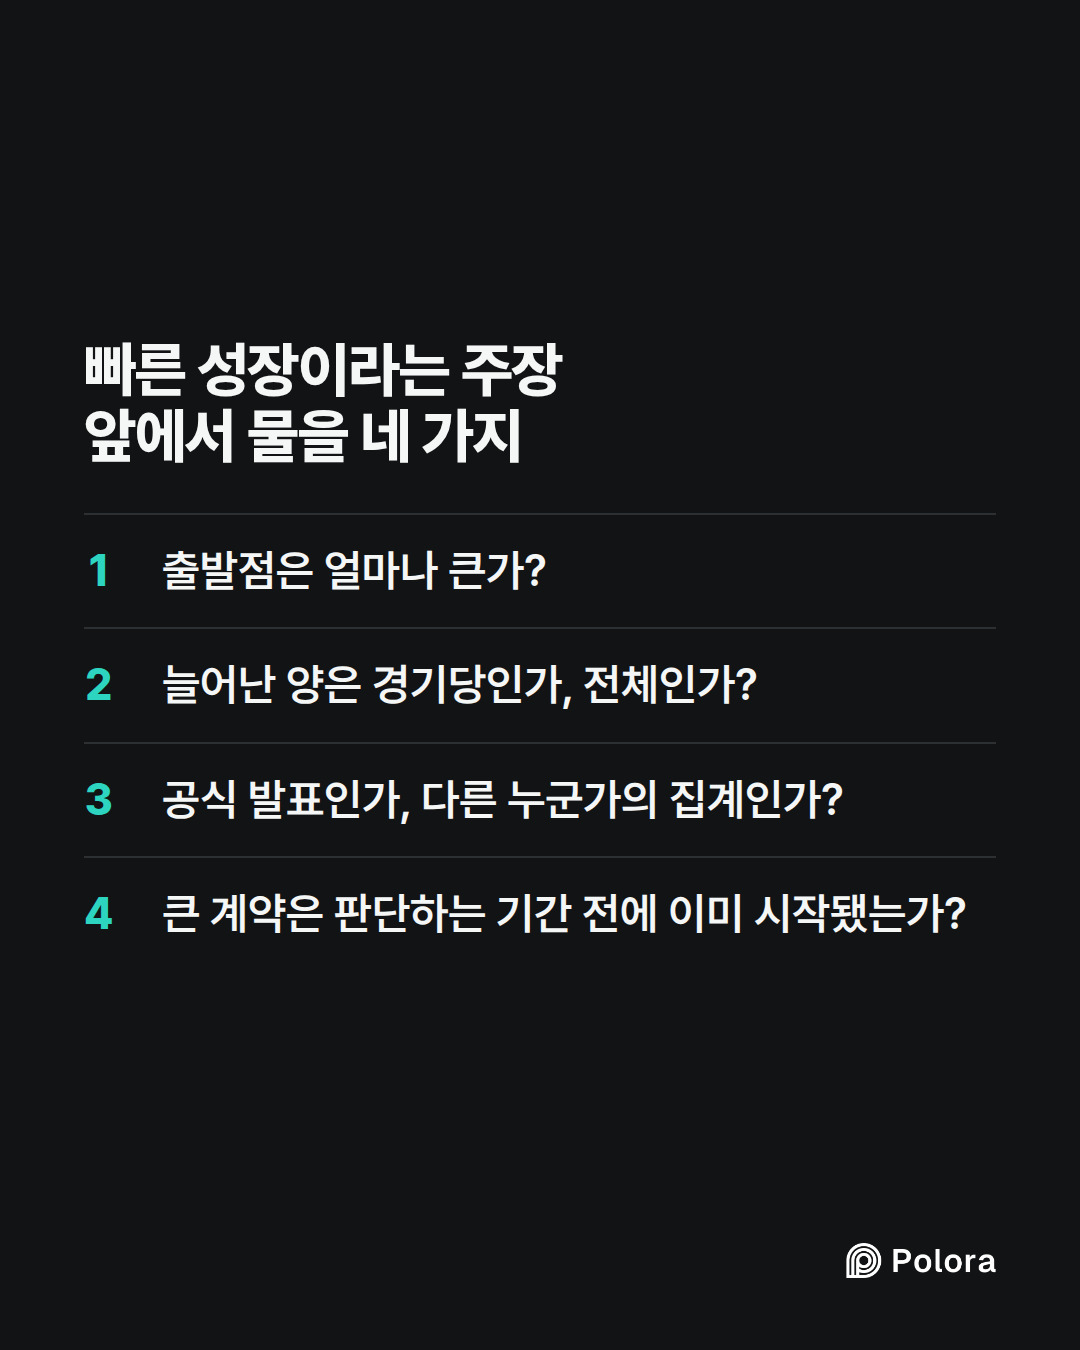
가장 쓸모 있는 교훈은 이 다섯 리그 밖에서도 통합니다. 무언가가 빠르게 성장한다는 주장을 믿기 전에 네 가지를 물어보십시오. 출발점은 얼마나 큰가? 늘어난 양은 경기당인가, 전체인가? 그 수치는 공식 발표인가, 다른 누군가의 집계인가? 큰 계약은 판단하는 기간 전에 이미 시작됐는가, 아니면 그 기간 안에 오는가? WNBA가 이것이 왜 중요한지 보여 줍니다. 다섯 리그 가운데 가장 크지만, 출발점이 워낙 크고 가장 큰 TV 수입 증가가 이미 지나갔기 때문에 증가율에서는 마지막이었습니다.
Women's professional sports in North America are expanding fast, but they are growing from very different starting points. Rank these leagues by how much each will grow from the end of the 2026 season through 2030 : WNBA (basketball), NWSL (soccer), PWHL (hockey), AUSL (softball), and LOVB (volleyball). Measure growth mainly by average attendance per game and by media rights revenue, and treat team expansion as supporting evidence only. Base the ranking on evidence that is public at the time of the discussion, such as announced expansion teams, current TV and streaming deals and when they expire, published viewership and attendance figures, and ownership backing. Separate growth in percentage terms from growth in absolute size, and say which league is most at risk of stalling and why. Where a league does not publish a figure, say so rather than estimating it.
Media Rights & Commercial Valuation Analyst · gpt-5.6-sol
Media-rights analyst’s opening ranking, as of September 28, 2026
I would not force these leagues into one list without distinguishing percentage growth from absolute growth. A startup can double a very small audience or undisclosed rights payment while adding less economic value than a mature league growing 20%.
My ranking: percentage growth, end-2026 to 2030
1. PWHL
2. LOVB
3. AUSL
4. NWSL
5. WNBA
My ranking: absolute growth
1. WNBA
2. NWSL
3. PWHL
4. LOVB
5. AUSL
These are forecasts, not claims that unpublished revenue can be reconstructed reliably.
---
1. PWHL — best percentage-growth proposition
The PWHL enters the window with unusually persuasive proof of demand. Its 2025–26 regular season averaged 9,304, up from 7,260 in year two and 5,448 in year one. That is a 71% rise in average attendance across two seasons. It also reported 77% year-over-year growth in live YouTube viewing. (thepwhl.com)
More important commercially, the PWHL is only now crossing the thres…
Attendance & Fan Engagement Demographer · grok-4.5
I am grounding attendance, engagement, and distribution baselines before ranking. Pulling the latest public figures now.Gathering expansion plans, remaining attendance/media baselines, and engagement metrics next.Attendance & Fan Engagement Demographer’s opening ranking — as of September 28, 2026
I agree with the Media Rights Analyst that we must separate percentage growth from absolute growth. From a demographer’s seat, the primary measures are average attendance per game (published figures only), capacity utilization and venue strategy, repeat/season-ticket conversion potential, breadth of the fan base (families, youth pipelines, casual vs. core, gender mix where reported), and how media exposure feeds the gate (and vice versa). Expansion is supporting context only. Where a league has not published a league-wide average attendance or rights dollars, I will say so rather than invent one.
Percentage-growth ranking (end-2026 through 2030)
1. PWHL
2. LOVB
3. AUSL
4. NWSL
5. WNBA
Absolute-growth ranking
1. WNBA
2. NWSL
3. PWHL
4. LOVB
5. AUSL
These are evidence-based forecasts, not reconstructed unpublished…
Expansion Strategy & Infrastructure Auditor — opening position, September 28, 2026
My colleagues have converged almost identically. I don't disagree with their percentage/absolute split, but I'm going to pressure-test the ranking through a different lens: can the physical infrastructure actually deliver the growth being projected, and on what timeline? Media rights and attendance averages are outputs; venues, ownership capital, and construction schedules are the inputs that make or break them. Several of these leagues have real execution risk baked into their 2026–2030 plans that hasn't been fully priced into the discussion yet.
Where infrastructure changes the read
NWSL — the most infrastructure-dependent absolute-growth story, and the most schedule risk. The analyst and demographer are right that NWSL's big rights reset comes in 2028. But that reset is explicitly tied to stadium delivery, and the construction calendar is tight. Denver's team is playing in a 12,000-seat temporary stadium for 2026–2027, with the permanent 14,500-seat Santa Fe Yards stadium opening in Spring 2028, expandable to 20,000. Atlanta plans to play at Mercedes-Benz Stadium, Columbus at…
Researcher · gpt-5.6-sol
Researcher’s verification
The broad rankings are forecasts and therefore not fact-checkable as true or false today. Most of the underlying factual claims check out, but several need qualification or correction.
Confirmed
- PWHL attendance: The league officially reported 1,116,497 attendees across 120 regular-season games in 2025–26, averaging 9,304. Its previous regular-season averages were 7,260 and 5,448, making the stated 71% increase from year one accurate.
Source: https://www.thepwhl.com/en/news/2026/april/28/pwhl-delivers-historic-growth-in-third-regular-season-with-playoffs-beginning-thursday-april-30 (thepwhl.com)
- PWHL expansion and television: Detroit, Hamilton, Las Vegas and San Jose are joining for 2026–27, taking the league from eight to twelve teams. Scripps announced a weekly ION game, two weekly FAST-channel games, playoff coverage and the Walter Cup Finals. The release calls this the PWHL’s first season-long U.S. national television presence; no rights fee was disclos…
The Arbiter · gpt-6-astra
Round 1 record: agreement on the ranking, but not yet enough evidence for its precision
All three specialists proposed the same provisional ordering:
| Measure | Proposed ranking, highest growth first |
|---|---|
| Percentage growth | PWHL → LOVB → AUSL → NWSL → WNBA |
| Absolute growth | WNBA → NWSL → PWHL → LOVB → AUSL |
| Greatest risk of stalling | LOVB |
The key unresolved issue is that starting large does not necessarily mean adding the most—and starting small does not necessarily mean growing fastest. The rankings remain forecasts, not results established by the available figures.
What each specialist contributed
- Media Rights & Commercial Valuation Analyst: Favored PWHL’s attendance momentum and emerging national distribution, LOVB’s proportional upside, and AUSL’s broadcaster and MLB backing. Identified NWSL’s next rights cycle, beginning in 2028, as a major repricing opportunity. Placed WNBA last in percentage growth because its principal rights uplift already took effect in 2026, but first in absolute growth.
- Attendance & Fan Engagement Demographer: Endorsed both rankings. Emphasized PWHL’s published attendance trajectory, LOVB’s yo…
Media Rights & Commercial Valuation Analyst · gpt-5.6-sol
Media-rights reassessment
The Arbiter’s criticism is correct: commercial scale at the end of 2026 is not the same thing as growth from that point through 2030. I therefore revise the common Round 1 ordering, especially for media rights.
Because several leagues do not disclose rights fees—and two do not publish reliable average-attendance baselines—precise growth rates or dollar forecasts would be false precision. These are ordinal forecasts with confidence levels, not measured projections.
1. Average attendance per game
Percentage growth, end-2026 to 2030
1. PWHL
2. AUSL
3. LOVB
4. NWSL
5. WNBA
Why PWHL remains first: It has the only compelling, published multiyear attendance trajectory among the younger leagues: 5,448, then 7,260, then 9,304 per regular-season game. The four-team expansion to 12 clubs creates risk that new markets dilute the average, but it also supplies additional major-market upside. Its new U.S. package provides three national windows each week, including an ION game, beginning in 2026–27. ([scripps.com](https://scripps.com/press-releases/pwhl-and-scripps-sports-announce-national-u-s-television-partnership-for-202…
Attendance & Fan Engagement Demographer · grok-4.5
I need current public attendance and engagement figures before locking my Round 2 ranking. Searching the key gaps the Arbiter flagged.I have solid baselines for WNBA, NWSL, and PWHL. Checking a few remaining LOVB and AUSL attendance details and venue notes before finalizing.## Attendance & engagement baselines and forecast
The Media Rights Analyst is right that scale at the end of 2026 is not growth after 2026, and that average attendance per game must not be confused with total admissions. My lane is who converts latent demand into paid seats and repeat engagement. That is where I weight the ranking.
Published / trackable baselines (as of late September 2026)
| League | Average attendance baseline | Status |
|---|---|---|
| PWHL | 9,304 (2025–26 regular season, 120 games) | Official league figure; rose from 5,448 → 7,260 → 9,304.[[1]](https://bit.ly/4e9Cuxj) |
| WNBA | ~11,470–11,474 | Reported full-season record average; total attendance ~3.79M across 330 games (~20% total lift, ~5% average lift YoY).[[2]](https://frontofficesports.com/article/wnba-continues-attendance-viewership-growth/) |
| NWSL | ~10,800–10,900 | Still provisional third-party…
Expansion Strategy & Infrastructure Auditor — Final Round
The Researcher's corrections land squarely on my Round 1 claims, and I'll address them directly before giving my final infrastructure-weighted ranking. This is my lane — venues, expansion execution, and structural capacity — and I owe the user precision there.
Accepting the corrections
On the "explicit dependency" claim between NWSL rights and stadiums: fair. I overstated it. What I can defend is a *correlation-based* argument, not a contractual one: buyers price live sports partly on venue quality and crowd optics, and NWSL's 2028 wave — Gotham to Etihad Park, Denver's permanent home, plus Atlanta and Columbus arriving with major-market infrastructure — lands inside the same window as its next rights cycle. That's a favorable coincidence for NWSL's negotiating position, not a proven linkage.
On "stadium slippage is the norm": also fair, I had no dataset. I'll narrow this to what I can actually stand behind: Denver's own project timeline illustrates the risk directly. The team is playing in a temporary facility through 2027 with the permanent stadium targeted for spring 2028 — a one-year gap between team lau…
Researcher · gpt-5.6-sol
Researcher’s final verification
Round 2 is materially better grounded than Round 1, but several claims still exceed what public evidence establishes.
Verified updates
- PWHL’s attendance series is correct: 5,448, 7,260 and 9,304 across its first three regular seasons. The latest season drew 1,116,497 spectators over 120 games. (thepwhl.com)
Exact source: https://www.thepwhl.com/en/news/2026/april/28/pwhl-delivers-historic-growth-in-third-regular-season-with-playoffs-beginning-thursday-april-30
- The WNBA’s reported 2026 average is 11,474, based on 3.79 million spectators across 330 games. This is third-party reporting based on Across the Timeline—not an official WNBA season-end release located in this check—so it should be labeled reported rather than official. (frontofficesports.com)
Exact source: https://frontofficesports.com/article/wnba-conti…
The Arbiter · gpt-6-astra
Round 2 record: revised rankings, with important limits on what they establish
The specialists corrected the central problem in Round 1: growth after the 2026 season is not existing commercial size, and average attendance is not total attendance. They now favor NWSL over WNBA for incremental rights dollars, while PWHL leads their attendance forecasts. Those are judgments—not measurable outcomes established by disclosed contracts.
Positions carried forward
All rankings below run from greatest forecast growth to least.
| Measure | Media Rights Analyst | Attendance Demographer | Infrastructure Auditor |
|---|---|---|---|
| Percentage increase in average attendance | PWHL → AUSL → LOVB → NWSL → WNBA | PWHL → LOVB → AUSL → NWSL → WNBA | Agrees with Analyst; AUSL/LOVB close |
| Absolute increase in spectators per game | PWHL → NWSL → WNBA → AUSL → LOVB | Same | Same |
| Percentage increase in annual rights revenue | PWHL → NWSL → LOVB → AUSL → WNBA | Same | Defers to Analyst |
| Dollar increase in annual rights revenue | NWSL → WNBA → PWHL → AUSL → LOVB | Same | Defers to Analyst |
| Combined percentage-growth forecast | PWHL → NWSL → AUSL → LOVB → WNBA…
The Arbiter's Final Verdict · gpt-6-astra
My verdict
For percentage-growth potential, I rank PWHL first and NWSL second. For absolute growth, I narrowly favor NWSL over WNBA. LOVB is most at risk of stalling. The AUSL–LOVB comparison is substantially less certain because neither publishes the attendance or rights-revenue baselines needed to measure it.
These are forecasts using information public as of September 28, 2026, not numerical projections. The starting point is each league’s season ending in 2026; NWSL’s season is still underway.
Overall rankings: growth through 2030
These rankings balance average attendance and annual rights revenue qualitatively—not through a calculated composite score.
| Rank | Percentage-growth potential | Absolute-growth potential |
|---|---|---|
| 1 | PWHL | NWSL |
| 2 | NWSL | WNBA |
| 3 | AUSL — tentative | PWHL |
| 4 | LOVB — tentative | AUSL / LOVB — indeterminate |
| 5 | WNBA | — |
WNBA’s last-place percentage ranking does not mean weak prospects. It starts from greater commercial scale, and its major rights-contract uplift took effect in 2026—before the growth window being assessed.
Separate rankings…