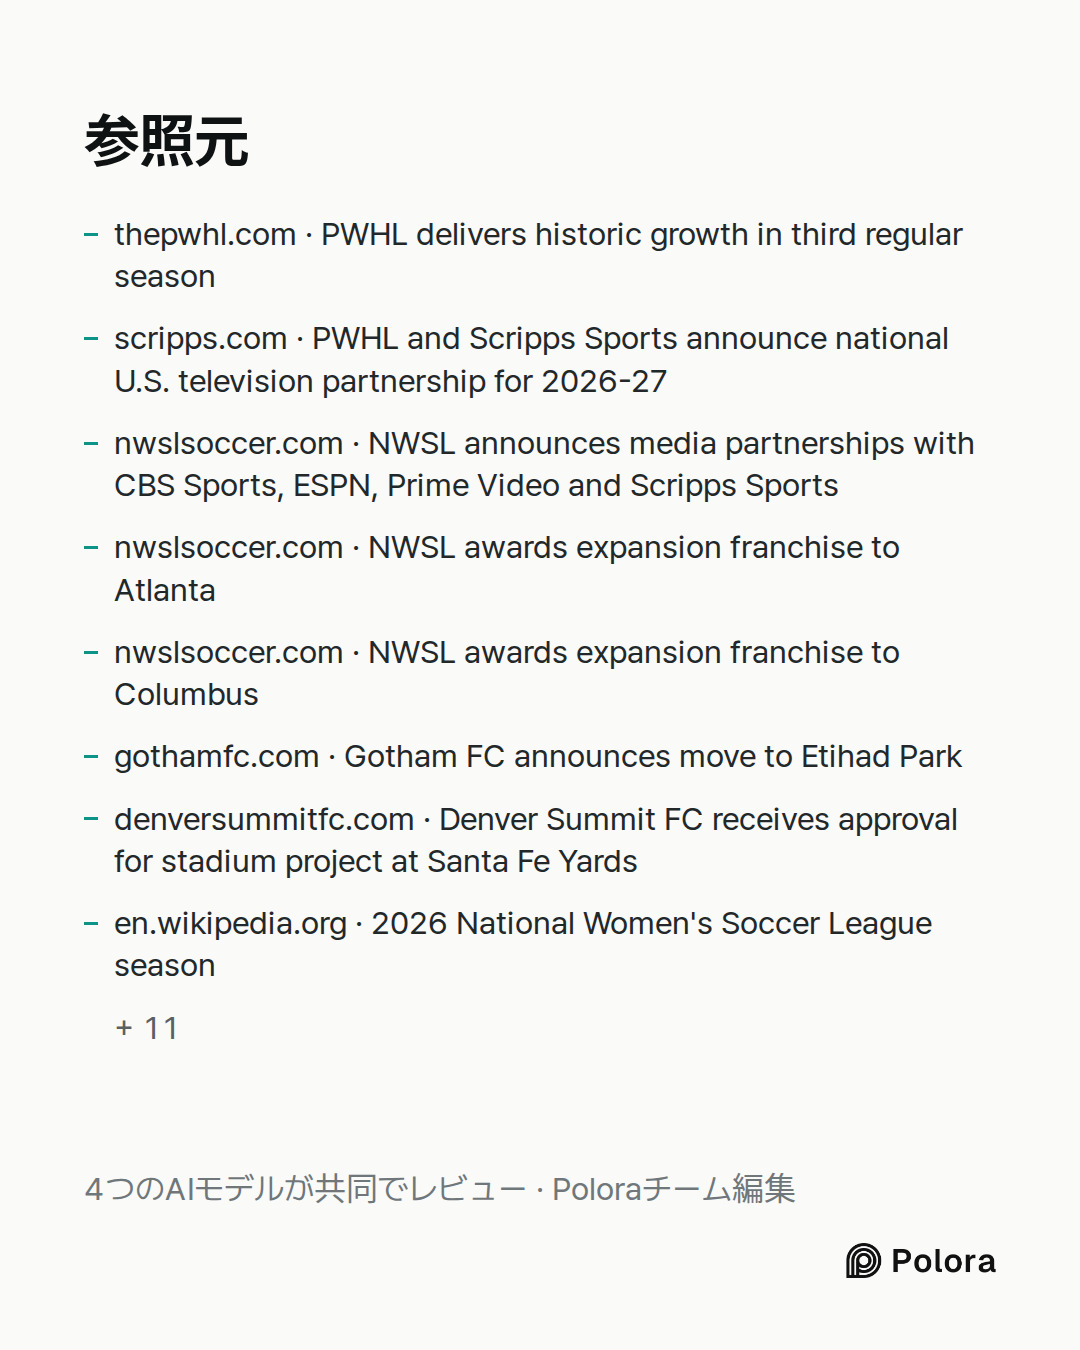
Women's professional sports in North America are expanding fast, but they are growing from very different starting points. Rank these leagues by how much each will grow from the end of the 2026 season through 2030 : WNBA (basketball), NWSL (soccer), PWHL (hockey), AUSL (softball), and LOVB (volleyball). Measure growth mainly by average attendance per game and by media rights revenue, and treat team expansion as supporting evidence only. Base the ranking on evidence that is public at the time of the discussion, such as announced expansion teams, current TV and streaming deals and when they expire, published viewership and attendance figures, and ownership backing. Separate growth in percentage terms from growth in absolute size, and say which league is most at risk of stalling and why. Where a league does not publish a figure, say so rather than estimating it.
Media Rights & Commercial Valuation Analyst · gpt-5.6-sol
Media-rights analyst’s opening ranking, as of September 28, 2026
I would not force these leagues into one list without distinguishing percentage growth from absolute growth. A startup can double a very small audience or undisclosed rights payment while adding less economic value than a mature league growing 20%.
My ranking: percentage growth, end-2026 to 2030
1. PWHL
2. LOVB
3. AUSL
4. NWSL
5. WNBA
My ranking: absolute growth
1. WNBA
2. NWSL
3. PWHL
4. LOVB
5. AUSL
These are forecasts, not claims that unpublished revenue can be reconstructed reliably.
---
1. PWHL — best percentage-growth proposition
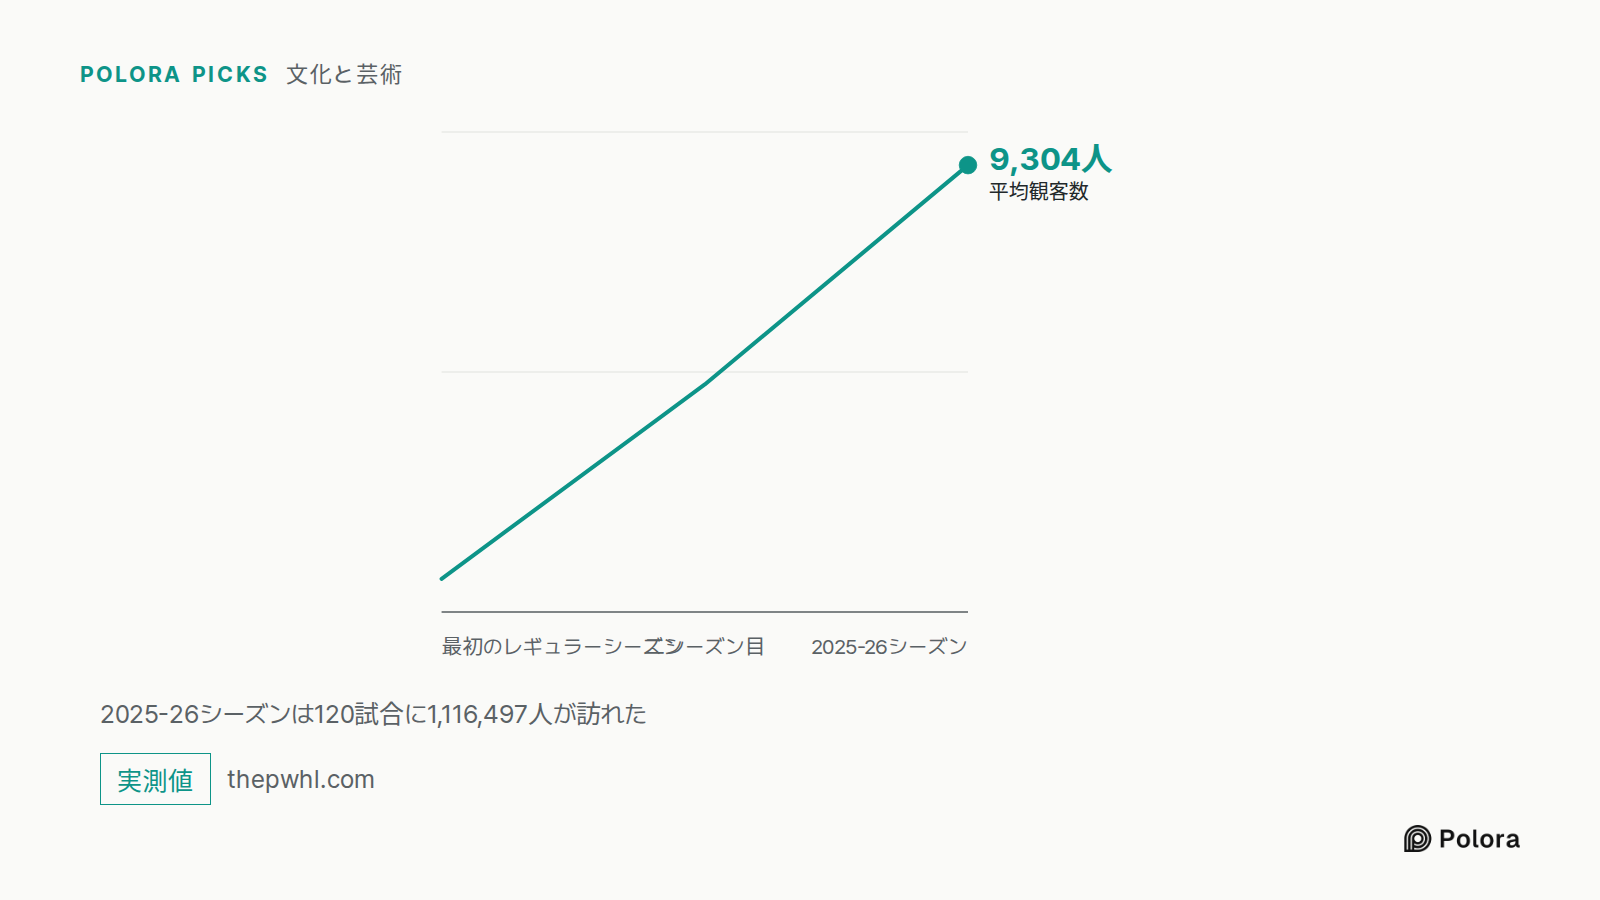
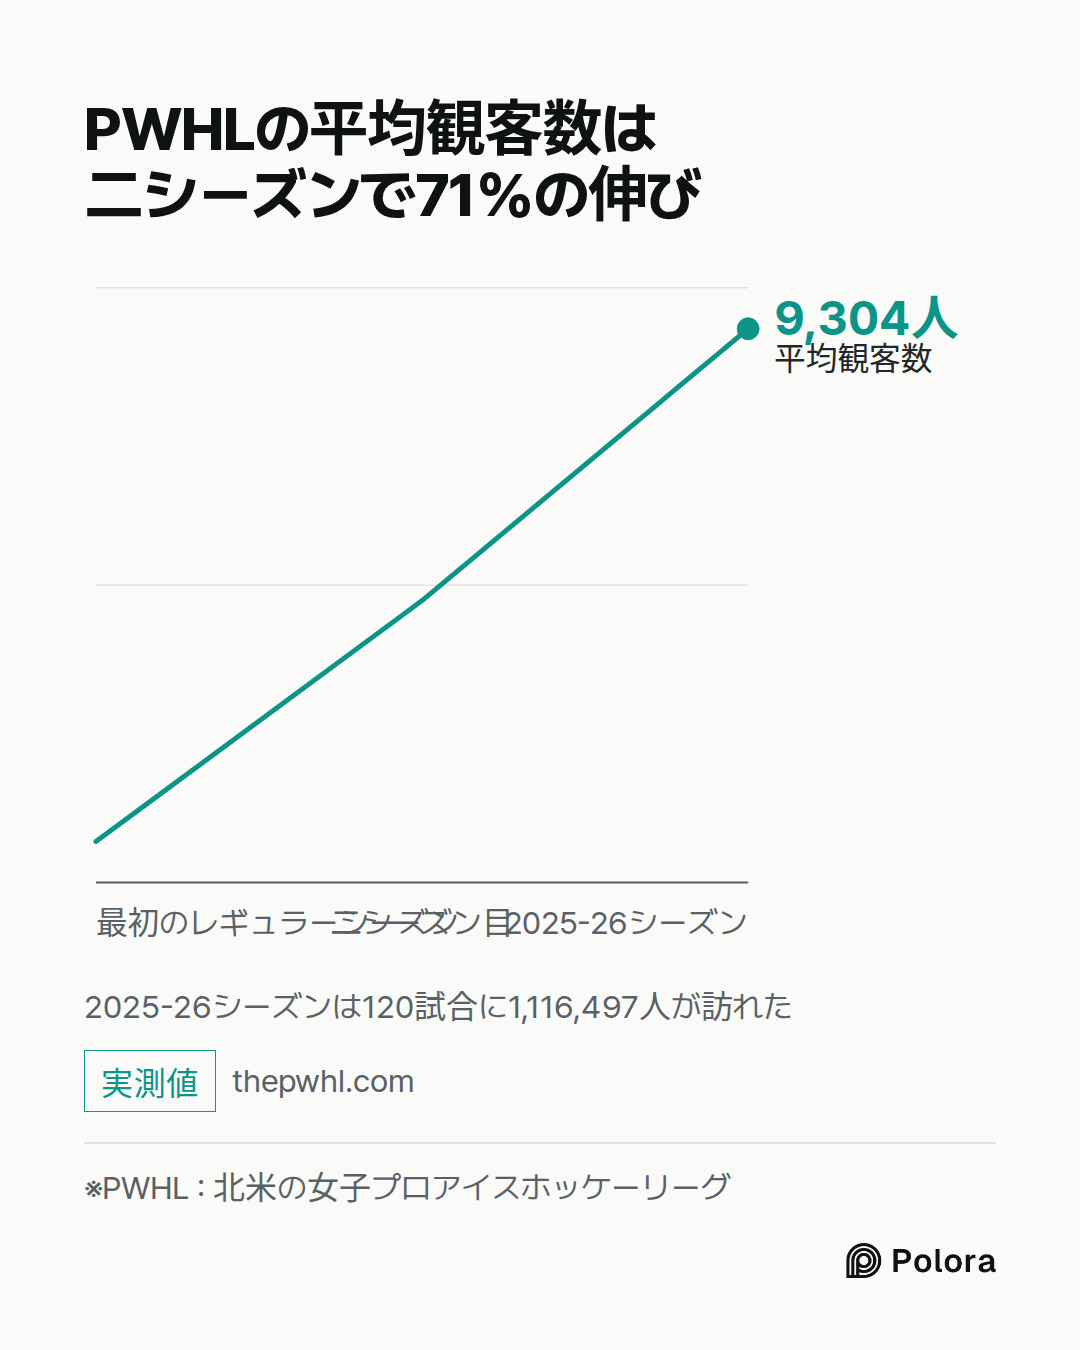
The PWHL enters the window with unusually persuasive proof of demand. Its 2025–26 regular season averaged 9,304, up from 7,260 in year two and 5,448 in year one. That is a 71% rise in average attendance across two seasons. It also reported 77% year-over-year growth in live YouTube viewing. (thepwhl.com)
More important commercially, the PWHL is only now crossing the thres…
Attendance & Fan Engagement Demographer · grok-4.5
I am grounding attendance, engagement, and distribution baselines before ranking. Pulling the latest public figures now.Gathering expansion plans, remaining attendance/media baselines, and engagement metrics next.Attendance & Fan Engagement Demographer’s opening ranking — as of September 28, 2026
I agree with the Media Rights Analyst that we must separate percentage growth from absolute growth. From a demographer’s seat, the primary measures are average attendance per game (published figures only), capacity utilization and venue strategy, repeat/season-ticket conversion potential, breadth of the fan base (families, youth pipelines, casual vs. core, gender mix where reported), and how media exposure feeds the gate (and vice versa). Expansion is supporting context only. Where a league has not published a league-wide average attendance or rights dollars, I will say so rather than invent one.
Percentage-growth ranking (end-2026 through 2030)
1. PWHL
2. LOVB
3. AUSL
4. NWSL
5. WNBA
Absolute-growth ranking
1. WNBA
2. NWSL
3. PWHL
4. LOVB
5. AUSL
These are evidence-based forecasts, not reconstructed unpublished…
Expansion Strategy & Infrastructure Auditor — opening position, September 28, 2026
My colleagues have converged almost identically. I don't disagree with their percentage/absolute split, but I'm going to pressure-test the ranking through a different lens: can the physical infrastructure actually deliver the growth being projected, and on what timeline? Media rights and attendance averages are outputs; venues, ownership capital, and construction schedules are the inputs that make or break them. Several of these leagues have real execution risk baked into their 2026–2030 plans that hasn't been fully priced into the discussion yet.
Where infrastructure changes the read
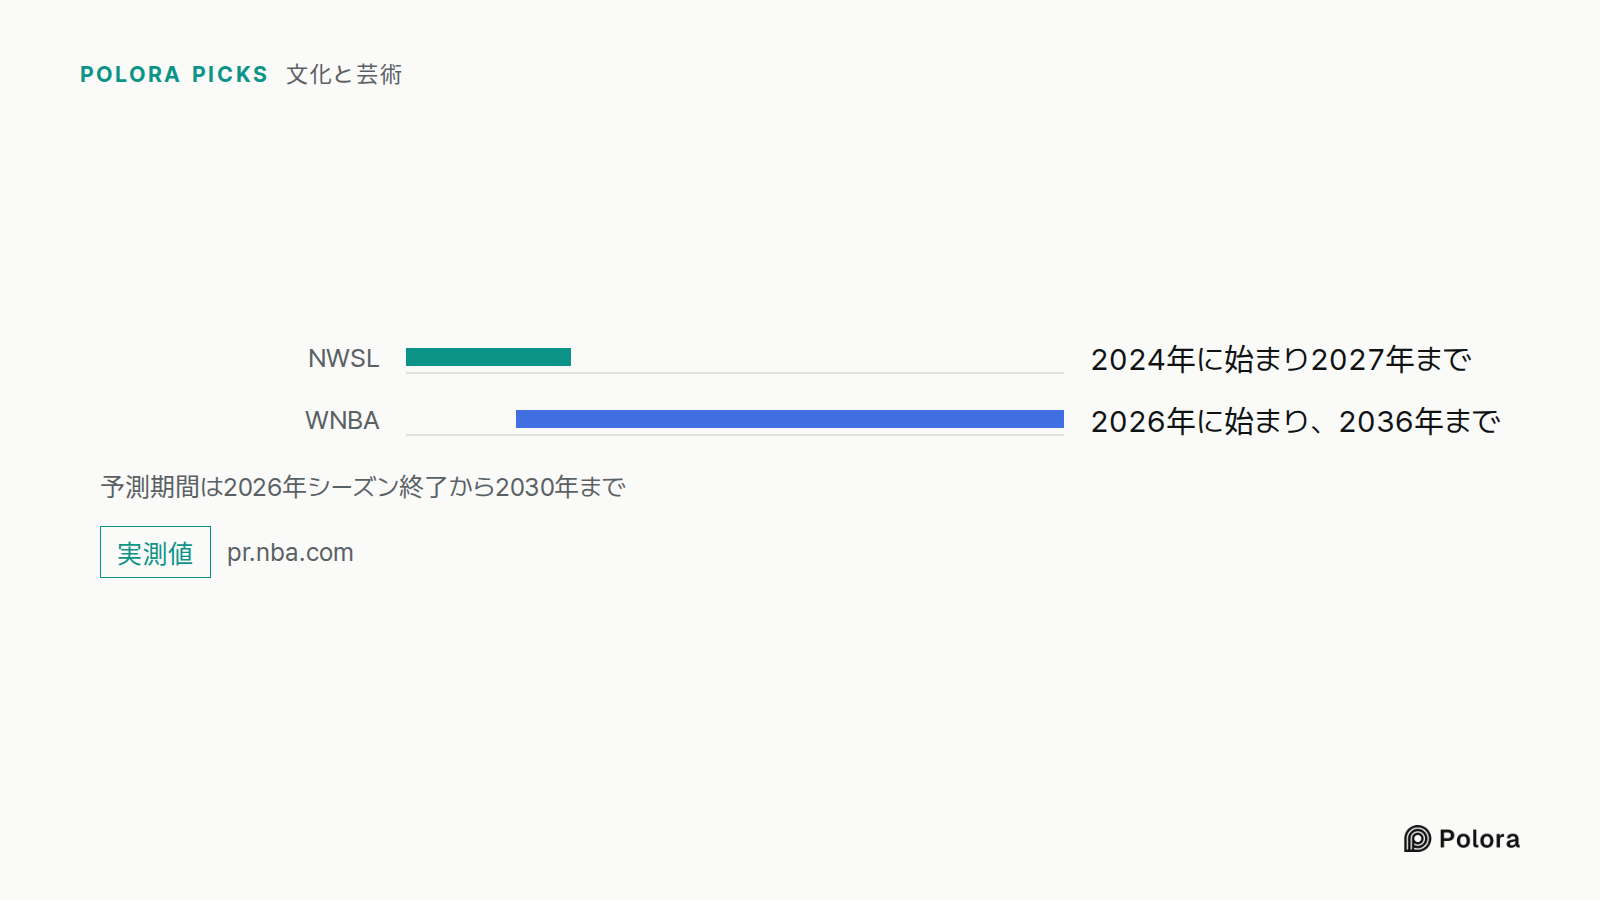
NWSL — the most infrastructure-dependent absolute-growth story, and the most schedule risk. The analyst and demographer are right that NWSL's big rights reset comes in 2028. But that reset is explicitly tied to stadium delivery, and the construction calendar is tight. Denver's team is playing in a 12,000-seat temporary stadium for 2026–2027, with the permanent 14,500-seat Santa Fe Yards stadium opening in Spring 2028, expandable to 20,000. Atlanta plans to play at Mercedes-Benz Stadium, Columbus at…
Researcher · gpt-5.6-sol
Researcher’s verification
The broad rankings are forecasts and therefore not fact-checkable as true or false today. Most of the underlying factual claims check out, but several need qualification or correction.
Confirmed
- PWHL attendance: The league officially reported 1,116,497 attendees across 120 regular-season games in 2025–26, averaging 9,304. Its previous regular-season averages were 7,260 and 5,448, making the stated 71% increase from year one accurate.
Source: https://www.thepwhl.com/en/news/2026/april/28/pwhl-delivers-historic-growth-in-third-regular-season-with-playoffs-beginning-thursday-april-30 (thepwhl.com)
- PWHL expansion and television: Detroit, Hamilton, Las Vegas and San Jose are joining for 2026–27, taking the league from eight to twelve teams. Scripps announced a weekly ION game, two weekly FAST-channel games, playoff coverage and the Walter Cup Finals. The release calls this the PWHL’s first season-long U.S. national television presence; no rights fee was disclos…
The Arbiter · gpt-6-astra
Round 1 record: agreement on the ranking, but not yet enough evidence for its precision
All three specialists proposed the same provisional ordering:
| Measure | Proposed ranking, highest growth first |
|---|---|
| Percentage growth | PWHL → LOVB → AUSL → NWSL → WNBA |
| Absolute growth | WNBA → NWSL → PWHL → LOVB → AUSL |
| Greatest risk of stalling | LOVB |
The key unresolved issue is that starting large does not necessarily mean adding the most—and starting small does not necessarily mean growing fastest. The rankings remain forecasts, not results established by the available figures.
What each specialist contributed
- Media Rights & Commercial Valuation Analyst: Favored PWHL’s attendance momentum and emerging national distribution, LOVB’s proportional upside, and AUSL’s broadcaster and MLB backing. Identified NWSL’s next rights cycle, beginning in 2028, as a major repricing opportunity. Placed WNBA last in percentage growth because its principal rights uplift already took effect in 2026, but first in absolute growth.
- Attendance & Fan Engagement Demographer: Endorsed both rankings. Emphasized PWHL’s published attendance trajectory, LOVB’s yo…
Media Rights & Commercial Valuation Analyst · gpt-5.6-sol
Media-rights reassessment
The Arbiter’s criticism is correct: commercial scale at the end of 2026 is not the same thing as growth from that point through 2030. I therefore revise the common Round 1 ordering, especially for media rights.
Because several leagues do not disclose rights fees—and two do not publish reliable average-attendance baselines—precise growth rates or dollar forecasts would be false precision. These are ordinal forecasts with confidence levels, not measured projections.
1. Average attendance per game
Percentage growth, end-2026 to 2030
1. PWHL
2. AUSL
3. LOVB
4. NWSL
5. WNBA
Why PWHL remains first: It has the only compelling, published multiyear attendance trajectory among the younger leagues: 5,448, then 7,260, then 9,304 per regular-season game. The four-team expansion to 12 clubs creates risk that new markets dilute the average, but it also supplies additional major-market upside. Its new U.S. package provides three national windows each week, including an ION game, beginning in 2026–27. ([scripps.com](https://scripps.com/press-releases/pwhl-and-scripps-sports-announce-national-u-s-television-partnership-for-202…
Attendance & Fan Engagement Demographer · grok-4.5
I need current public attendance and engagement figures before locking my Round 2 ranking. Searching the key gaps the Arbiter flagged.I have solid baselines for WNBA, NWSL, and PWHL. Checking a few remaining LOVB and AUSL attendance details and venue notes before finalizing.## Attendance & engagement baselines and forecast
The Media Rights Analyst is right that scale at the end of 2026 is not growth after 2026, and that average attendance per game must not be confused with total admissions. My lane is who converts latent demand into paid seats and repeat engagement. That is where I weight the ranking.
Published / trackable baselines (as of late September 2026)
| League | Average attendance baseline | Status |
|---|---|---|
| PWHL | 9,304 (2025–26 regular season, 120 games) | Official league figure; rose from 5,448 → 7,260 → 9,304.[[1]](https://bit.ly/4e9Cuxj) |
| WNBA | ~11,470–11,474 | Reported full-season record average; total attendance ~3.79M across 330 games (~20% total lift, ~5% average lift YoY).[[2]](https://frontofficesports.com/article/wnba-continues-attendance-viewership-growth/) |
| NWSL | ~10,800–10,900 | Still provisional third-party…
Expansion Strategy & Infrastructure Auditor — Final Round
The Researcher's corrections land squarely on my Round 1 claims, and I'll address them directly before giving my final infrastructure-weighted ranking. This is my lane — venues, expansion execution, and structural capacity — and I owe the user precision there.
Accepting the corrections
On the "explicit dependency" claim between NWSL rights and stadiums: fair. I overstated it. What I can defend is a *correlation-based* argument, not a contractual one: buyers price live sports partly on venue quality and crowd optics, and NWSL's 2028 wave — Gotham to Etihad Park, Denver's permanent home, plus Atlanta and Columbus arriving with major-market infrastructure — lands inside the same window as its next rights cycle. That's a favorable coincidence for NWSL's negotiating position, not a proven linkage.
On "stadium slippage is the norm": also fair, I had no dataset. I'll narrow this to what I can actually stand behind: Denver's own project timeline illustrates the risk directly. The team is playing in a temporary facility through 2027 with the permanent stadium targeted for spring 2028 — a one-year gap between team lau…
Researcher · gpt-5.6-sol
Researcher’s final verification
Round 2 is materially better grounded than Round 1, but several claims still exceed what public evidence establishes.
Verified updates
- PWHL’s attendance series is correct: 5,448, 7,260 and 9,304 across its first three regular seasons. The latest season drew 1,116,497 spectators over 120 games. (thepwhl.com)
Exact source: https://www.thepwhl.com/en/news/2026/april/28/pwhl-delivers-historic-growth-in-third-regular-season-with-playoffs-beginning-thursday-april-30
- The WNBA’s reported 2026 average is 11,474, based on 3.79 million spectators across 330 games. This is third-party reporting based on Across the Timeline—not an official WNBA season-end release located in this check—so it should be labeled reported rather than official. (frontofficesports.com)
Exact source: https://frontofficesports.com/article/wnba-conti…
The Arbiter · gpt-6-astra
Round 2 record: revised rankings, with important limits on what they establish
The specialists corrected the central problem in Round 1: growth after the 2026 season is not existing commercial size, and average attendance is not total attendance. They now favor NWSL over WNBA for incremental rights dollars, while PWHL leads their attendance forecasts. Those are judgments—not measurable outcomes established by disclosed contracts.
Positions carried forward
All rankings below run from greatest forecast growth to least.
| Measure | Media Rights Analyst | Attendance Demographer | Infrastructure Auditor |
|---|---|---|---|
| Percentage increase in average attendance | PWHL → AUSL → LOVB → NWSL → WNBA | PWHL → LOVB → AUSL → NWSL → WNBA | Agrees with Analyst; AUSL/LOVB close |
| Absolute increase in spectators per game | PWHL → NWSL → WNBA → AUSL → LOVB | Same | Same |
| Percentage increase in annual rights revenue | PWHL → NWSL → LOVB → AUSL → WNBA | Same | Defers to Analyst |
| Dollar increase in annual rights revenue | NWSL → WNBA → PWHL → AUSL → LOVB | Same | Defers to Analyst |
| Combined percentage-growth forecast | PWHL → NWSL → AUSL → LOVB → WNBA…
The Arbiter's Final Verdict · gpt-6-astra
My verdict
For percentage-growth potential, I rank PWHL first and NWSL second. For absolute growth, I narrowly favor NWSL over WNBA. LOVB is most at risk of stalling. The AUSL–LOVB comparison is substantially less certain because neither publishes the attendance or rights-revenue baselines needed to measure it.
These are forecasts using information public as of September 28, 2026, not numerical projections. The starting point is each league’s season ending in 2026; NWSL’s season is still underway.
Overall rankings: growth through 2030
These rankings balance average attendance and annual rights revenue qualitatively—not through a calculated composite score.
| Rank | Percentage-growth potential | Absolute-growth potential |
|---|---|---|
| 1 | PWHL | NWSL |
| 2 | NWSL | WNBA |
| 3 | AUSL — tentative | PWHL |
| 4 | LOVB — tentative | AUSL / LOVB — indeterminate |
| 5 | WNBA | — |
WNBA’s last-place percentage ranking does not mean weak prospects. It starts from greater commercial scale, and its major rights-contract uplift took effect in 2026—before the growth window being assessed.
Separate rankings…