The margin of error on a lead is about twice the one you see
A new poll shows one candidate at 48 percent and the other at 44, with a margin of error of plus or minus 3 points. Most people read that as a 4-point lead that is bigger than the margin of error. It isn't.
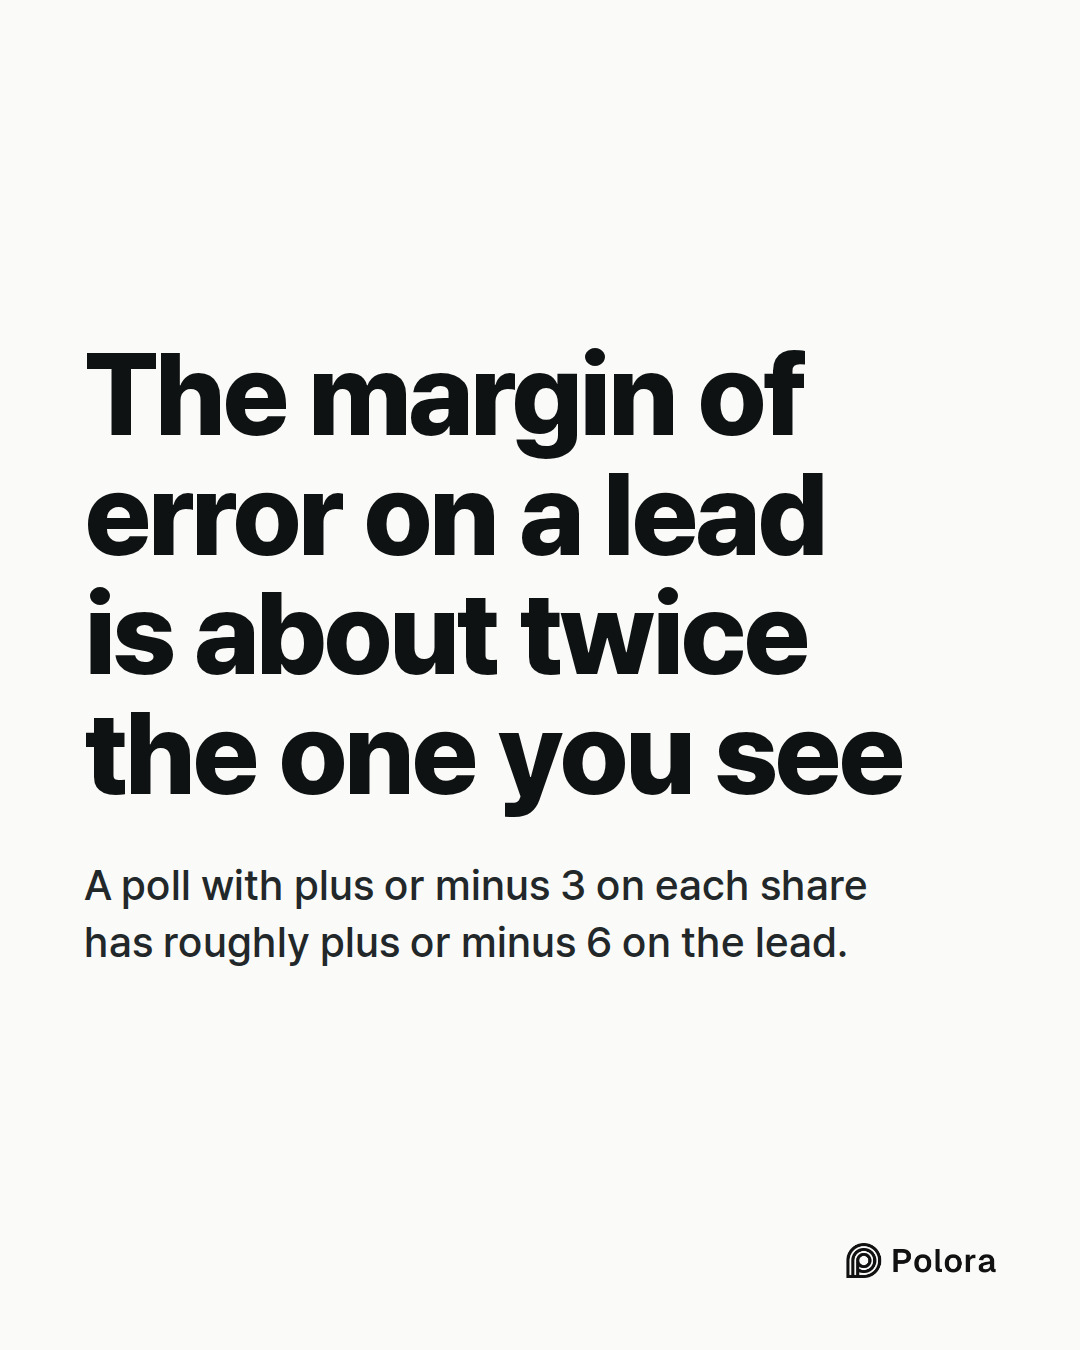
The plus or minus 3 applies to each candidate's share taken on its own. The lead is the difference between two numbers that are both uncertain, and in a two-way race they move in opposite directions. If the sample happened to catch too many of one candidate's supporters, it almost certainly caught too few of the other's. The error on the gap is therefore larger than the error on either share. Pew Research Center puts it plainly : the margin for the difference is generally about twice the margin for an individual candidate. A poll with plus or minus 3 on each share has roughly plus or minus 6 on the lead. That is a rule of thumb, not an exact formula, and it works best when the two candidates together take nearly all of the vote.
Apply that to the 4-point lead. The plausible range for the true gap runs from the leader trailing by about 2 points to leading by about 10. The lead might be real, or the trailing candidate might actually be ahead. Pew's own worked example uses a 5-point lead with the same poll size : the true gap could plausibly sit anywhere from minus 1 to plus 11, so the leader would need to be ahead by about 6 points before sampling luck could be ruled out.
Why poll numbers for young or minority voters swing so much
The reported margin covers the whole sample. When a story zooms in on a slice of it, such as voters under 30 or one region, far fewer people are behind the number. Pew gives the example of a subgroup with plus or minus 8 points on each candidate, which becomes plus or minus 16 on the gap between them.
Some groups are also harder to reach. Pew notes that young people and minorities respond to surveys less often, so pollsters count their answers more heavily to bring them up to their true share of the population. That step, called weighting, makes the sample more representative, but it also widens the margin of error. A dramatic swing inside one subgroup between two polls is often just noise.
What the margin of error doesn't cover
The margin of error measures only one thing : the chance that a random sample of about a thousand people differs a little from everyone else, the way hands in a card game differ from deal to deal. It says nothing about the other ways a poll can go wrong.
Pew lists three of them. Some people can't be reached at all by the method used, which is called coverage error. Some groups are less willing to answer, which is nonresponse. Some people misunderstand a question or don't say what they really think, which is measurement error. Election polls add one more guess : deciding which respondents will actually vote. Pollsters build what are called likely-voter models to make that call, and turnout is hard to predict.
When researchers check polls against actual results, the gap is bigger than the stated margin suggests. A study of more than 4,000 state-level polls from 1998 to 2014, by statisticians at Stanford, Microsoft Research and Columbia, found a typical error of about 3.5 points on a candidate's share. That figure is a root-mean-square error, a way of averaging that gives extra weight to bigger misses, and it is roughly twice what the reported margins implied. Pew and the American Association for Public Opinion Research, the main professional body for pollsters, now use the same rule of thumb : the real potential for error is about double the reported figure. That doubling is separate from the one that applies to a lead, and the two should not be multiplied into a single margin for the lead. The reported margin shows neither.
Why an average of polls beats any single poll, up to a point
Two good polls taken the same week will come out a point or two apart, because they reached different people. Averaging many polls cancels much of that random noise, and it also evens out the quirks of individual pollsters. AAPOR's guidance says averages take the focus off individual results, which carry a lot of noise from normal variation, and give a clearer view of trends.
Averaging has a limit. The same study that found polls' true error was about double the stated margin also found that polls of the same race tend to miss in the same direction, by about 1.5 to 2 points on average. The authors suggest why : pollsters struggle to reach the same groups and use similar rules to decide who will vote. An average can't cancel an error that every poll shares. So a lead that holds up across many polls is much more believable than one from a single survey, but an average is not a guarantee either.
How far off were US polls in 2016, 2020, 2022 and 2024?
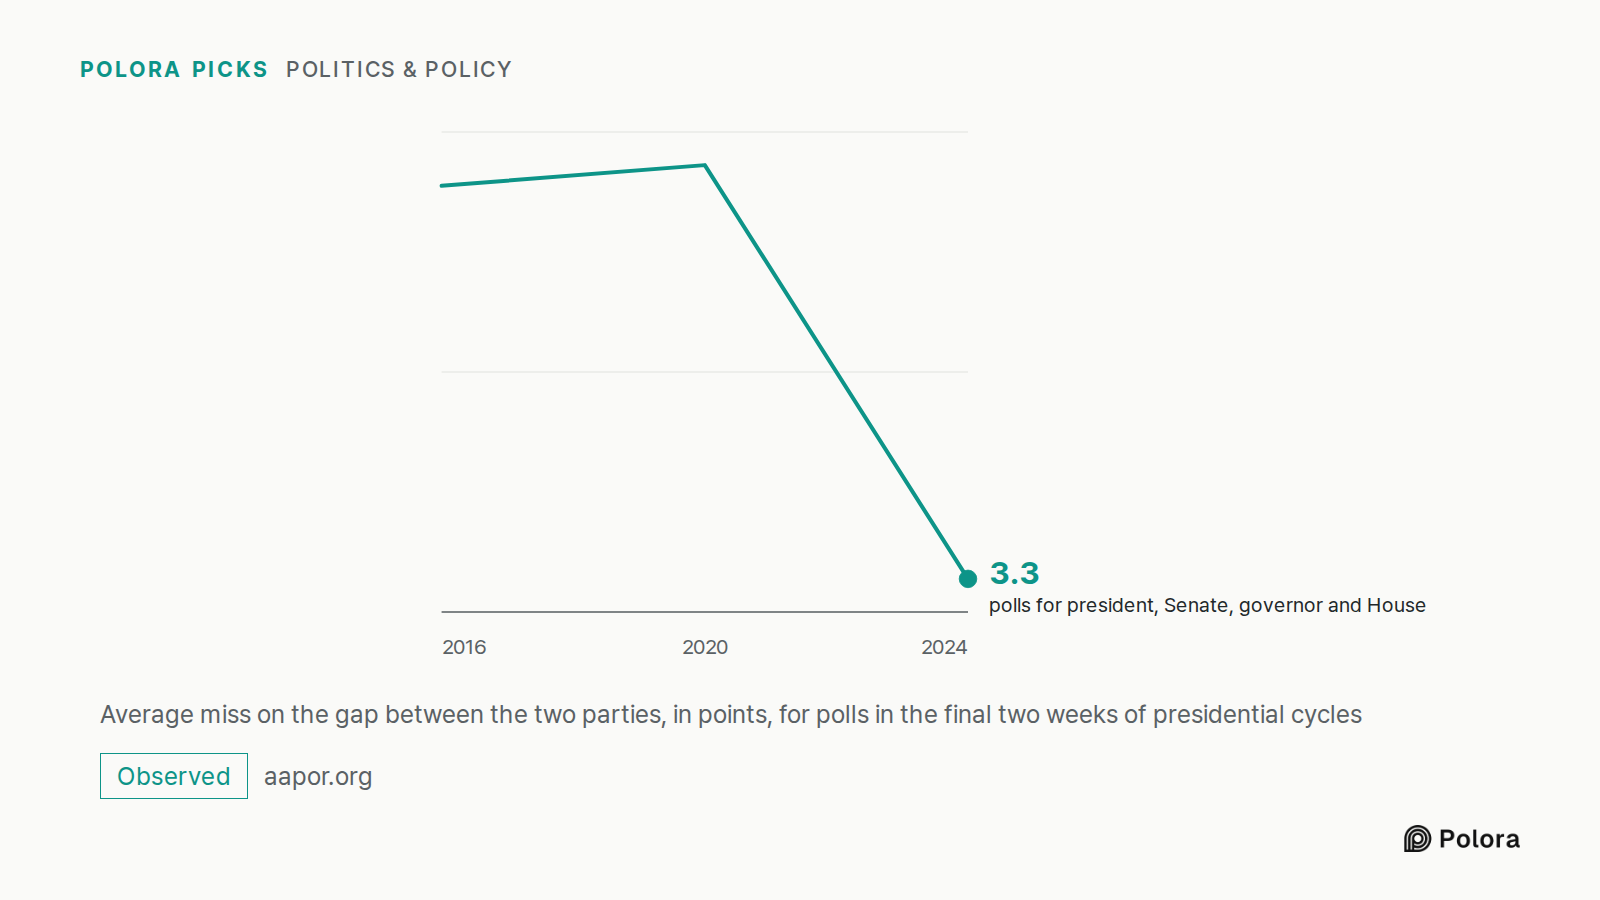
AAPOR reviews every presidential cycle. Its 2024 report looked at 611 polls for president, Senate, governor and House taken in the final two weeks of the campaign. On average they missed the final gap between the two parties by 3.3 points. That was an improvement on 5.3 points in 2020 and 5.2 in 2016. National presidential polls missed by 2.6 points on average, and state presidential polls by 3.0. The report says state polls were more accurate than in any presidential cycle since 1944.
These figures measure error on the gap itself, the same number as the lead in a headline. So even in a good year, the typical final poll was off on the gap by about as much as the leads that make news. And these are polls from the last two weeks. A poll taken a month or more before election day is not covered by these benchmarks, and voters' preferences have more time to move after it.
The direction of the miss matters too. In 2016, 2020 and 2024, polls underestimated Republicans, by 2.7 points on the margin in 2024 compared with 4.6 in 2020. In the 2022 midterms the small average miss went the other way, overestimating Republicans by 0.6 points. AAPOR notes that since the 1930s, each party has been underestimated about equally often, and polls rarely miss in the same direction for more than a couple of presidential elections in a row. Last cycle's miss is not a reliable guide to the next one's.
Why pollsters don't just shrink the margin to 1 point
Brazil votes on October 4, and its voters are asking the same question. BBC News Brasil, in an article republished by the Brazilian newspaper O Povo, set out the arithmetic that limits every poll. To get a margin of plus or minus 3 points you need to interview about 1,068 people. For plus or minus 2 you need about 2,401. For plus or minus 1 you need about 9,604, which is too expensive for most polls. Cutting the margin in half takes about four times as many interviews.
That is why polls settle for margins of a few points rather than one. Most Brazilian election polls, according to the same article, report around plus or minus 2. It is also why a lead of a few points so often sits inside the noise. Raphael Nishimura, a survey statistician at the University of Michigan quoted by the BBC, describes a poll as a snapshot of the moment, not a prediction. A series of polls over time is closer to the film.
How to read the next poll with a small lead
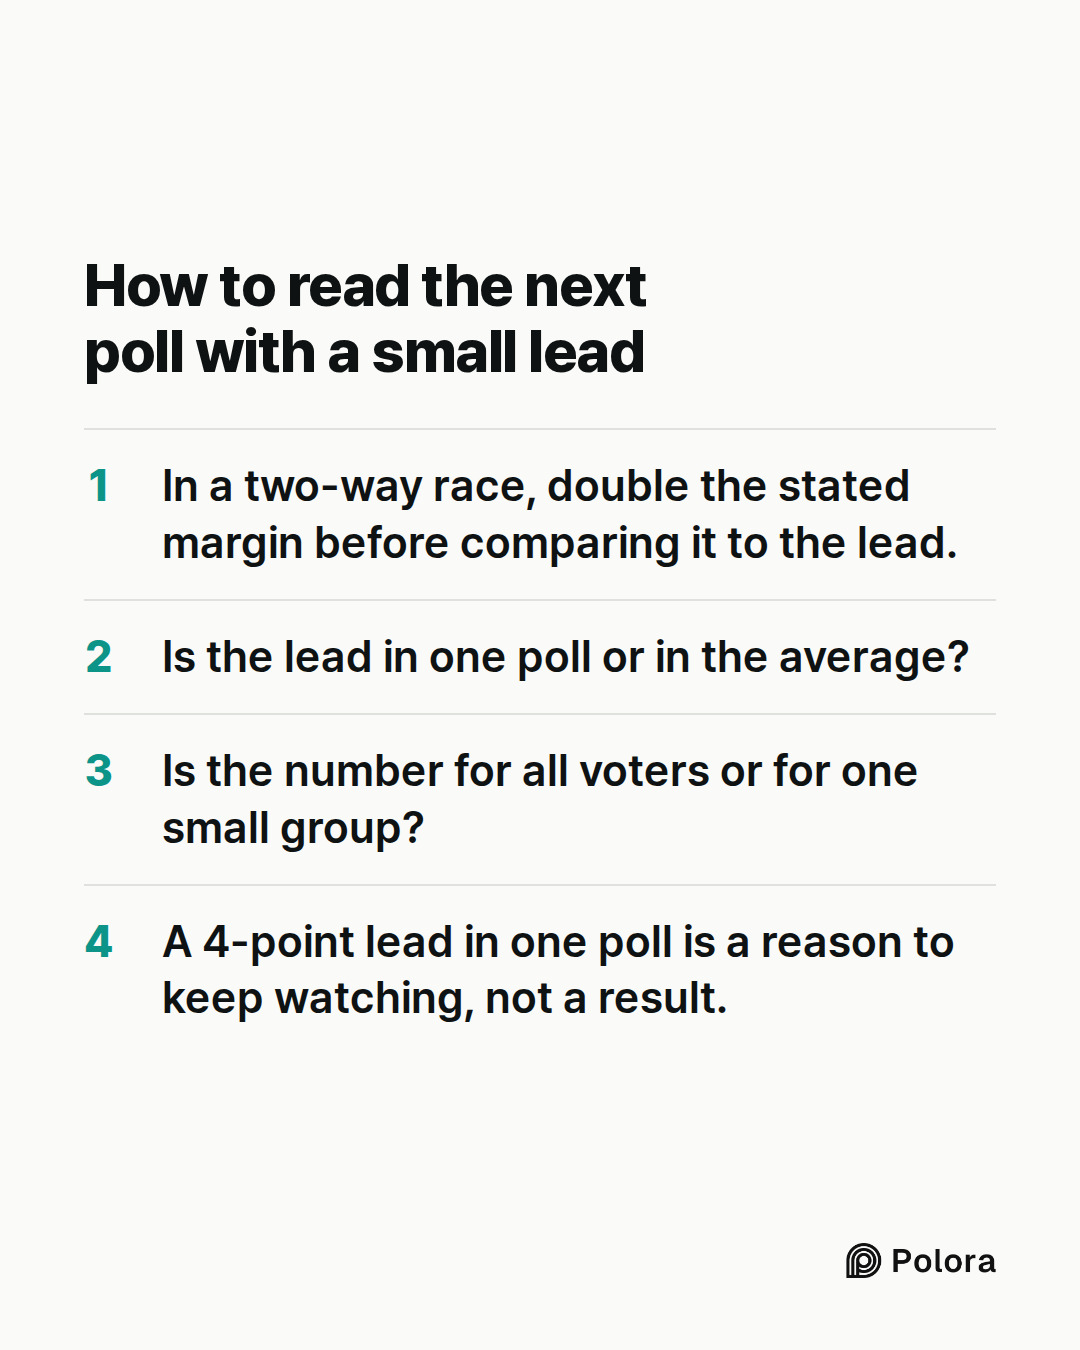
In a two-way race, double the stated margin before comparing it to the lead. If the lead is smaller than that, the poll has shown who was ahead among the people it reached, but not who is ahead among all voters. It has shown the race is close. A lead bigger than that is still not a forecast, because the errors the margin leaves out remain and opinion can shift before election day.
Then look beyond the single number. Is the lead in one poll or in the average? Is the number for all voters or for one small group? Remember that even in 2024, a good year, final polls missed the gap by about 3 points on average. None of this makes polls useless. Across many surveys they are usually within a few points. A few points is simply what a close race looks like, and a 4-point lead in one poll is a reason to keep watching, not a result.