What student loan repayment data can and cannot tell you
New federal data flags roughly two thousand schools where many borrowers fall behind. Here is what that warns a would-be borrower about, and what it cannot say.
Business & Economy · 2026-09-18
A new batch of federal data has put a number on something students used to learn only after the fact : at some colleges, many of the people who borrowed to attend cannot keep up with the loans afterward. The figures name roughly two thousand schools, and the worst results cluster at for-profit career colleges. For anyone weighing whether a particular degree or program is worth going into debt for, the natural question is what these numbers actually prove.
Polora put that question to several AI models built by different companies and had them read the same federal releases together. They agreed on the core reading and split, usefully, over what a borrower should do with it. This is what they found.
What the new number actually counts
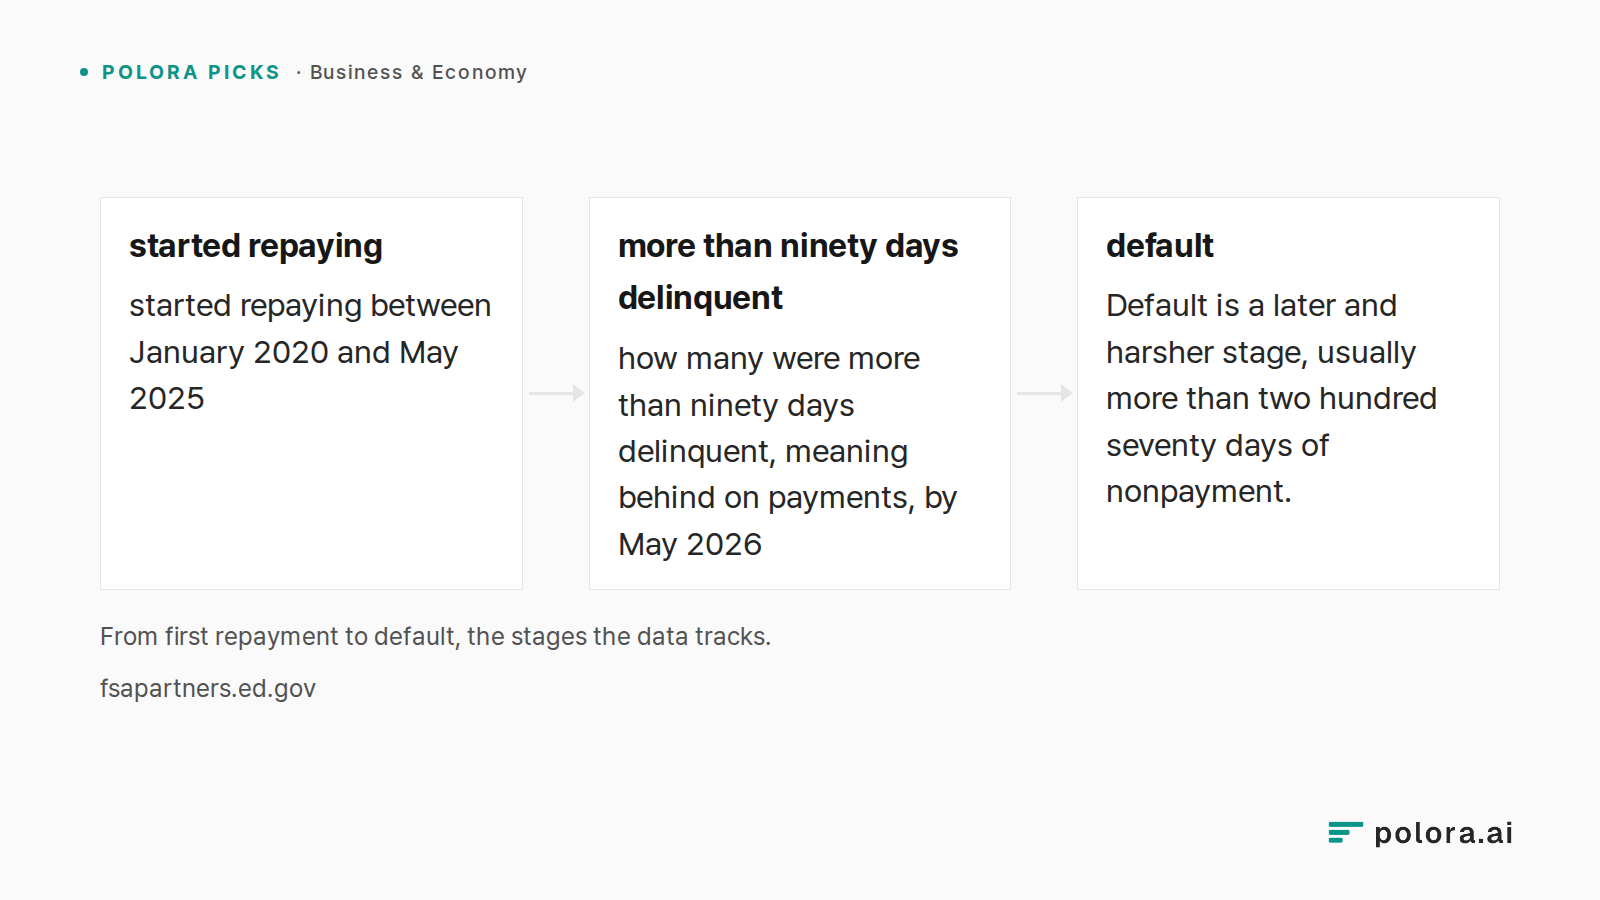
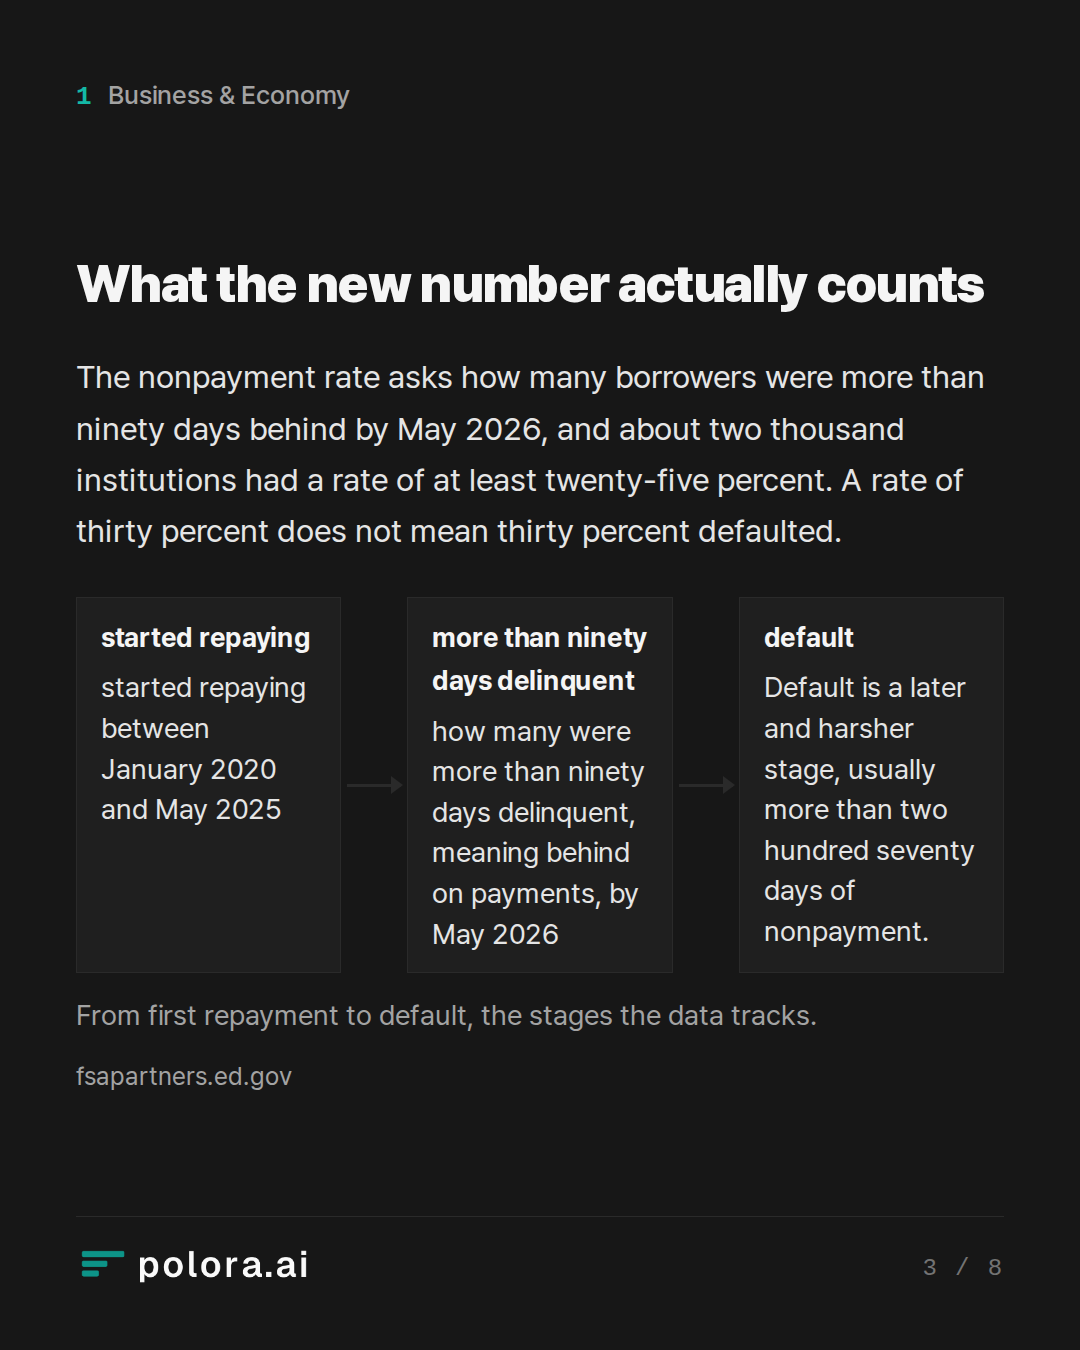
The headline figure is an institutional nonpayment rate. It looks at people who took federal Direct Loans, started repaying between January 2020 and May 2025, and asks how many were more than ninety days delinquent, meaning behind on payments, by May 2026. Federal Student Aid reported that about two thousand institutions had a nonpayment rate of at least twenty-five percent.
It helps to be literal about what that means. A rate of thirty percent means that, of the borrowers the measure covers, roughly three in ten were seriously behind on the snapshot date. It does not mean thirty percent defaulted, that thirty percent will never repay, or that the school lost that share of the money. Default is a later and harsher stage, usually more than two hundred seventy days of nonpayment. The nonpayment rate is the earlier tremor.
From first repayment to default, the stages the data tracks. · started repaying · more than ninety days delinquent · default · started repaying between January 2020 and May 2025 · how many were more than ninety days delinquent, meaning behind on payments, by May 2026 · Default is a later and harsher
A second number travels with these stories : as of the end of March 2026, about nine million borrowers owed roughly two hundred twenty billion dollars in defaulted federal loans. It is worth being careful here. That figure is systemwide. It is not a measure of losses caused by for-profit colleges, and it is not the amount taxpayers ultimately lose.
Defaulted loans are still legally collectible. Some of that balance will be repaid, rehabilitated, or consolidated; some will be discharged; some will never be recovered. Public money is involved through collection costs, subsidies, and balances that go unpaid, but the data in front of the panel did not put a figure on the final cost to taxpayers. The honest version of the taxpayer claim is narrower than the headline : the public carries part of what goes unpaid, and no one in this record could say how much.
The models agreed on the useful part. A high nonpayment rate is a warning label, not a report card. It does not certify that a school teaches badly, and it does not prove any individual will struggle. What it does say is concrete : people who borrowed to attend this place have, in large numbers, been unable to stay current on the debt.
That is most valuable as a comparison. Look up the same credential at more than one school, alongside the typical debt, completion rates, and earnings afterward, and the poor performer stands out. The model in the economist role put the logic simply : a prospective student does not need proof that the school caused the outcome, only a sense of whether people in a similar position managed the resulting debt. If similar borrowers routinely fell behind, and a cheaper route leads to the same job, the burden shifts to the expensive school to show why it is worth the difference.
The same models were firm about the limits. The biggest is selection : schools enroll different people. A college that serves more low-income, first-generation, or working-adult students may post worse repayment even when it adds real value, simply because its students have less financial cushion. A raw rate cannot separate that from weak teaching, high prices, or a low-paying field.
There are others. The measure cannot predict one person's outcome. It often misses private loans, family borrowing, and money paid out of pocket. It lags, so this year's tuition and newest programs are not fully in it. Small programs get suppressed for privacy. And it is easy to picture these borrowers as graduates, when the pool can include people who attended but never finished, and leaving without the credential is itself one of the surest paths into repayment trouble. People sometimes reach for an older College Scorecard repayment measure instead, but that is a separate, weaker gauge, last updated in 2018, and should not be mistaken for the new series.
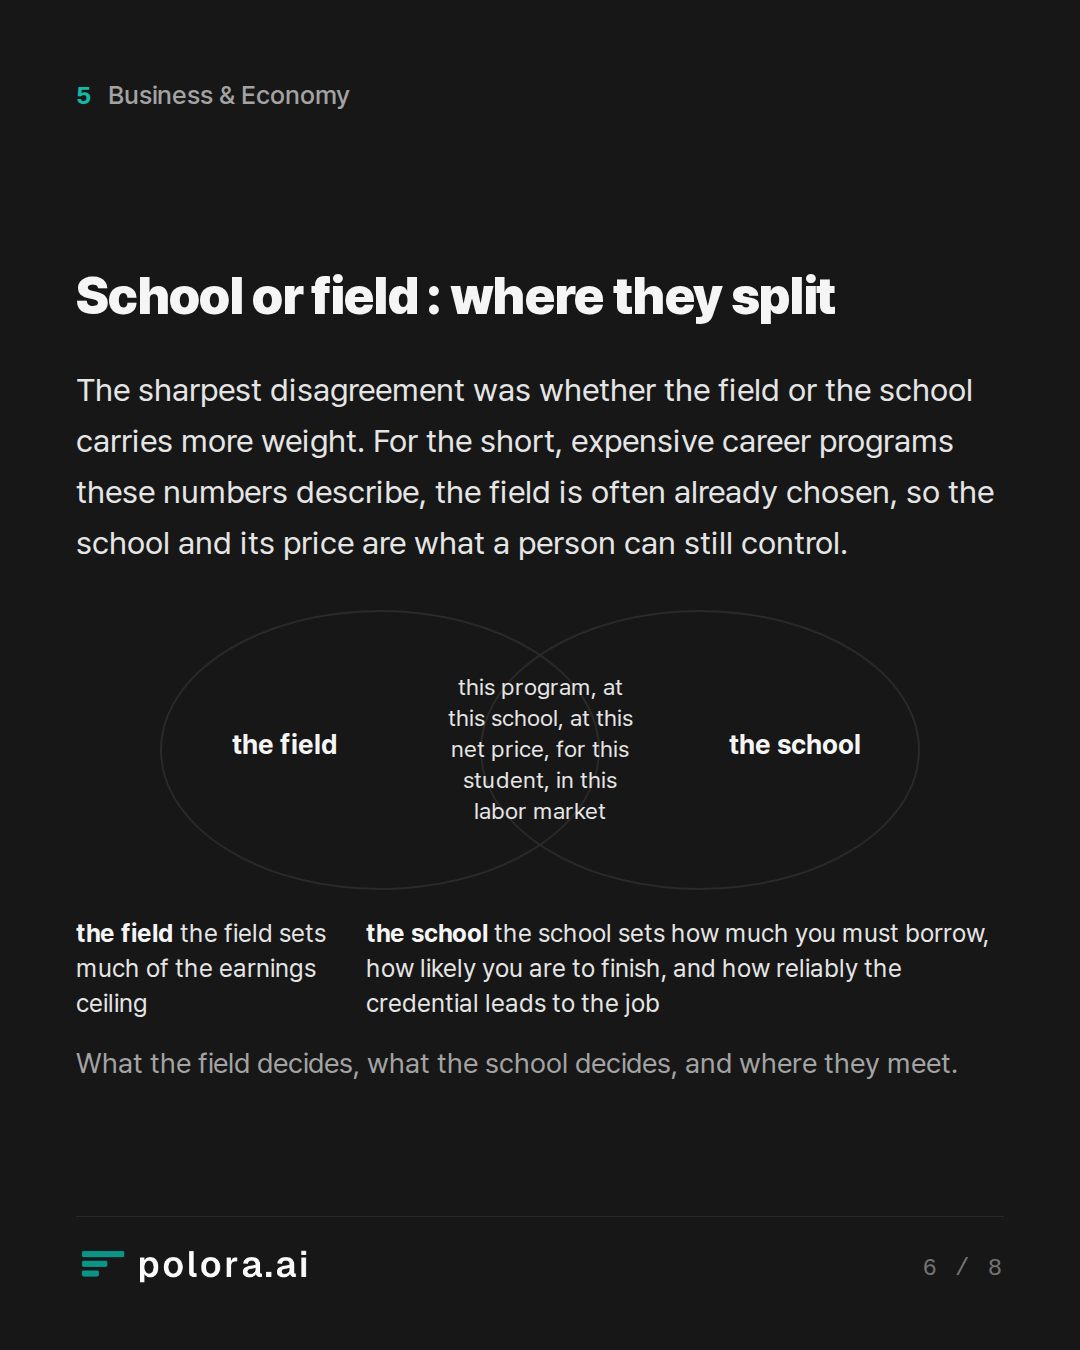
The sharpest disagreement was about what carries more weight, the field you enter or the school you pick. The model in the economist role treated them as roughly co-equal and said the interaction is what decides : this program, at this school, at this net price, for this student, in this labor market. The model cast as an institutional analyst wanted extra weight on the institution itself, arguing that ownership changes, past sanctions, and accreditation trouble reveal risks a lagging repayment number cannot.
The model in the consumer-advocate role pushed hardest. For the short, expensive career programs these numbers describe, it argued, the field is often already chosen, so the school and its price are the variable a person can still control. The labor market for a welder or a dental assistant does not pay more because the training cost twenty thousand dollars at a chain rather than a fraction of that at a community college.
The panel's synthesis is a clean way to hold both : the field sets much of the earnings ceiling, and the school sets how much you must borrow, how likely you are to finish, and how reliably the credential leads to the job. A low-paying occupation cannot support large debt anywhere; a well-paying one can still be spoiled by paying far too much to reach it.
What the field decides, what the school decides, and where they meet. · the field · the field sets much of the earnings ceiling · the school · the school sets how much you must borrow, how likely you are to finish, and how reliably the credential leads to the job · the interaction · this program, at
One point cut across the whole discussion : a school's continued access to federal aid is not a seal of approval. The rules meant to shut down bad-outcome programs are mid-overhaul. The Department of Education is replacing its earlier gainful-employment metric with a new earnings-based accountability system, and by the panel's reading the replacement does not fully take over until July 2027, with real consequences later still. A separate rule that limits how much of a for-profit college's revenue can come from federal aid, the so-called ninety-ten rule, was loosened in 2025.
The practical lesson the institutional-analyst model drew : with enforcement running years behind, the repayment data is doing more of the protective work than the regulator is, so a borrower cannot assume that an open school is a safe one. One new consumer signal did arrive. Since December 2025, some first-year applicants see a warning on the federal aid form when a school's graduates typically earn less than high-school graduates in their state. It changes nothing about eligibility; it is a flashing light.
Rather than rank schools by prestige, the models converged on a short list of questions to settle before signing for a loan. What is the net price after grants, treating loans as debt rather than aid? How much will you have to borrow in total to finish, not just in the first year? Do students actually complete the program, pass any required licensing exam, and land jobs that need the credential? What do the earnings look like against a realistic, not best-case, salary, and against the same credential at a nearby public college, apprenticeship, or hospital program?
Their shared conclusion was modest and worth carrying. Use the repayment numbers to screen for danger, not to score teaching quality. When former borrowers at a school are widely failing to pay and the same occupation is reachable more cheaply, the participants agreed that avoiding the extra debt is usually the sound choice. When no comparable alternative exists, a bad number is a reason to dig into the specific program, not to look away. The figure is a smoke alarm : it does not tell you what is burning, but it is not a sound to ignore.
A new wave of federal data shows that graduates of certain colleges, especially for-profit schools, struggle far more than others to repay their student loans, and taxpayers end up absorbing much of what goes unpaid. Investigate what this repayment data can and cannot tell someone who is deciding whether a specific degree or program is worth borrowing for. Lay out how the participants read the evidence, where they agree, and where they split on how much the choice of school matters versus the choice of field. Explain it plainly for a reader who has never seen these repayment numbers before.
Higher Education Economist · gpt-5.6-terra
Higher Education Economist
The new federal repayment data are best understood as a consumer-warning signal, not a verdict on every student or every degree.
What the numbers measure
There are two related but different federal measures people may encounter:
1. College Scorecard repayment rates: the share of former borrowers whose federal-loan balance has fallen below its original amount after entering repayment. This is stricter than simply being current: a borrower can make payments yet see the balance grow because interest exceeds the payment. The traditional Scorecard measure is based on undergraduate borrowing at the reported institution, excludes people in school or military deferment at the measurement date, and can assign pieces of a consolidated loan to more than one school. (collegescorecard.ed.gov)
2. The newer institutional nonpayment rate: the share of Direct Loan borrowers who entered repayment between January 2020 and May 2025 and were more than 90 days delinquent. Federal Student Aid updated these figures through May 2026 and reported that roughly 2,000…
Institutional Analyst · claude-sonnet-5
Institutional Analyst
The Economist laid out the measurement mechanics well. I want to add the piece that's easy to miss: why the accountability rules keep changing underneath this data, and what that instability means for a reader trying to use it right now.
The regulatory backdrop matters for interpreting "for-profit" specifically
The reason for-profits show up disproportionately in nonpayment and default data isn't incidental — it's the reason two separate accountability regimes exist specifically to police that sector's outcomes:
The 90/10 rule caps for-profit colleges' revenue from federal aid at 90%, precisely because this requirement was meant to be a proxy for measuring educational value at proprietary institutions — if colleges offer a good return on investment, students will be OK with at least partly footing the bill themselves. That's a structural admission: Congress built a market-based tripwire specifically for this sector because unaided demand is a weak signal here — students often aren't the ones paying, so price discipline breaks down.
The Gainful Employment framework has just been overhauled again. As of July 2026, ED created a new Studen…
Consumer Advocacy Advocate · grok-4-6
I'll pull the latest federal repayment numbers and consumer-facing sources so the advice is grounded, not generic.The recent reporting is concentrated enough that I want the original numbers and consumer-protection caveats, not just headlines.Consumer Advocacy Advocate
If you have never looked at these repayment numbers before, here is the only framing that matters: they are a warning label, not a report card. They do not tell you whether a school is “good.” They tell you whether people who borrowed to attend it have, in large numbers, been unable to keep up with the debt. For a person deciding whether to borrow, that is the more useful question.
What the new numbers actually are
The Department of Education now publishes an institutional nonpayment rate: the share of federal Direct Loan borrowers who first entered repayment between January 2020 and May 2025 and were more than 90 days behind as of the latest snapshot. It is a delinquency thermometer, not the official cohort default rate. Default is worse and slower — it usually takes more than 270 days of nonpayment — and pandemic-era pauses made the official default rates look artificially clean. Nonpayment is th…
Researcher · gpt-5.6-terra
Researcher fact-check
Claims that are supported
- The institutional nonpayment measure is real and is not the cohort default rate. Federal Student Aid defines it as the share of Direct Loan borrowers at an institution who entered repayment from January 2020 through May 2025 and were more than 90 days delinquent; the June 23, 2026 update reports results as of May 2026. FSA said about 2,000 institutions had rates of 25% or higher, roughly 200 more than in February.
Source: https://fsapartners.ed.gov/knowledge-center/library/electronic-announcements/2026-06-23/federal-student-aid-posts-updated-reports-fsa-data-center (fsapartners.ed.gov)
- The portfolio-wide default figure cited by the Economist and Advocate is accurate, but it is not attributable to for-profit colleges. As of March 31, 2026, FSA reported approximately 9 million borrowers in default, owing about $220 billion. That is a systemwide federal-loan figure, not an estimate of losses caused by a particular sector or institutio…
The Arbiter · gpt-5.6-sol
Round record
The participants converge on the central interpretation: federal repayment data are a warning signal about borrowing risk, not a stand-alone judgment of educational quality or proof that a school caused borrowers’ difficulties.
What the evidence establishes
- The newer institutional nonpayment rate covers Direct Loan borrowers who entered repayment from January 2020 through May 2025 and were more than 90 days delinquent as of May 2026. About 2,000 institutions had rates of at least 25%.
- This is not the official cohort default rate. It identifies serious delinquency earlier than default.
- Separately, approximately 9 million borrowers owing $220 billion were in default as of March 31, 2026. That is a systemwide outstanding balance, not a measurement of losses caused by for-profit schools or ultimately borne by taxpayers.
- The older Scorecard repayment measure—whether borrowers reduced their original principal—is useful but was last updated in 2018 and should not be confused with the new nonpayment series.
The Researcher did not verify several precise figures offered by the Consumer Advocacy Advocate, including sector ave…
The Arbiter's Final Verdict · gpt-5.6-sol
Verdict
The new federal repayment data are best treated as a financial smoke alarm. A high nonpayment rate does not prove that a college is fraudulent or that every student will fail. It does show that a substantial share of its former borrowers could not keep their federal loans current. For someone considering debt, that is a serious warning—particularly when a cheaper school offers the same credential.
What the number means
The new institutional measure looks at Direct Loan borrowers who entered repayment between January 2020 and May 2025 and asks how many were more than 90 days delinquent as of May 2026. About 2,000 institutions had rates of at least 25%.
In plain language, a 30% rate means roughly three in ten covered borrowers were seriously behind at that snapshot date. It does not mean:
- 30% of all graduates defaulted;
- 30% will never repay;
- the government lost 30% of the money lent;
- the school alone caused the problem.
Indeed, “graduates” is somewhat misleading: institutional borrower data may include people who attended but did not finish. That matters because noncompletion is itself a major source of repayment trouble.
The separate figure of a…