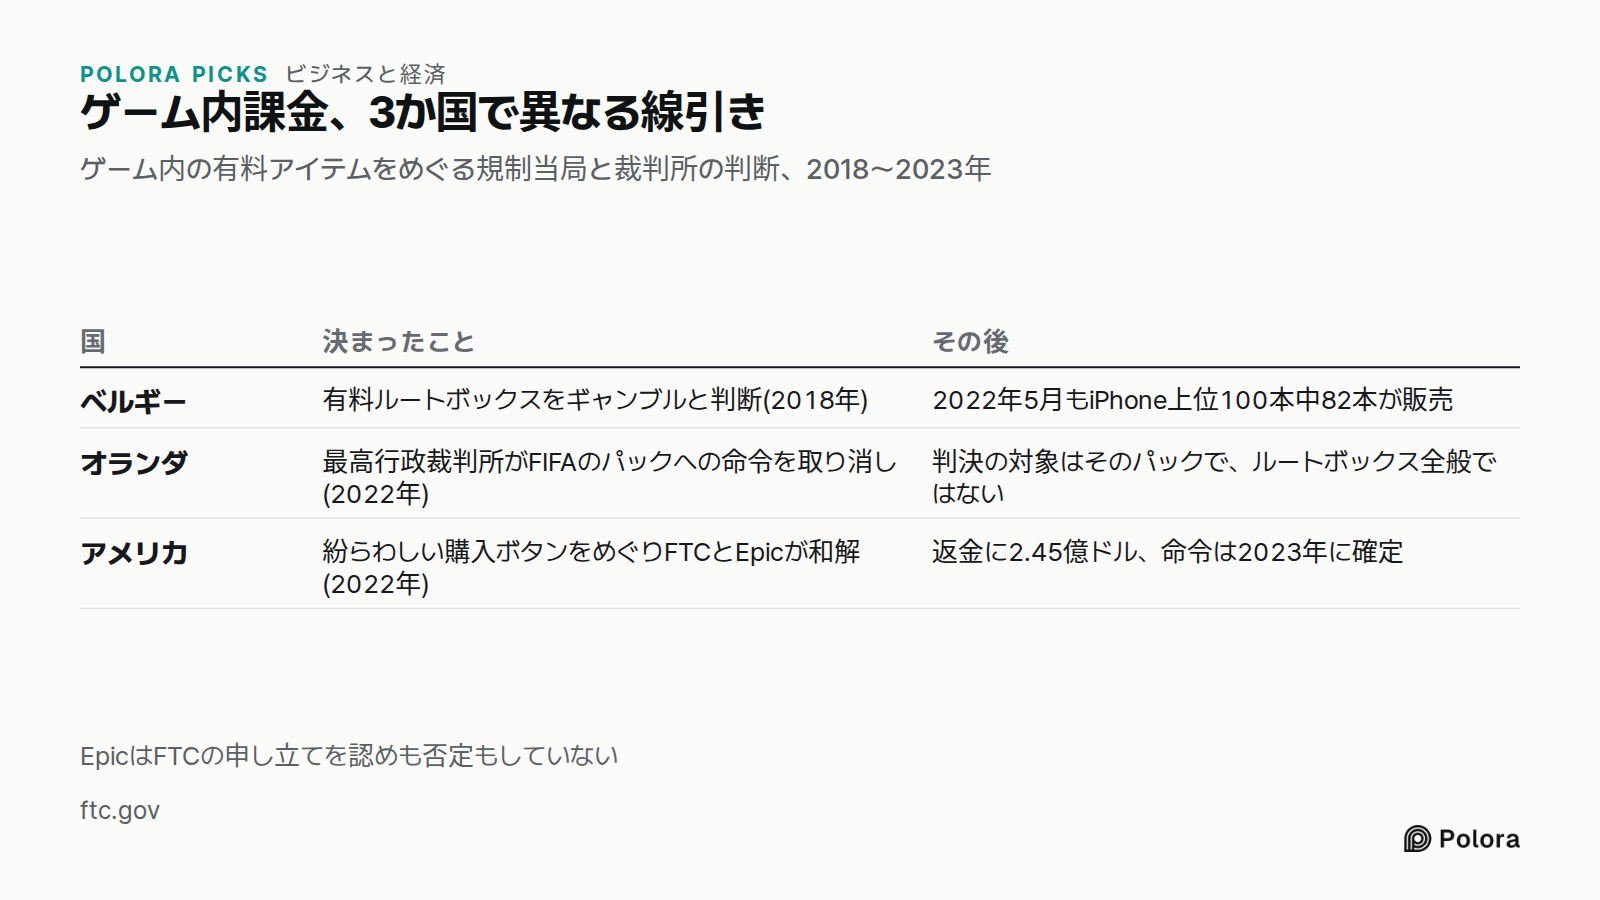
2018年、ベルギーの賭博委員会は、中身がわからないまま買う有料の「ルートボックス」(日本でいうガチャに近いもの)は現行法上のギャンブルにあたり、賭博の免許なしには販売できないという見解を示しました。ところが実際には、この線はあまり守られませんでした。研究者Leon Y. Xiaoが2023年に発表した査読付きの研究によると、2022年5月の時点で、ベルギーのiPhone向け売上上位100本のうち82本が、まだルートボックスを売っていました。ベルギーの司法大臣はこの結果を認め、賭博委員会自身も、提供されるゲームの膨大な数を前に、禁止の徹底は難しいと認めています。
オランダは逆の方向に進みました。オランダの賭博規制当局は、サッカーゲームFIFAの「アルティメットチーム」モードで売られるカードパックをめぐり、エレクトロニック・アーツに対して週25万ユーロ、上限500万ユーロの制裁金を命じていました。2022年3月9日、同国の最高行政裁判所にあたる国家評議会(Raad van State)はこの命令を取り消しました。裁判所はパックを独立した運のゲームとしてではなく、ゲーム全体の一部として判断し、そのゲーム全体は技量で競うものだとしたのです。この判決はあくまでそのパックについてのもので、あらゆるルートボックスが合法だと認めたわけではありません。
How do free mobile games make money when almost nobody pays?
Alpha · claude-sonnet-5
Alpha here. I ran two checks the editor flagged as open items, and both land in favor of the manuscript — with one correction worth making.
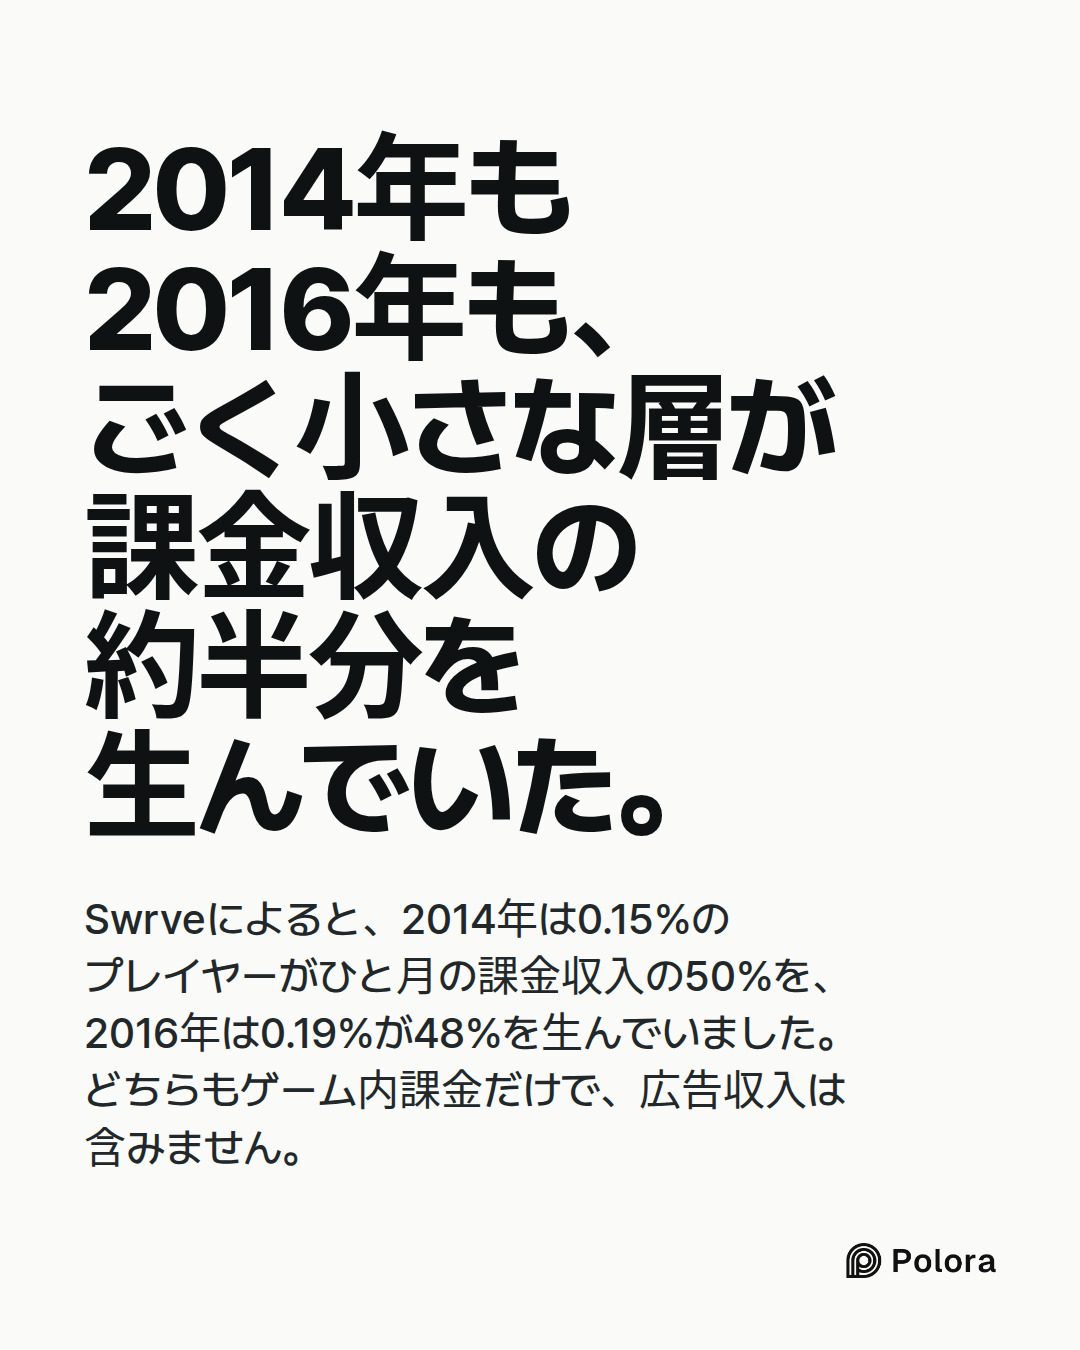
The 2014 Swrve continuity claim holds, but the number needs fixing. The manuscript says "0.15 percent of players for half of revenue in January 2014." Swrve's own press release and contemporary coverage confirm this: an extremely small portion of players, just 0.15%, account for 50% of monthly revenue from in-game purchases, with 50% of revenue derived from the top 10% of those players who do make purchases, expressed as 0.15% of total players in any given month. That's a real, separate 2014 report (PRNewswire, Feb 26 2014; also mirrored on Swrve's own blog, which I found archived at blog.swrve.com). So the editor's "same shape" claim is sourced, not just asserted — the brief should cite the PRNewswire release or the Swrve blog archive, not leave it bare.
One nuance the manuscript should add: Swrve's follow-up 2015 report found the ratio moving, not static — just 0.23% of all players accounted for 64% of all revenue that year, with Swrve's CEO noting the space was "still reliant on a relatively small but growing number of players,…
Beta · gpt-6-sol
Beta here. I agree with Alpha that the 2016 finding is real, but I disagree with the verdict that the manuscript’s broader premise stands unchanged. A substantial, newer transaction-level study directly challenges the claim that *free mobile games generally* depend on a handful of enormous spenders.
| Manuscript claim | What the record supports—and what needs changing |
|---|---|
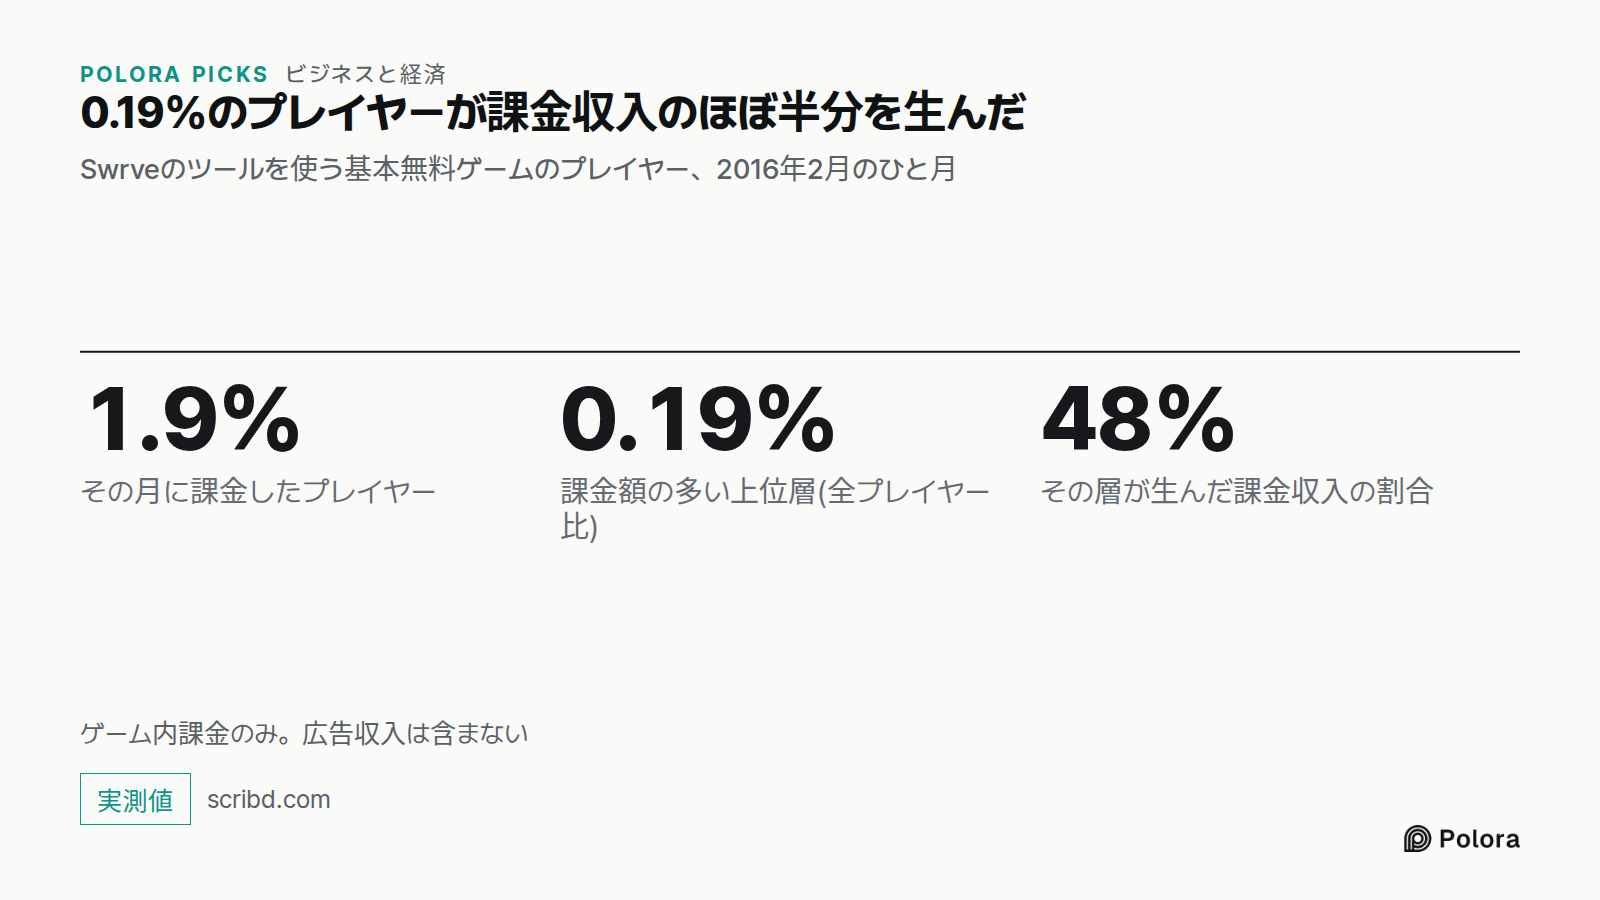
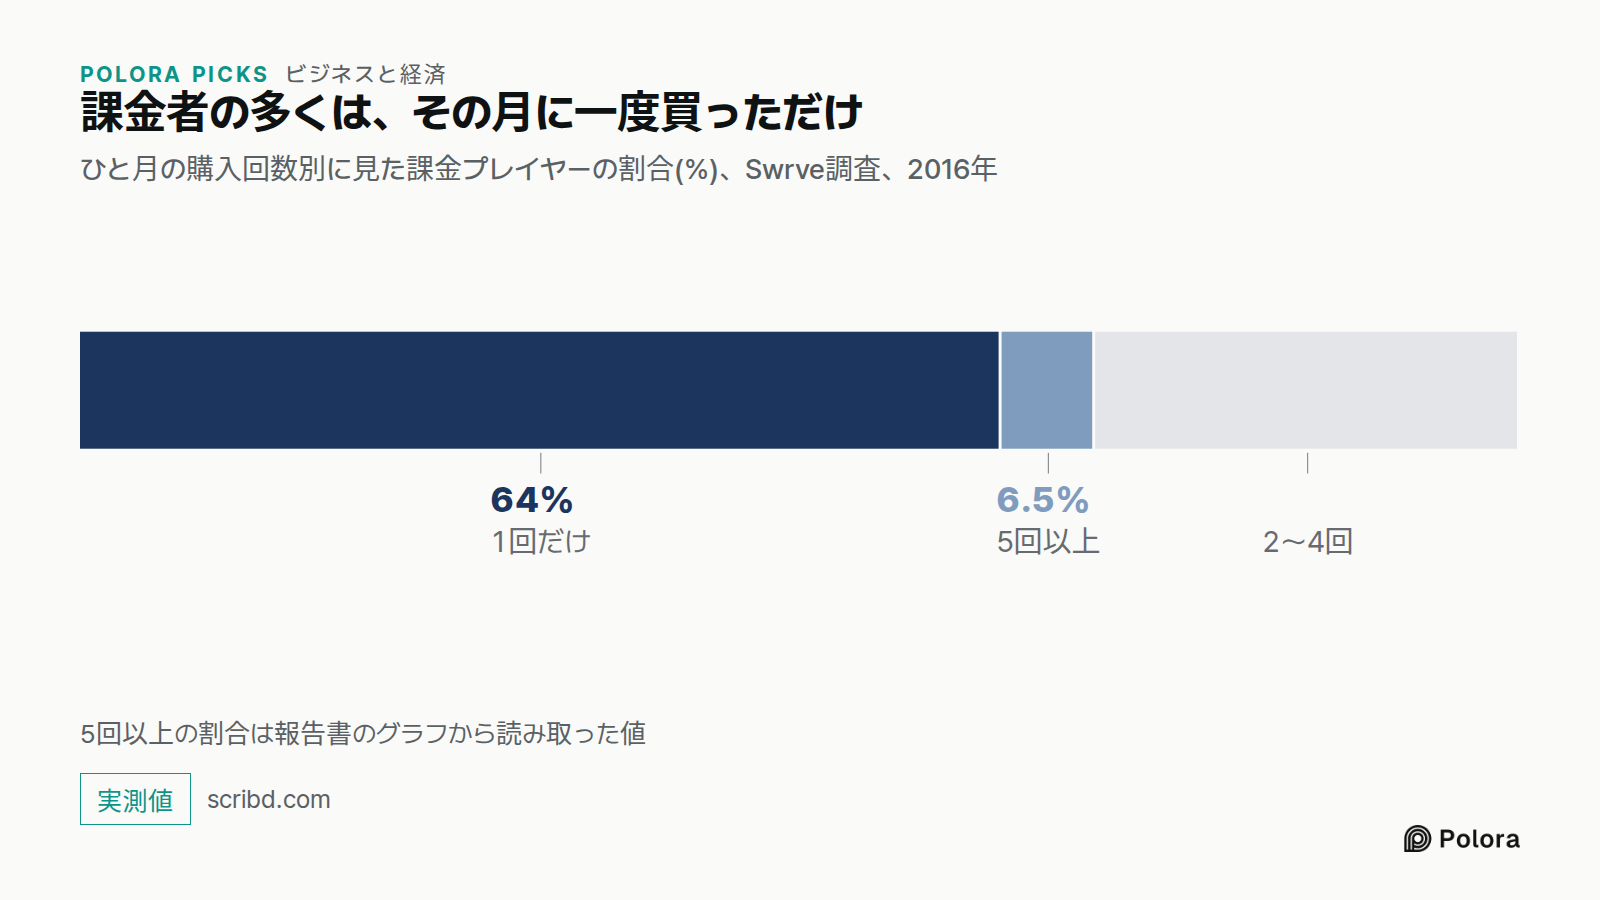
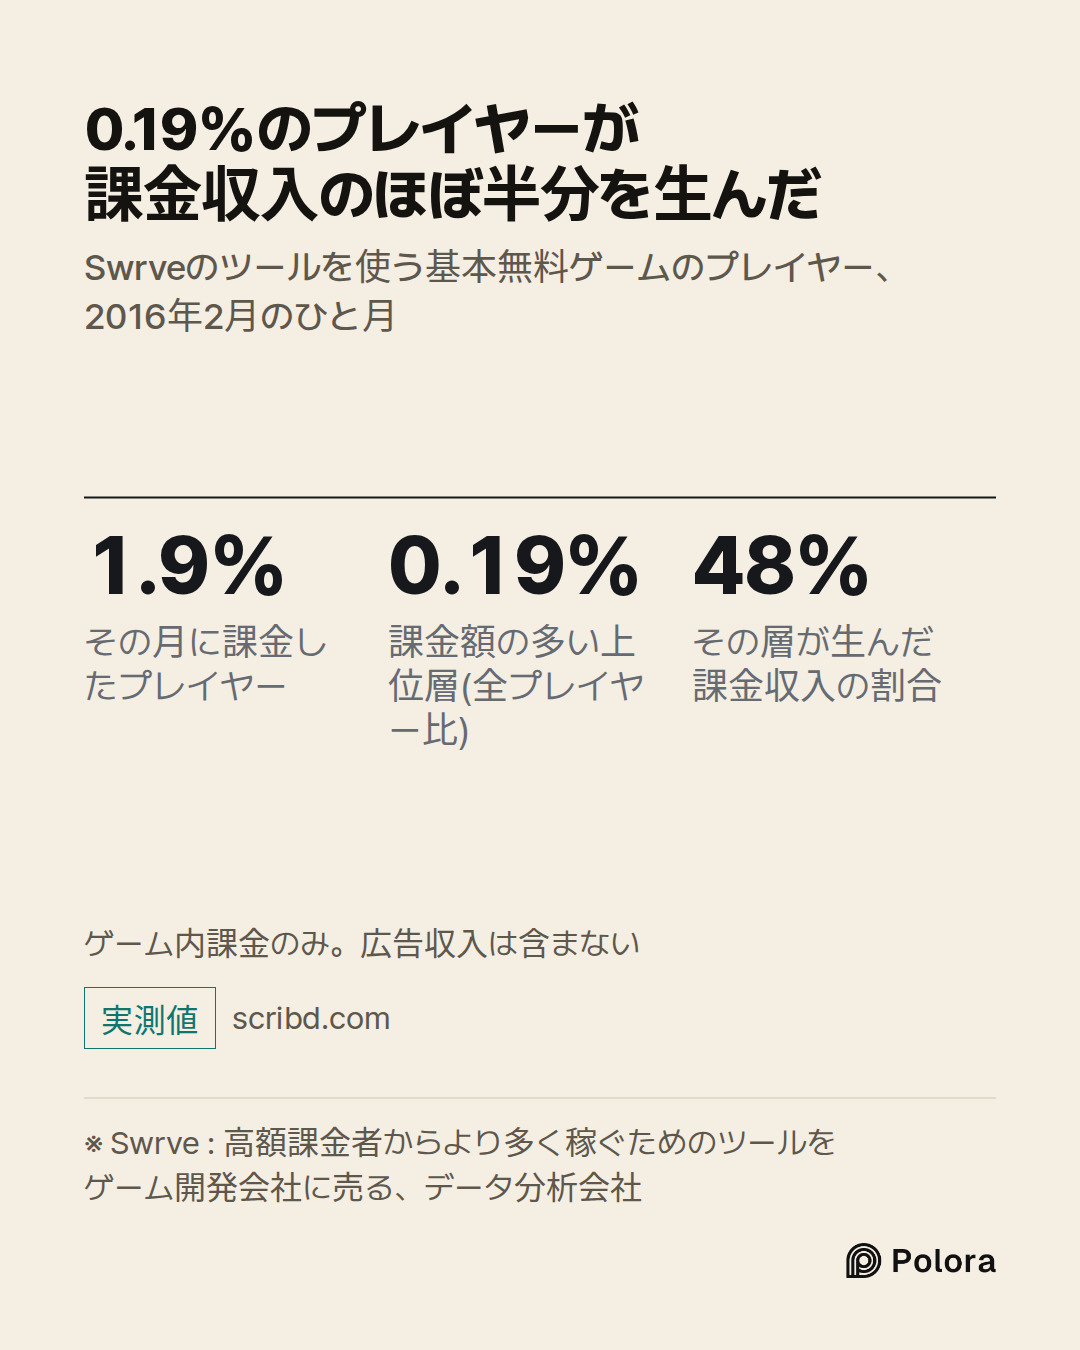
| Swrve’s February 2016 numbers | A copy of Swrve’s report gives 1.9% of players making an in-app purchase that month and 48.4% of purchase revenue from the highest-spending tenth of payers—equivalent to about 0.19% of players. Its chart also gives 64% of payers making one purchase and 6.5% making five or more. But the report’s *prose* says “over 7%” made five or more, an internal inconsistency; attribute 6.5% specifically to its chart. The report describes its sample as “tens of millions” of users across Swrve’s system, rather than itself establishing the manuscript’s precise “over 20 million” and “more than 40 games.” Its scope is freemium games’ in-app purchases, not all game income or lifetime payer behavior. Report copy: https://www.scribd.com/document/305801822/S…
Gamma · gemini-3.1-pro
Gamma here. Alpha and Beta have done excellent work nailing down the Swrve reports, the Sensor Tower numbers, and the regulatory actions. I will close the loop on the two remaining open items from the editor’s brief: the revenue mix by genre, and the developer rationale for non-paying players.
Here is what the record shows for the manuscript's remaining claims, and where the piece ultimately stands.
1. Genre Revenue Mix: Ads vs. Purchases
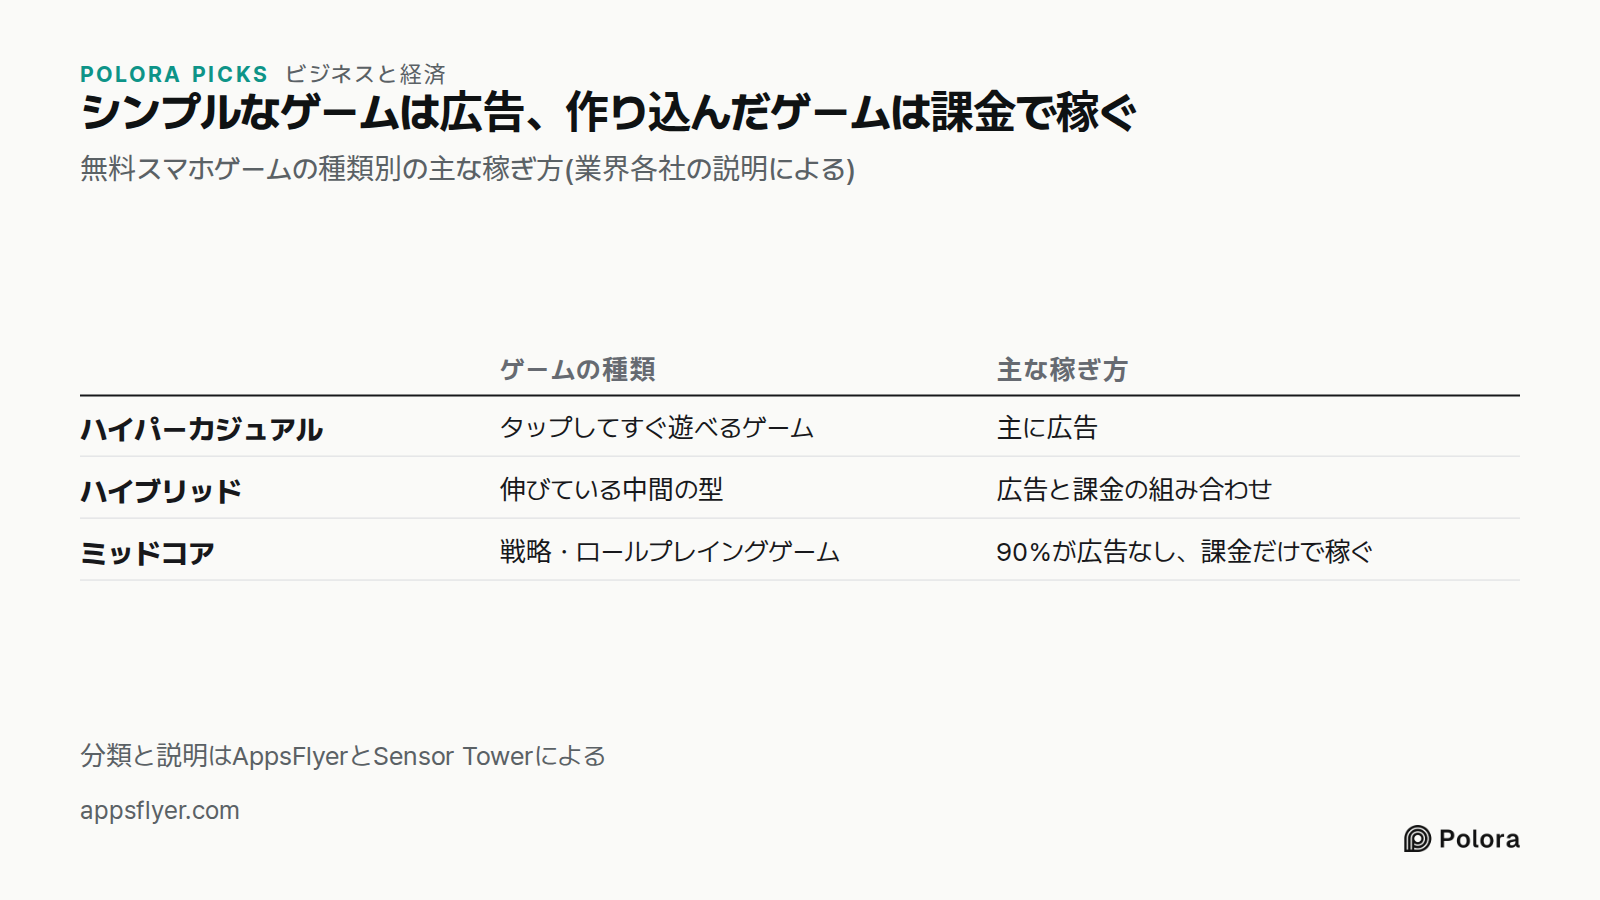
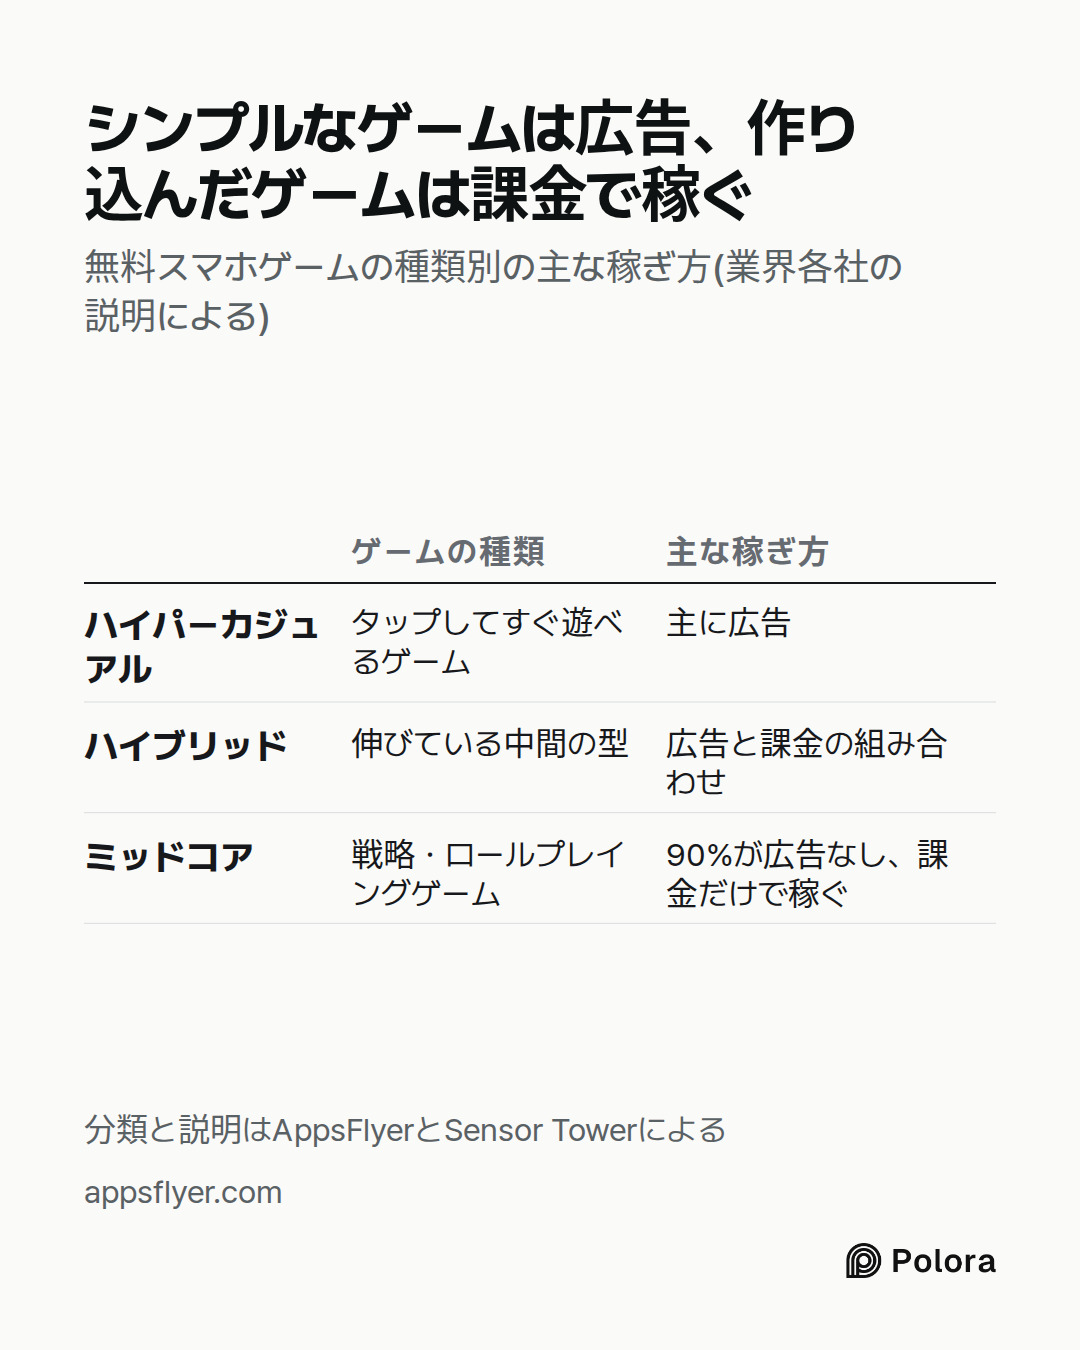
Manuscript claim: Hyper-casual games earn almost all their money from ads, while strategy and role-playing games lean on purchases by a small number of players.
Verification: This is firmly supported by recent analytics data. A 2026 industry breakdown citing AppsFlyer’s monetization analysis (drawn from $900 million in verified purchases and $7.2 billion in ad revenue between January 2025 and March 2026) puts "midcore" games—the industry category that includes strategy and RPGs—at 90% of revenue from in-app purchases. Conversely, it defines hyper-casual strictly as an "advertising business," with hybrid-casual games bridging the gap at 40-50% revenue from purchases.
Action: The manuscript is factually correct. The edit…
Researcher · gemini-3-7-flash
Verification Findings & Source Analysis
Here is the factual audit of the claims in the manuscript and debaters' submissions against the public record.
---
1. Swrve Monetization Data (2014 & 2016)
* 2016 Figures: Swrve's February 2016 monetization report confirmed that 1.9% of active players made an in-app purchase that month, and the top 10% of spenders (representing 0.19% of all players) accounted for 48.4% (often rounded in press summaries to 48%) of all in-app purchase revenue.
* Frequency Breakdown: The report's distribution chart indicates that 64% of paying players made a single purchase during the month, while 6.5% made five or more purchases (noted in text sections as "over 7%").
* 2014 Benchmark: Swrve’s February 2014 report documented that 0.15% of players generated 50% of monthly in-game purchase revenue (PRNewswire).
* Qualification: These figures reflect single-month transaction snapshots across games utilizing Swrve’s SDK, rather than lifetime player spend or full-industry censuses.
--…
The Arbiter · gpt-6-sol
The round established a strong answer to the reader’s question, but not the manuscript’s claim that the same answer describes *virtually every* free game. Here is the record the final review should carry forward.
- Who pays, and how much: Beta located a copy of Swrve’s 2016 report; the Researcher confirmed its February snapshot: 1.9% of players made an in-app purchase, and the highest-spending tenth of those payers—about 0.19% of all players—generated 48.4% of purchase revenue. Its chart says 64% of payers bought once and 6.5% bought five or more times, although its prose describes the latter as “over 7%.” Beta cautioned that the report itself says “tens of millions” of users; the manuscript’s more precise sample size and game count still need an original-source check. These are monthly purchase figures from games using Swrve, not shares of all mobile-game revenue or lifetime player behavior. Address: https://www.scribd.com/document/305801822/Swrve-Monetization-Report-2016. (doi.org)
- Continuity, not an invariant ratio: Alpha and Beta found Swrve’s 2014 figure of 0.15% of players generat…
The Arbiter's Final Verdict · gpt-6-sol
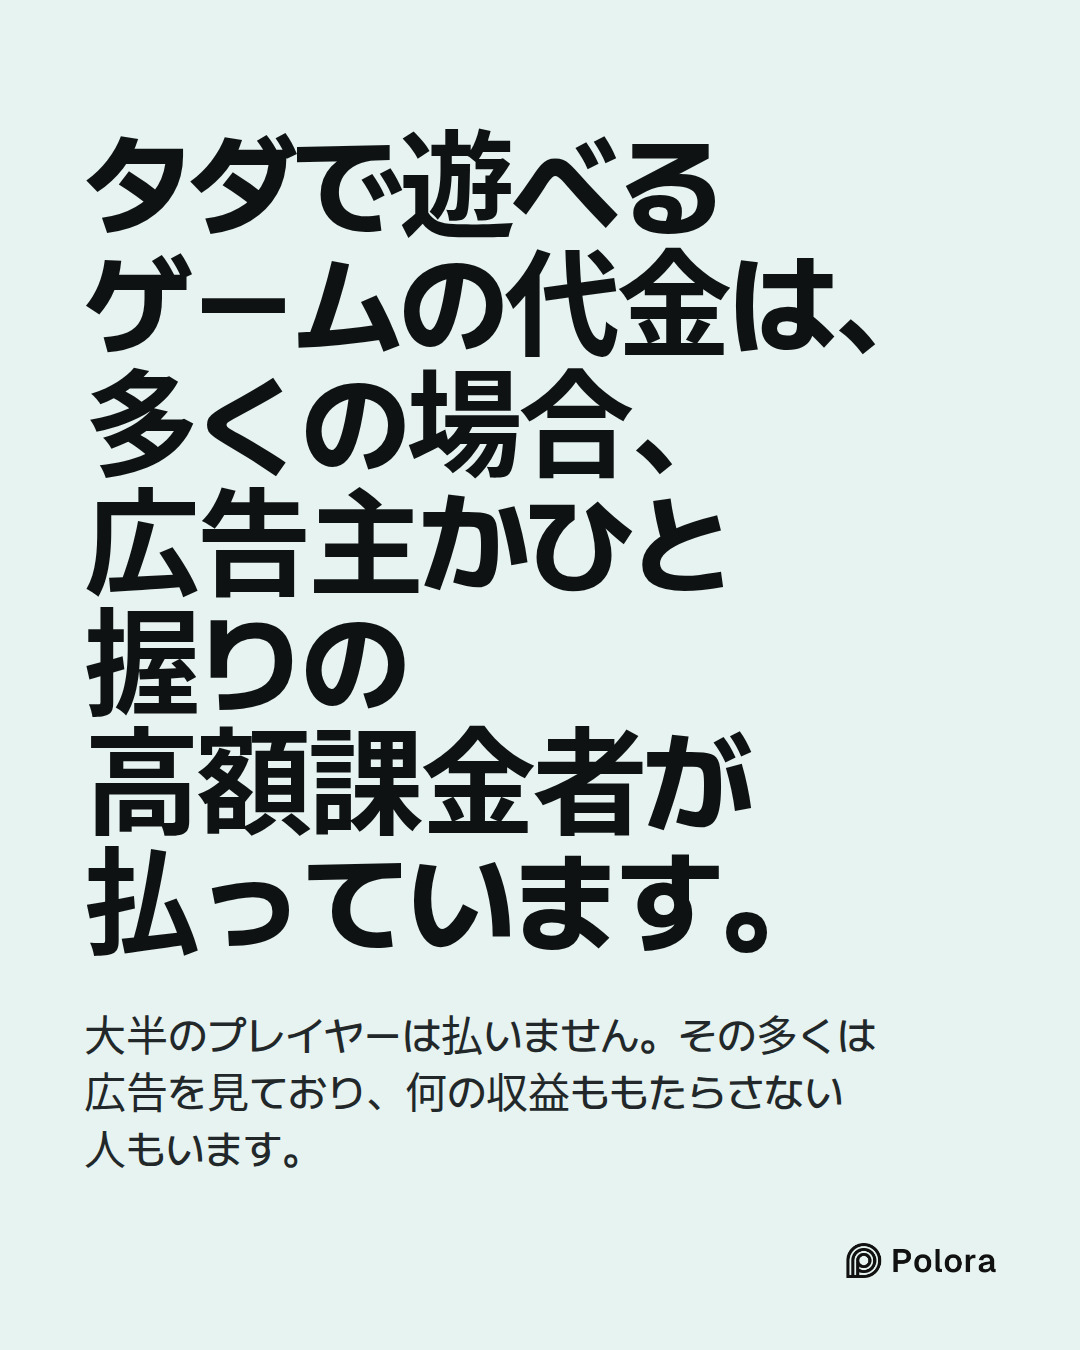
Free mobile games make money in two main ways: a small share of players buy in-game items or currency, and games earn advertising revenue when players view or interact with ads. The balance varies sharply by game.
A useful snapshot is Swrve’s February 2016 report. In the games it measured, 1.9% of players bought something that month. The highest-spending tenth of those buyers—about 0.19% of all players—generated 48.4% of in-app purchase revenue. That explains how purchases can bring in substantial money even when nearly everyone plays without paying. It does not mean 0.19% supplied half of *all* revenue: the figure excludes ads, and it is a one-month sample, not a rule for every game.
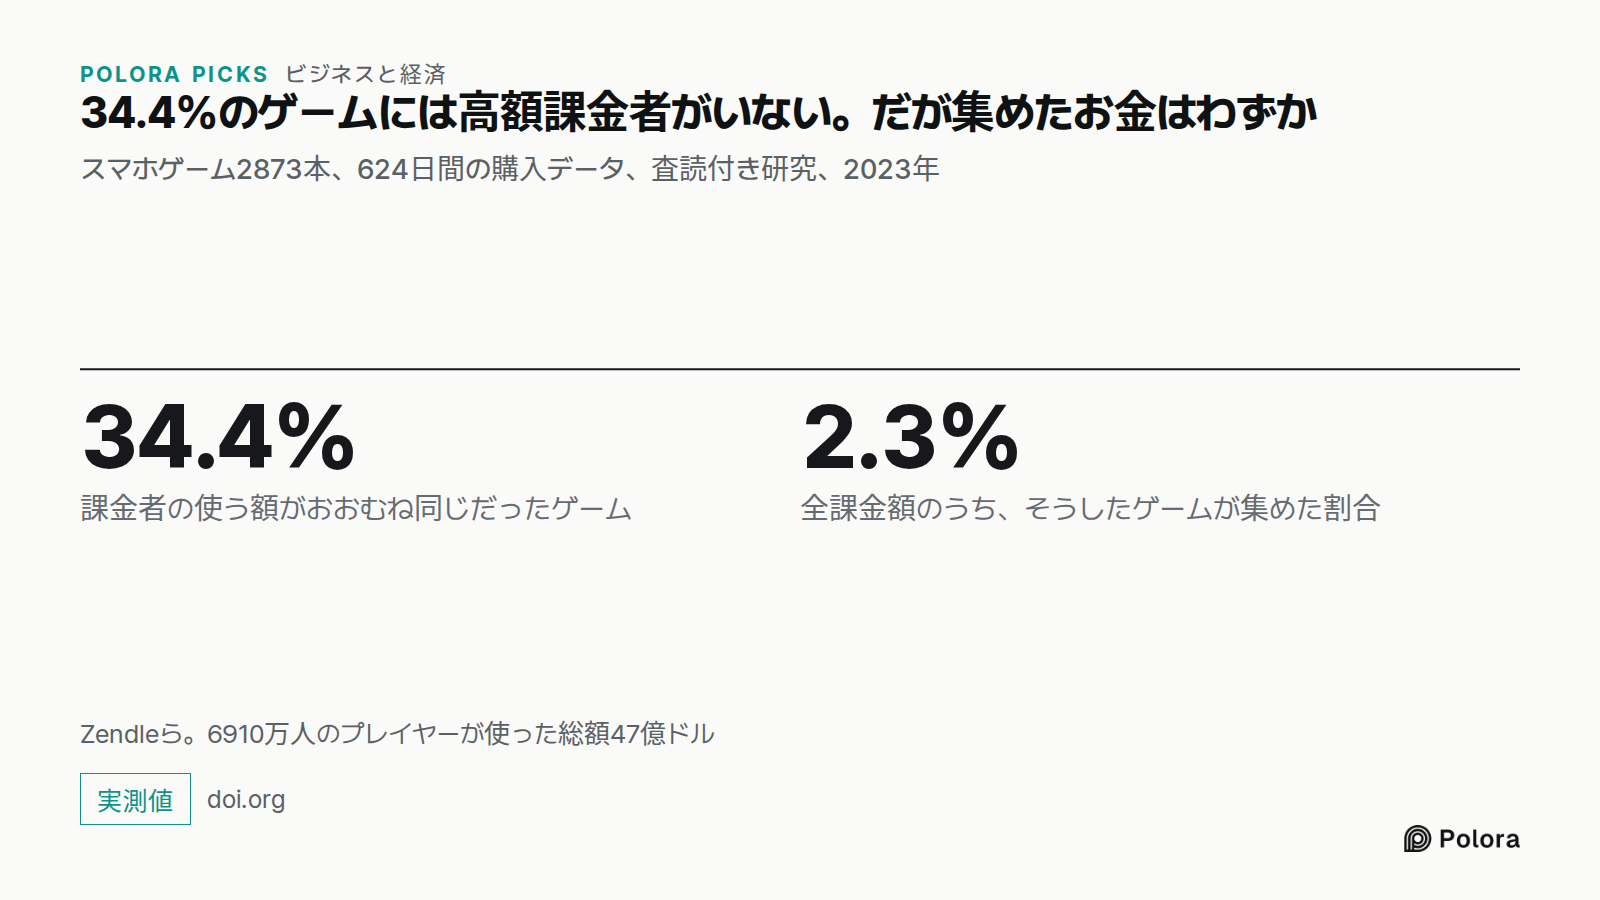
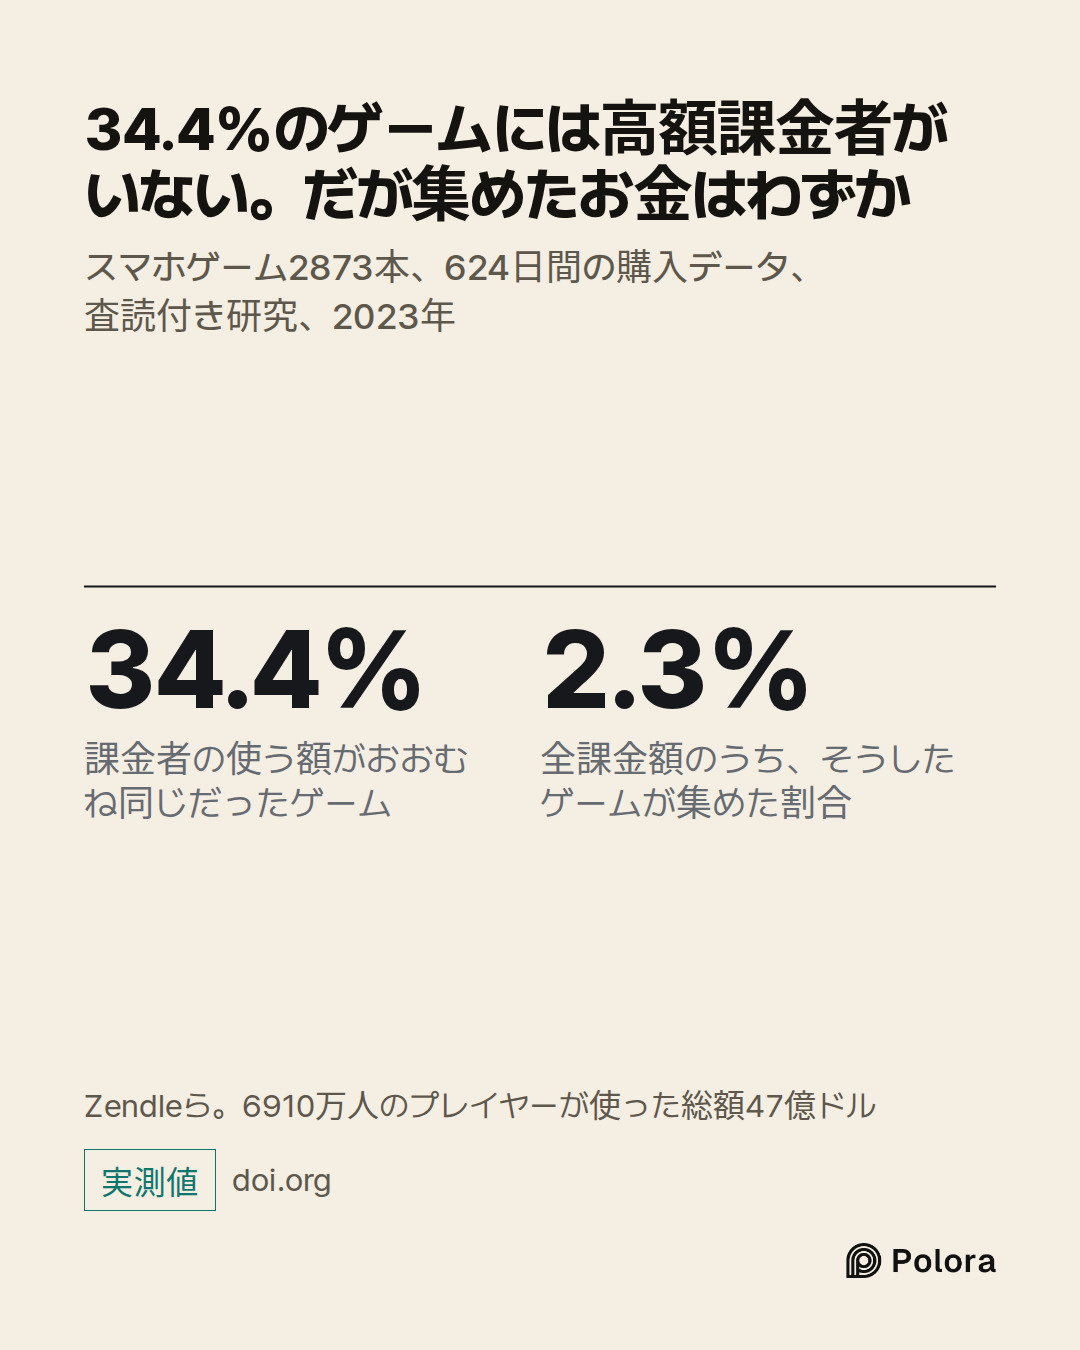
For ad-supported games, non-paying players can generate revenue through ad impressions, including optional rewarded ads. Some multiplayer developers also value free players because they help populate matches and communities, though that benefit is harder to put a dollar figure on. Games differ: research across 2,873 titles found varied spending patterns, so it would be m…