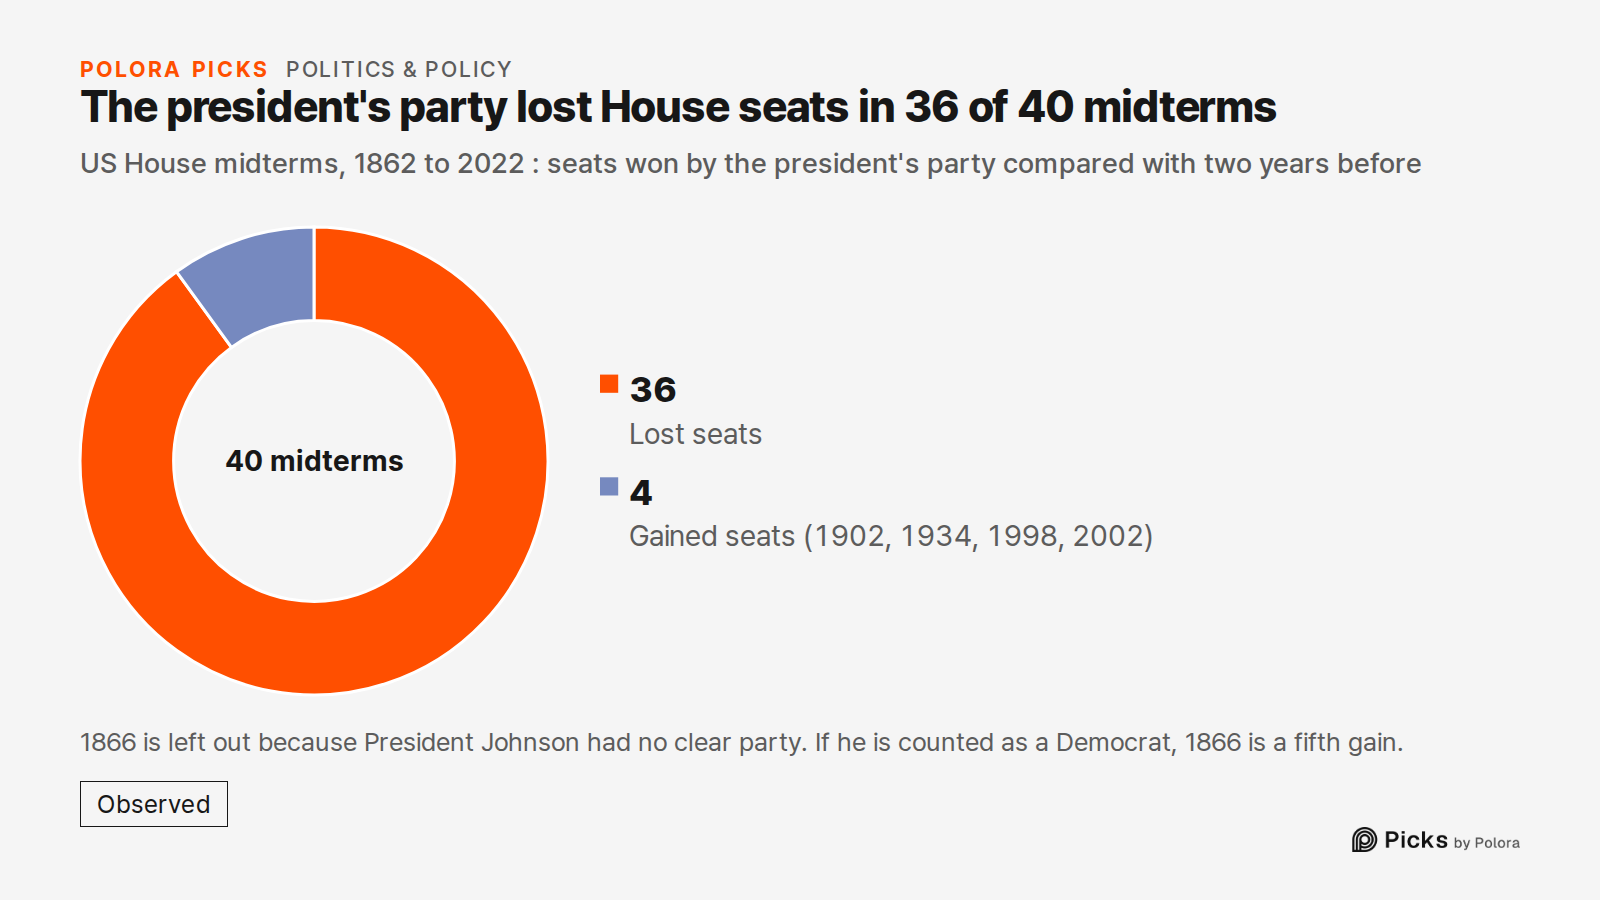
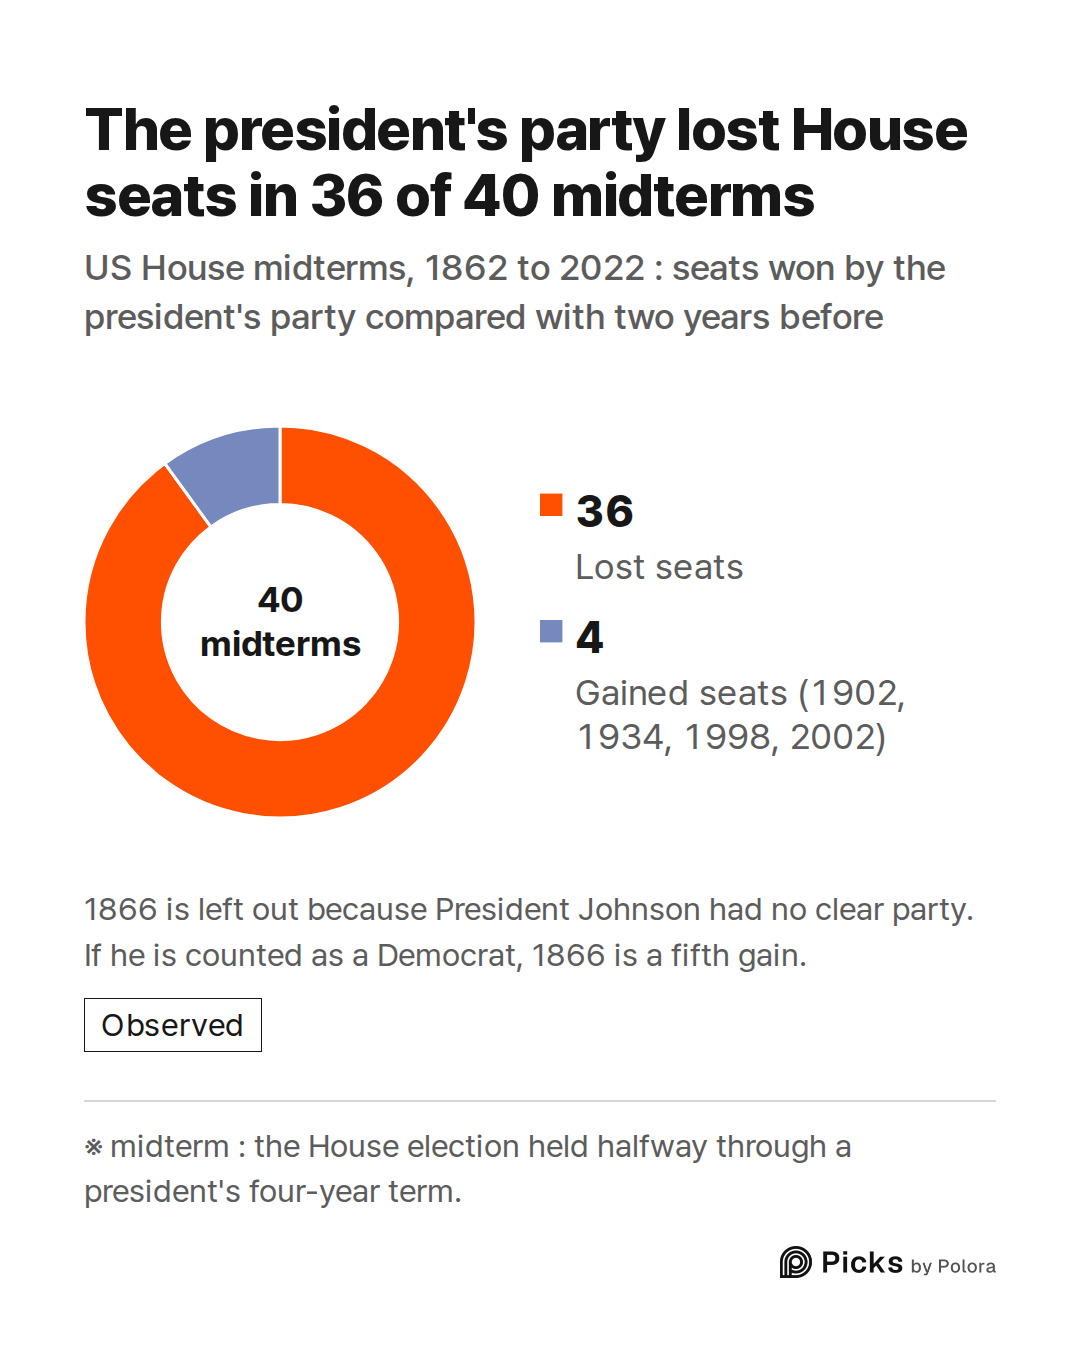
36 losses in 40 midterms
A midterm is the House election held halfway through a president's four-year term. For each one since 1862 we took the seats the president's party won and subtracted the seats it had won two years earlier, at the presidential election. The counts come from the US House historian, which publishes the number of seats each party won on election day for every Congress.
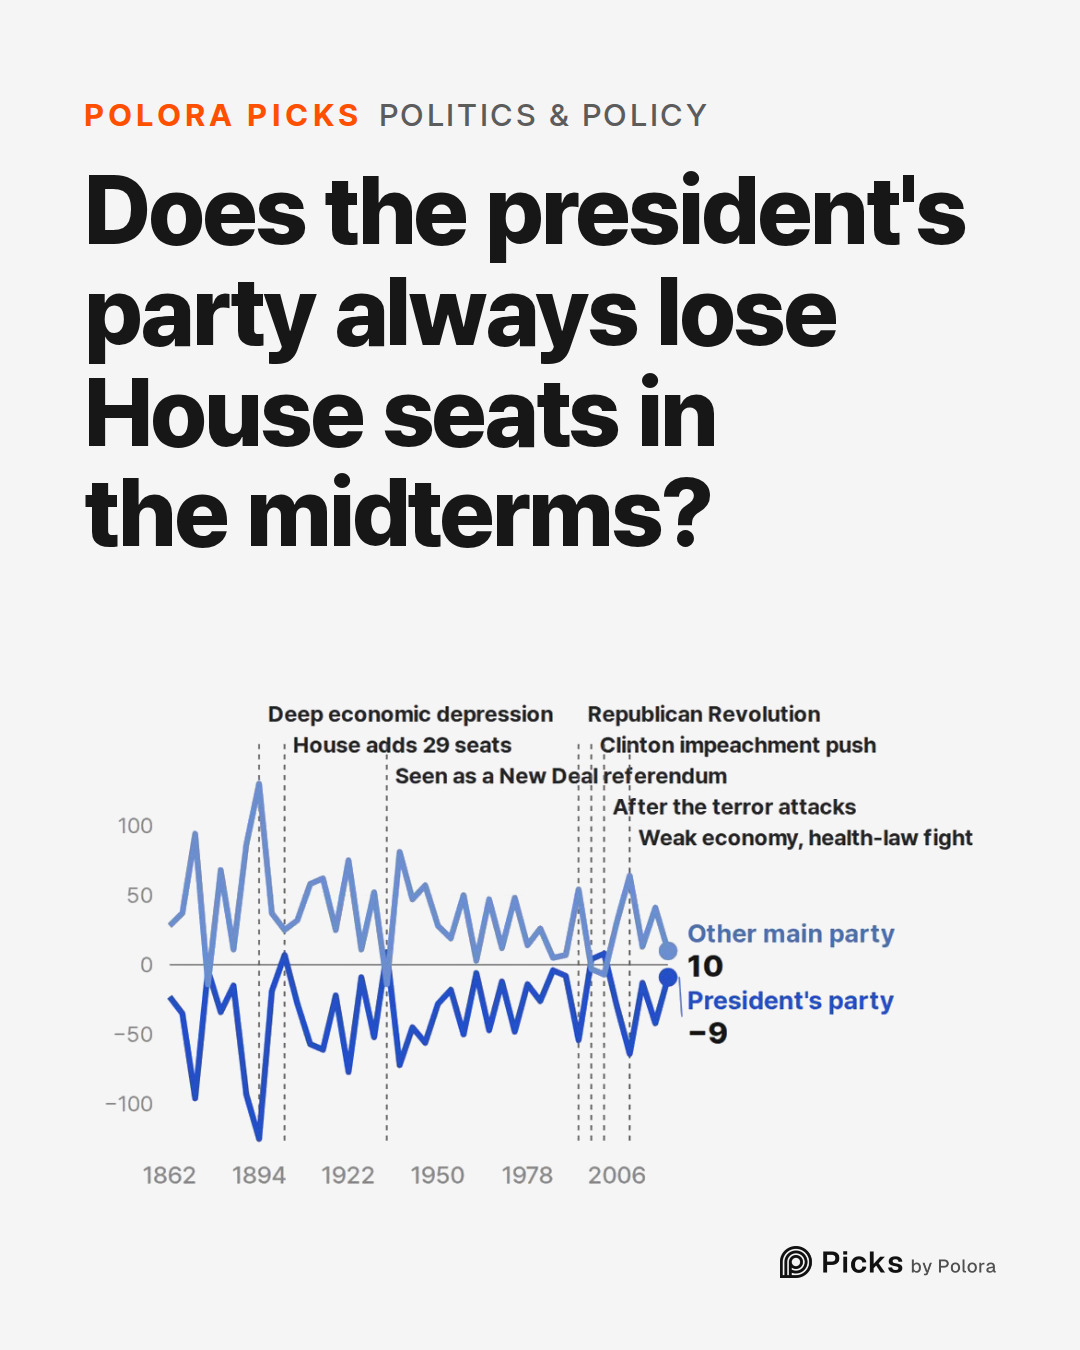
In 36 of those 40 midterms the change was a loss. The president's party gained seats only four times : 1902, 1934, 1998 and 2002. Our count leaves out 1866. President Andrew Johnson had come to office on the wartime "National Union" ticket, and by 1866 that coalition had split over Reconstruction, so we did not assign him a party. Wikipedia's table lists him as a Democrat; counted that way, 1866 would be a fifth gain.
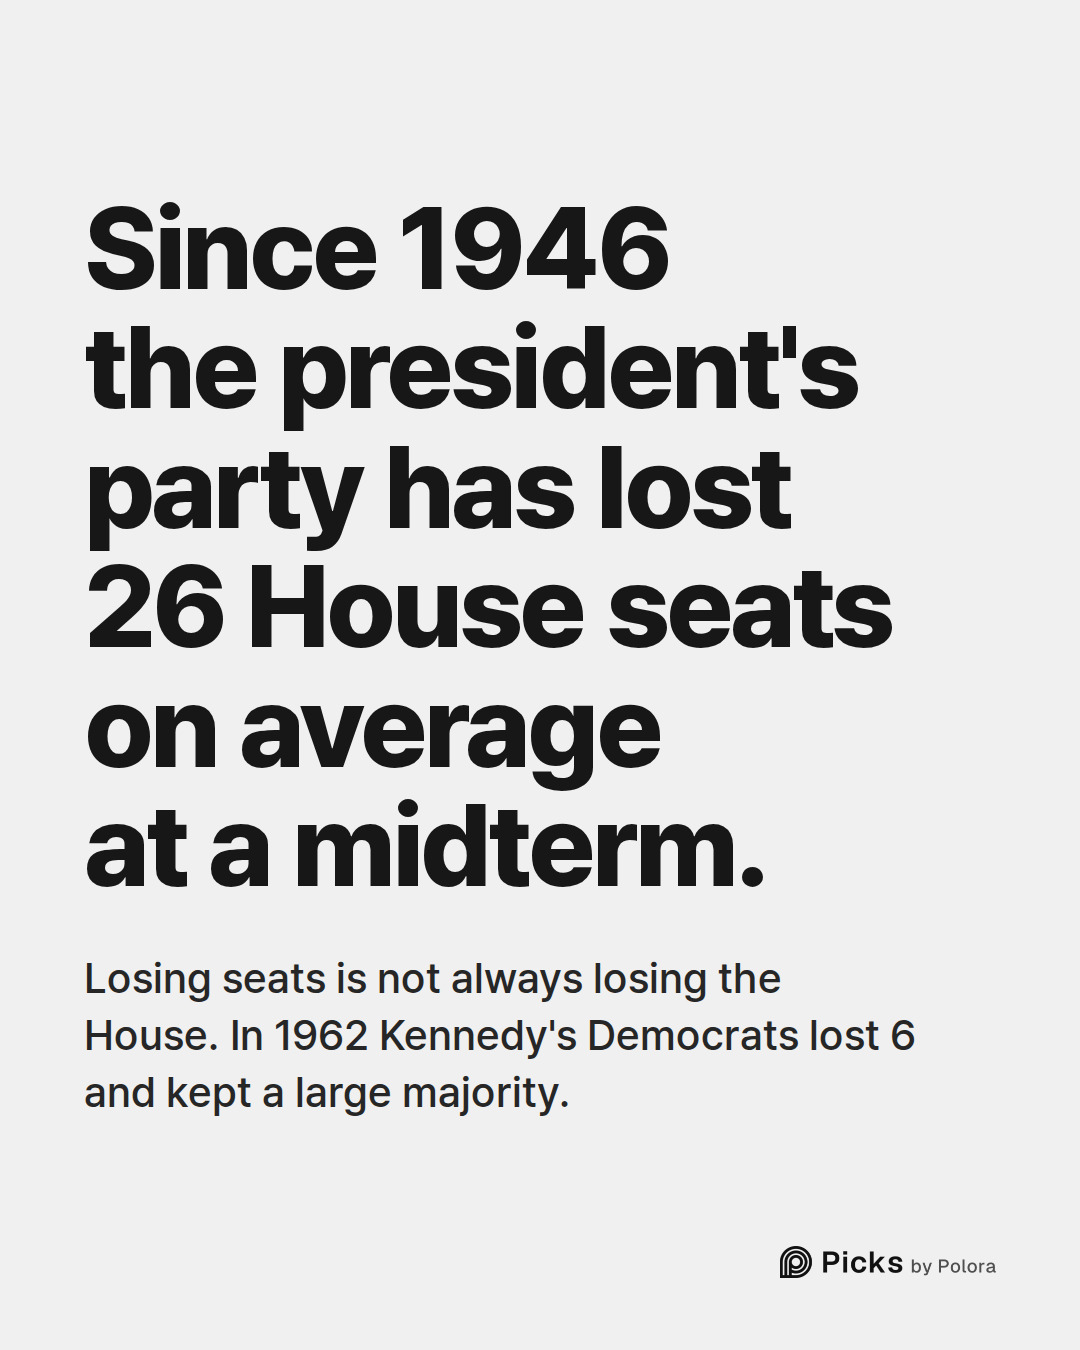
Losing seats is not the same as losing the House. In 1962, for example, President Kennedy's Democrats lost 6 seats and kept a large majority. What is close to a rule is the direction : down.
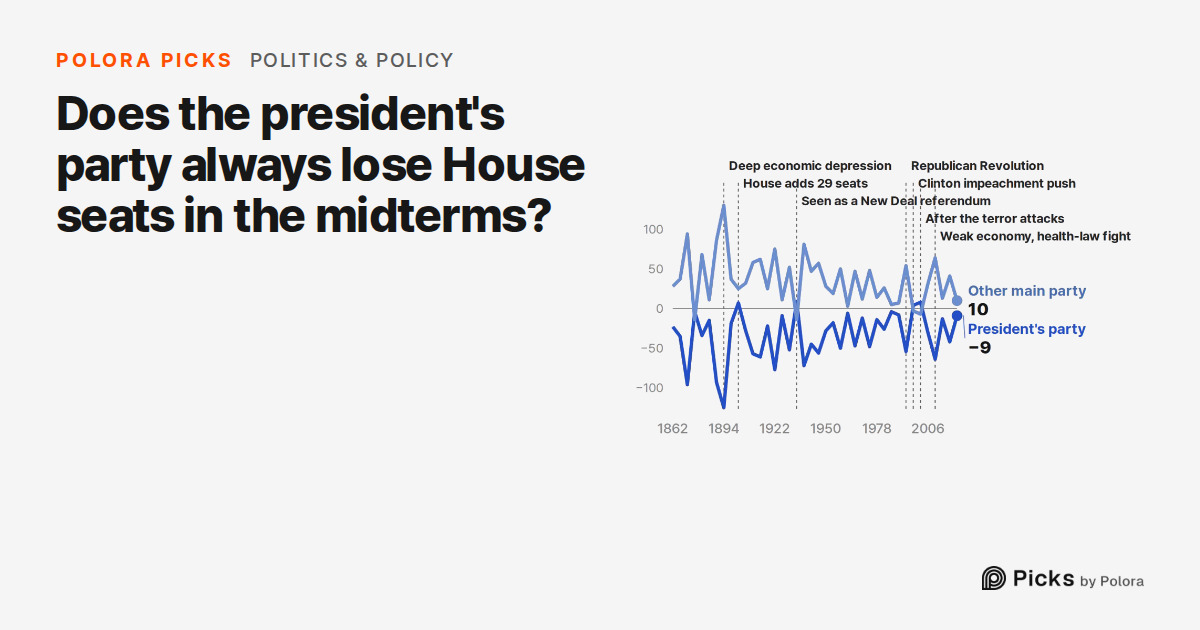
The other main party is usually the one that gains. In all but four of the 40 midterms the party out of the White House gained seats, usually about as many as the president's party lost. The two lists don't match exactly. In 1878 both main parties lost seats while smaller parties gained, and in 1902 both main parties gained.
The deepest losses came early
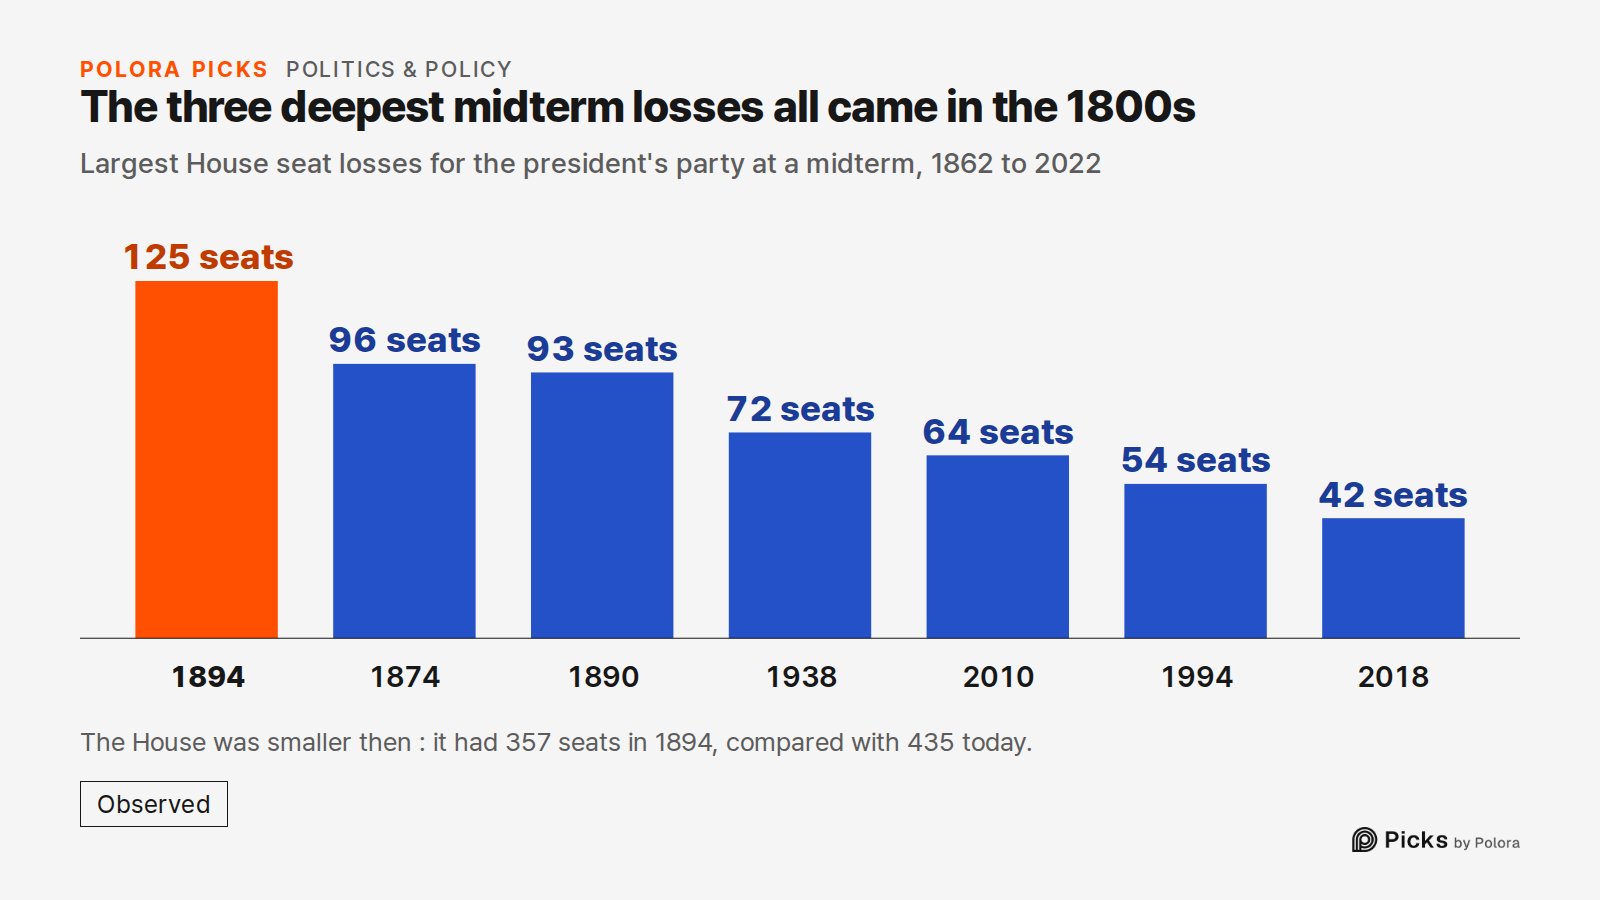
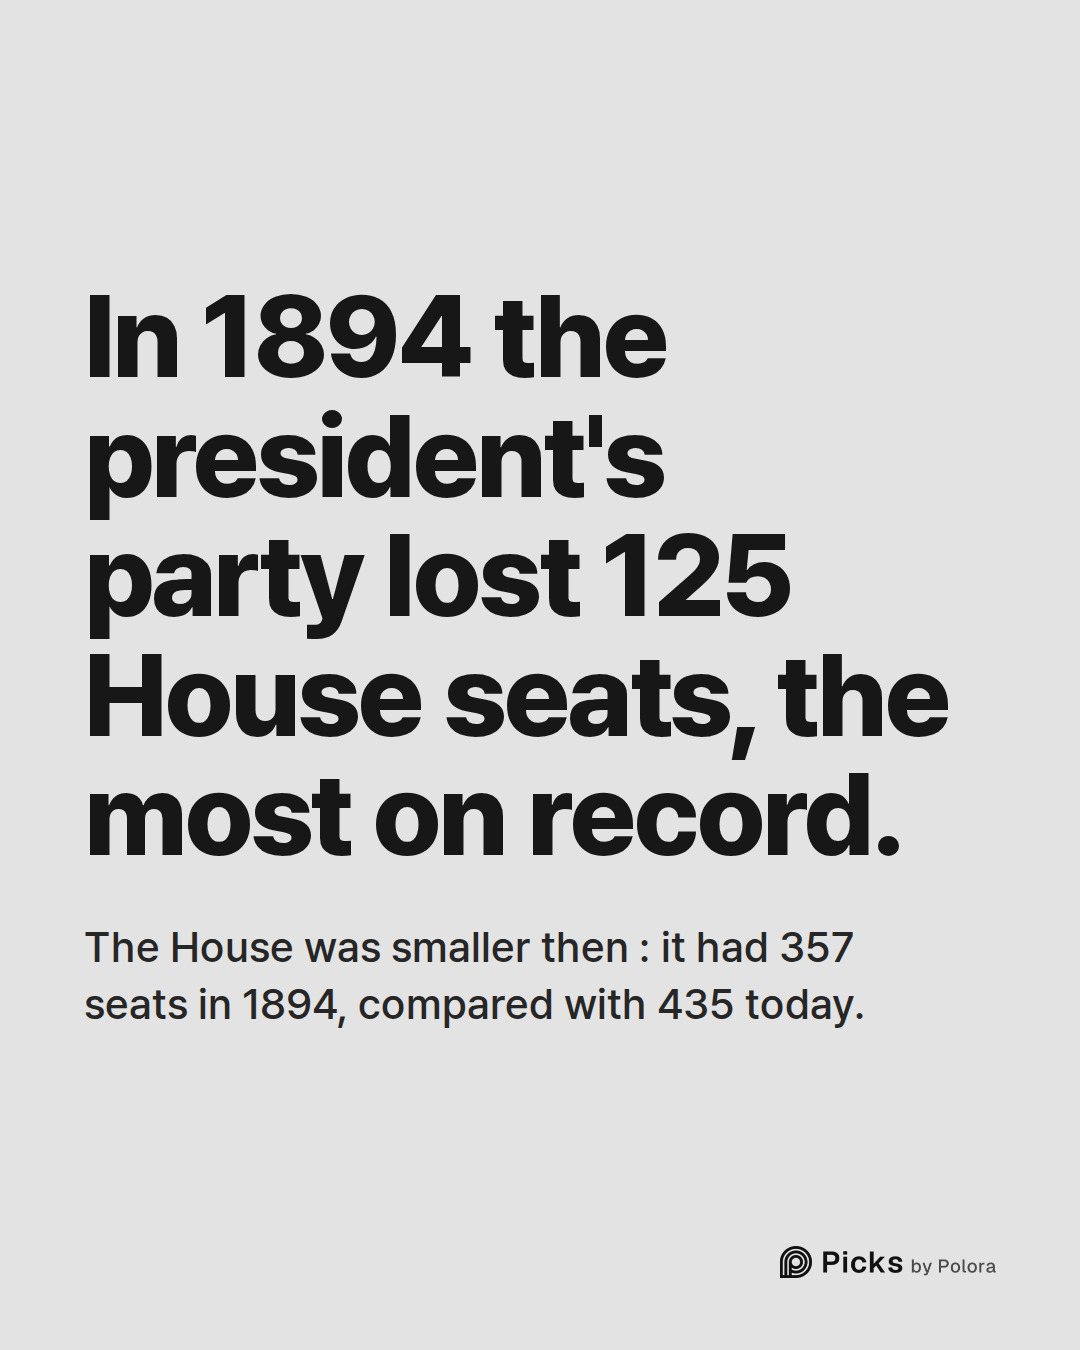
The biggest loss on the record is 1894. President Grover Cleveland's Democrats lost 125 seats, and the Republicans gained 130. It came during what Wikipedia's account of that election calls the nation's deepest economic depression yet, after the financial crisis of 1893. Other huge losses also came in the 1800s : 96 seats in 1874 and 93 in 1890.
Those numbers need one caution. The House was smaller then : it had 357 seats in 1894, compared with 435 today. A 125-seat loss was a larger share of a smaller chamber.
From 1938 on, the losses stayed just as regular. The president's party lost seats in 20 of the 22 midterms from 1938 to 2022, including 15 in a row from 1938 to 1994, under Democratic and Republican presidents alike. Since the Second World War (from 1946) its average change has been a loss of 26 seats. Wikipedia's article on midterm elections arrives at the same 26.
The largest loss after 1938 was 2010, when President Obama's Democrats lost 64 seats. Others stand out too : 72 in 1938, 54 in 1994, when Republicans won the House for the first time since 1952, and 42 in 2018 under President Trump's first term.
The four times the president's party gained
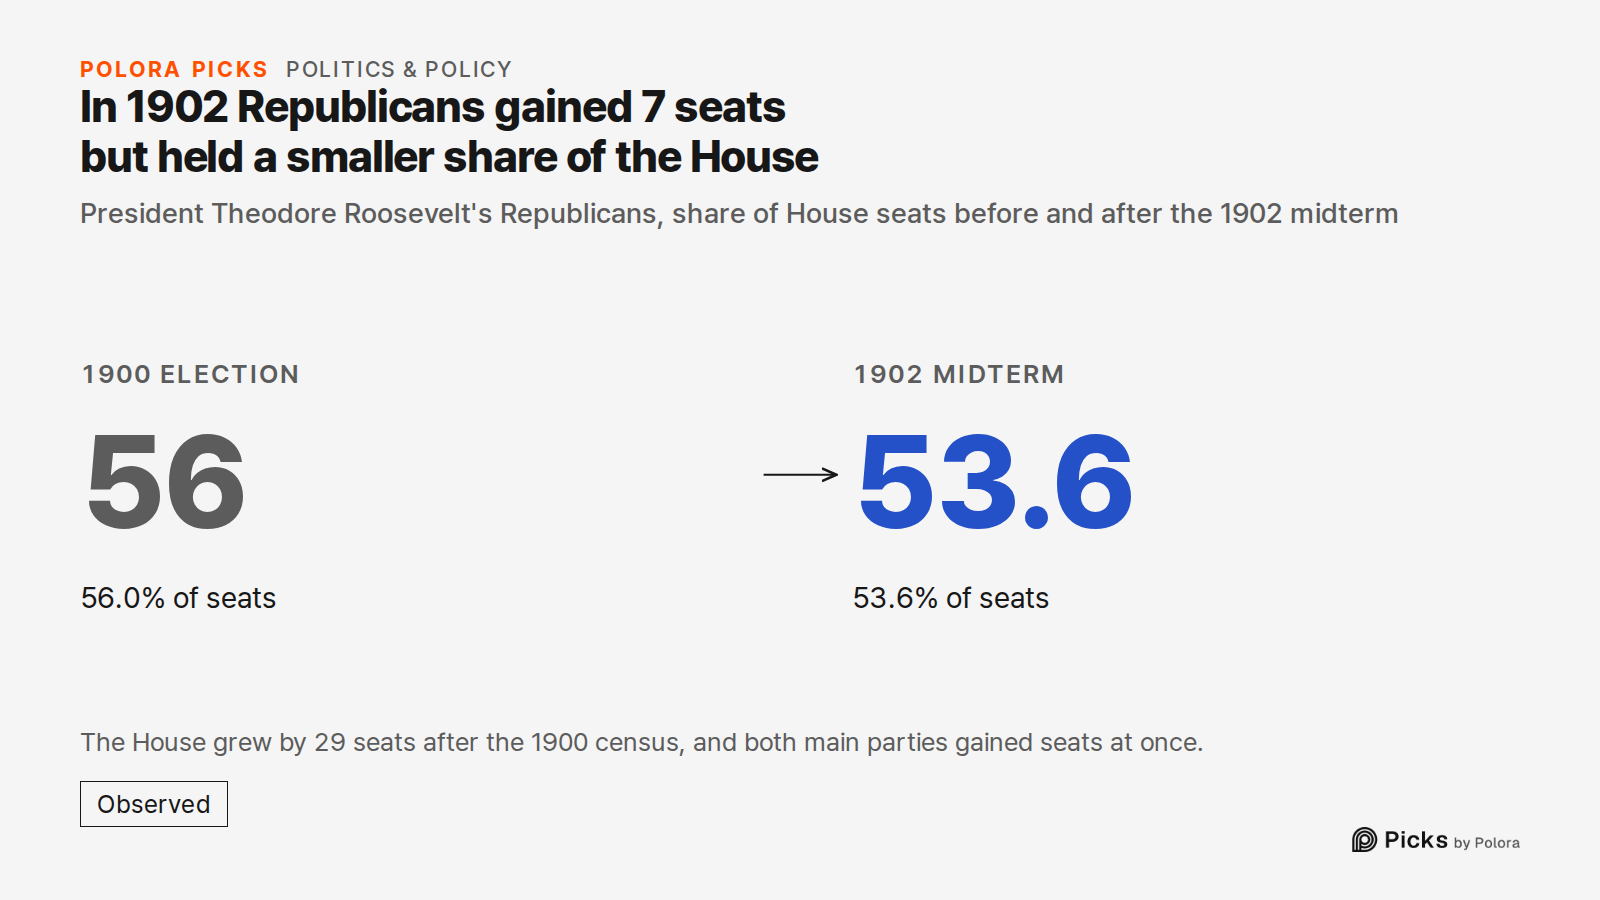
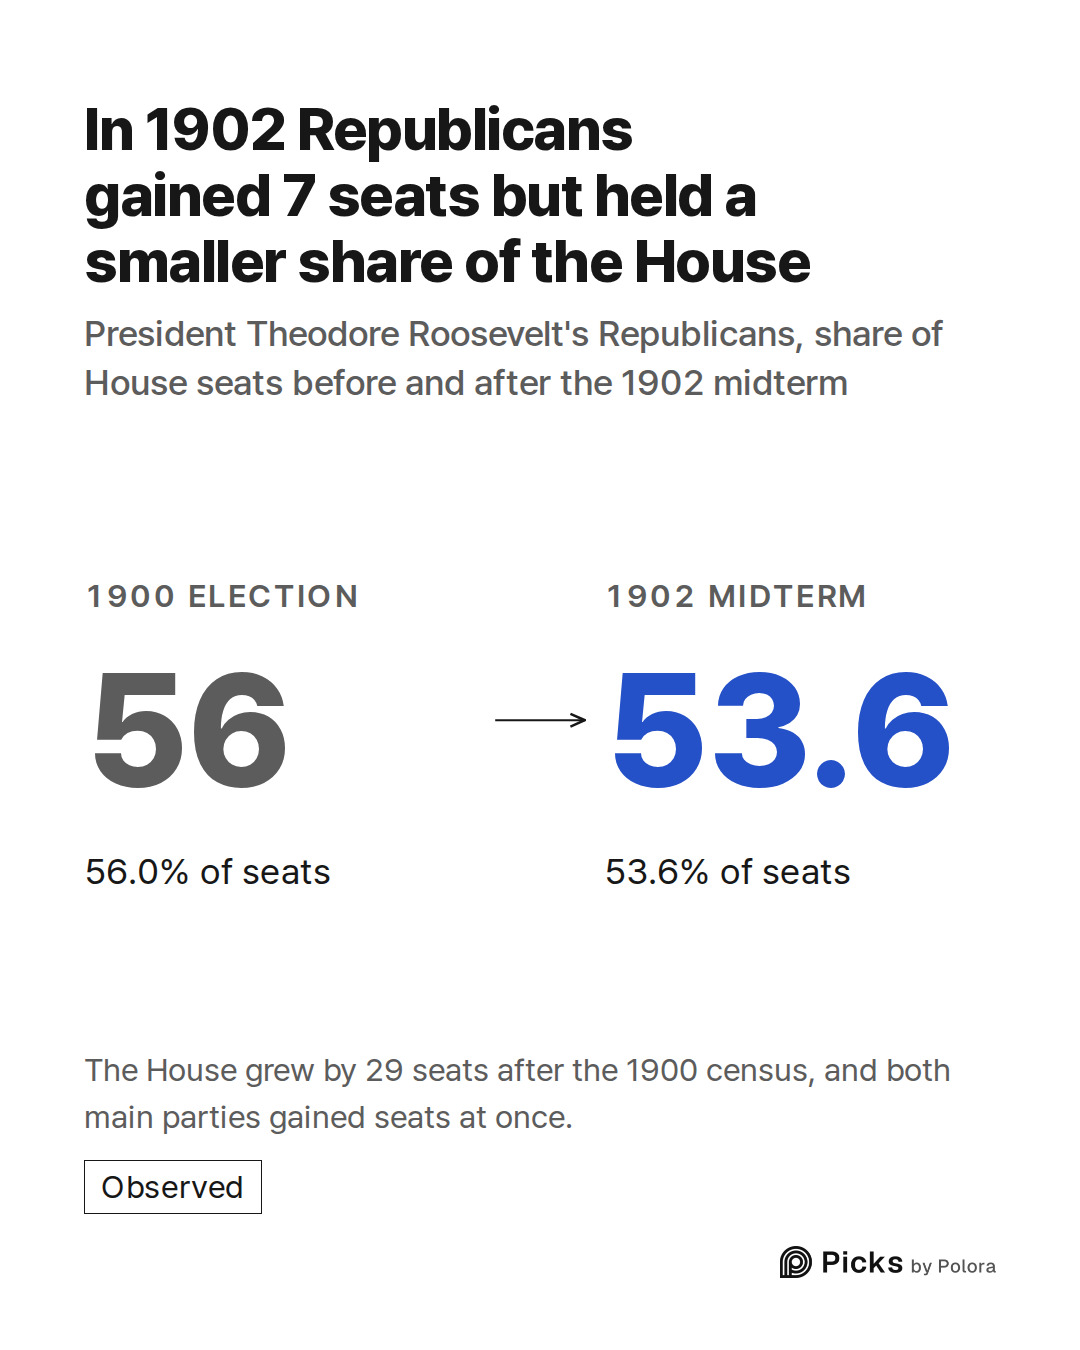
The 1902 gain of 7 seats is partly a matter of arithmetic. After the 1900 census the House grew by 29 seats, and both main parties gained at once, which Wikipedia notes has not happened since. Measured as a share of the House, President Theodore Roosevelt's Republicans fell from 56.0% of the seats to 53.6%. By that measure 1902 was a loss too.
The 1934 gain of 9 seats came in Franklin Roosevelt's first term, in the depths of the Great Depression. Wikipedia's account of that election says it "can be seen as a referendum on New Deal policies".
The president's party gained 4 seats in 1998, after House Republicans had opened an inquiry into impeaching President Clinton. It gained 8 in 2002, the first midterm after the 2001 terrorist attacks. For both years the Wikipedia accounts offer a reason only as something "some speculate" : a backlash against the attacks on Clinton in 1998, and a rally behind President George W. Bush in 2002. The seat counts show these gains happened. They cannot show why.
Why the president's party usually loses
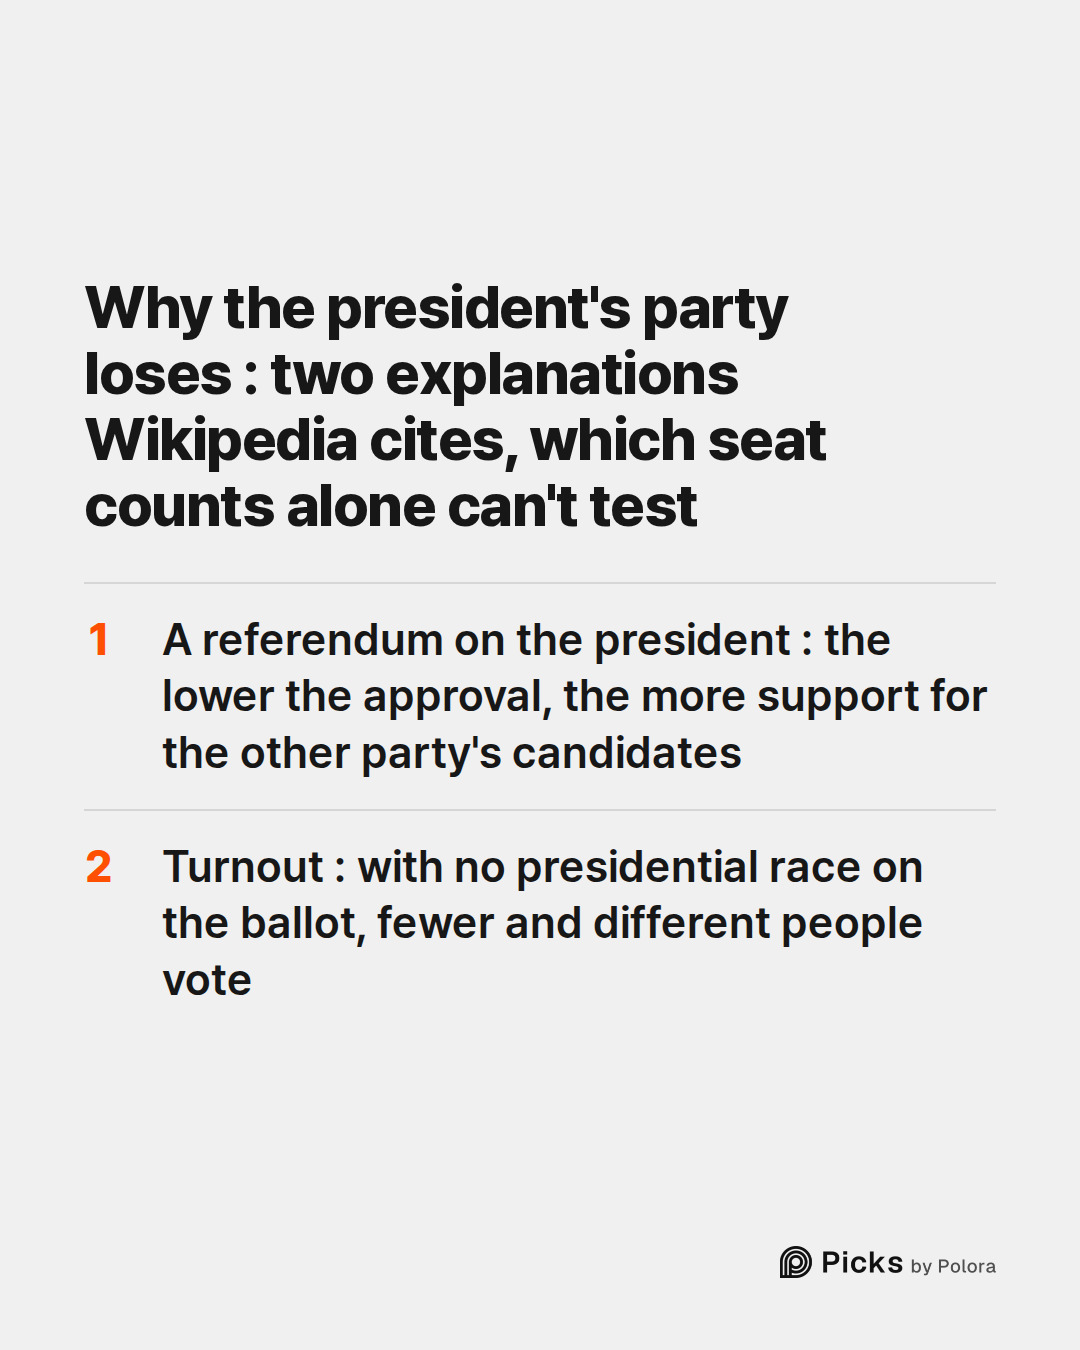
The House data shows a pattern; it doesn't explain it. Wikipedia's article on US midterm elections, citing political scientists and reporters, gives two explanations among others. The first is that midterms are treated as a referendum on the sitting president : the lower the president's approval, the more support the other party's candidates tend to get. The second is turnout. In a presidential year, the president's party is carried by the presidential race, the so-called coattail effect. Two years later that pull is gone, and fewer and different people vote, whatever the president's approval.
Seat counts alone can't test either explanation, or say how much each one matters.
Did it happen again in 2026?
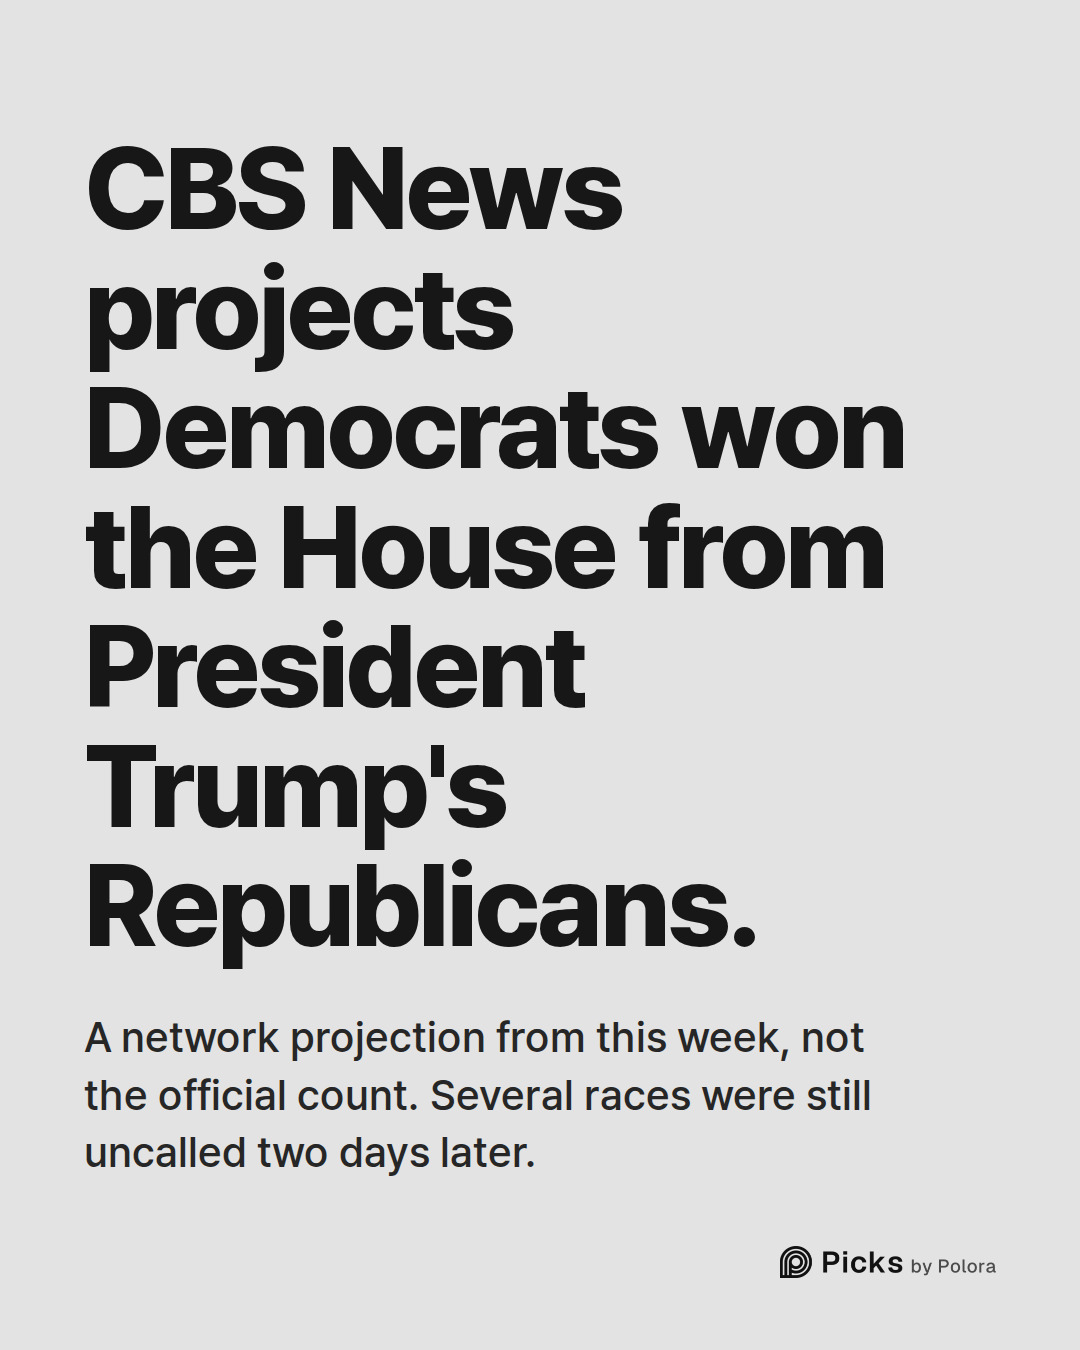
CBS News projects that Democrats won control of the House in Tuesday's election, flipping Republican-held seats in battleground districts across the country. Several races were still uncalled two days later. That would make 2026 one more midterm in which the president's party lost seats and the majority with them.
This year is not counted in the record above, which ends in 2022. The 2026 result described here is a network projection, not the House historian's official count.
How the numbers were made
Every seat count comes from the House historian's table of party divisions, which records the results on election day. A few totals leave out a seat that was vacant or had no certified winner when the new Congress met, such as one North Carolina district after the 2018 election. Each count was checked against the historian's separate page for that Congress, and all of them match. Later changes, such as special elections and party switches, are not included. Other published tallies, including Wikipedia's, differ from these in some years, because they start or end from a different seat count. For 2010, for example, Wikipedia gives a 63-seat loss rather than 64 : it starts from one fewer Democratic seat before the election. Which party held the White House at each midterm comes from Wikipedia's table of midterm elections.
- US House of Representatives, History, Art & Archives: Party Divisions of the House of Representatives, 1789 to present]
- US House of Representatives, History, Art & Archives: Congressional Profiles, 37th to 118th Congress]
- Wikipedia: United States midterm election]
- Wikipedia: 1866–67 United States House of Representatives elections]
- Wikipedia: 1894 United States House of Representatives elections]
- Wikipedia: 1902 United States House of Representatives elections]
- Wikipedia: 1934 United States House of Representatives elections]
- Wikipedia: Republican Revolution]
![Sources 8 : history.house.gov · US House of Representatives, History, Art & Archives: Party Divisions of the House of Representatives, 1789 to present], history.house.gov · US House of Representatives, History, Art & Archives: Congressional Profiles, 37th to 118th Congress], en.wikipedia.org · Wikip](https://media.cdn.polora.ai/picks/2026/11/pickrun_92bcd7a312834234/qNIIlBjEcs431uH2-slide-08--does-the-president-s.jpg)