Cheaper than in 1980, once inflation is counted
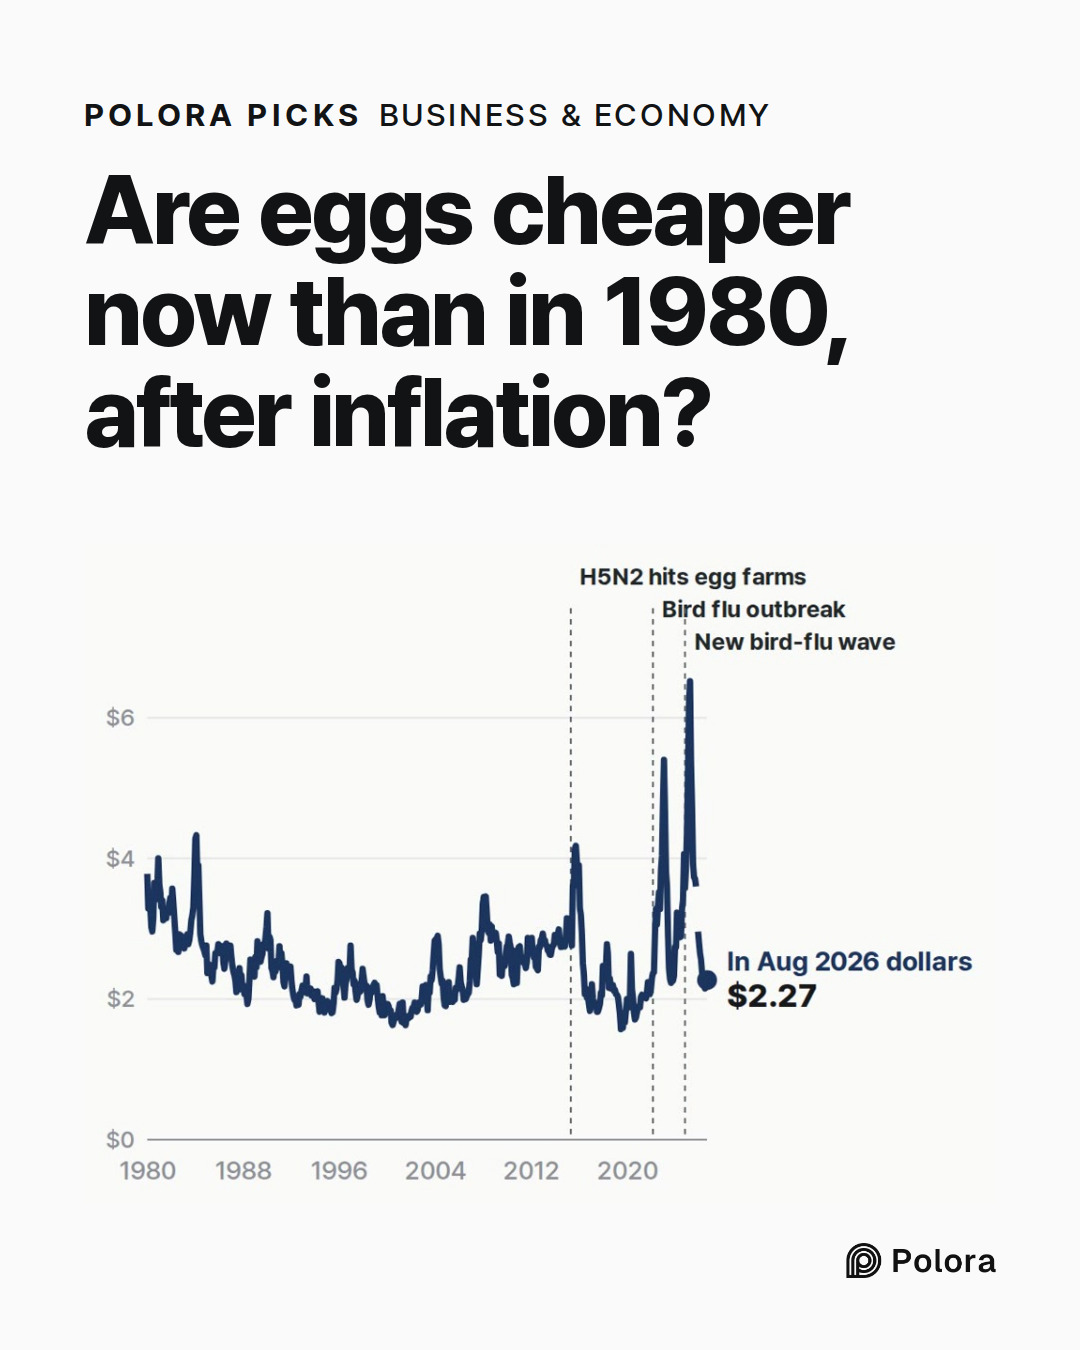
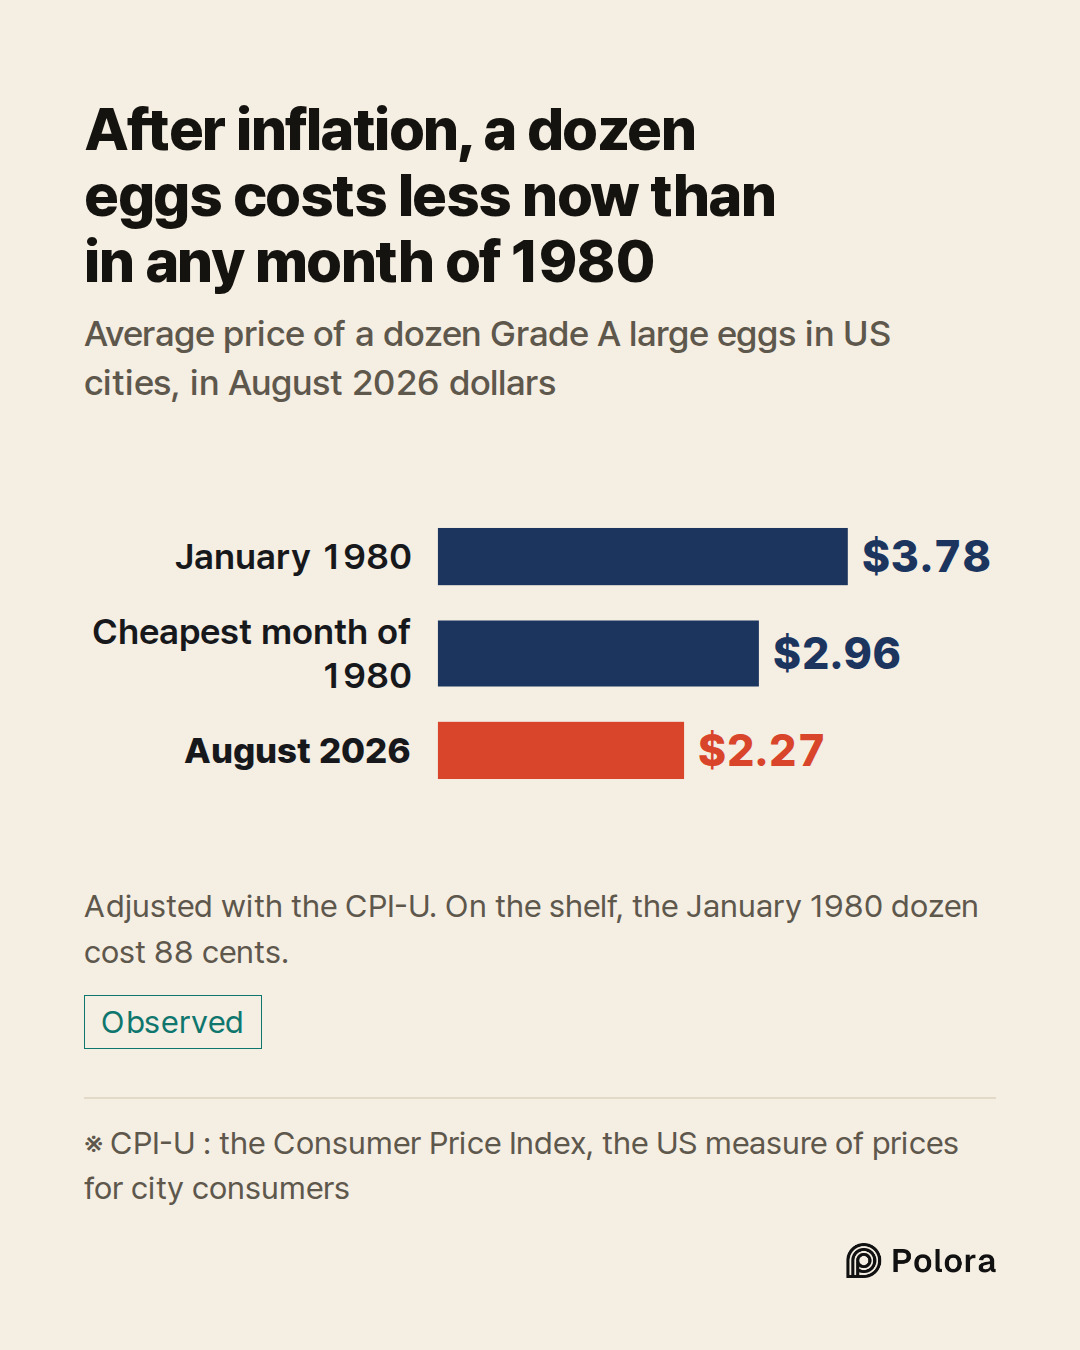
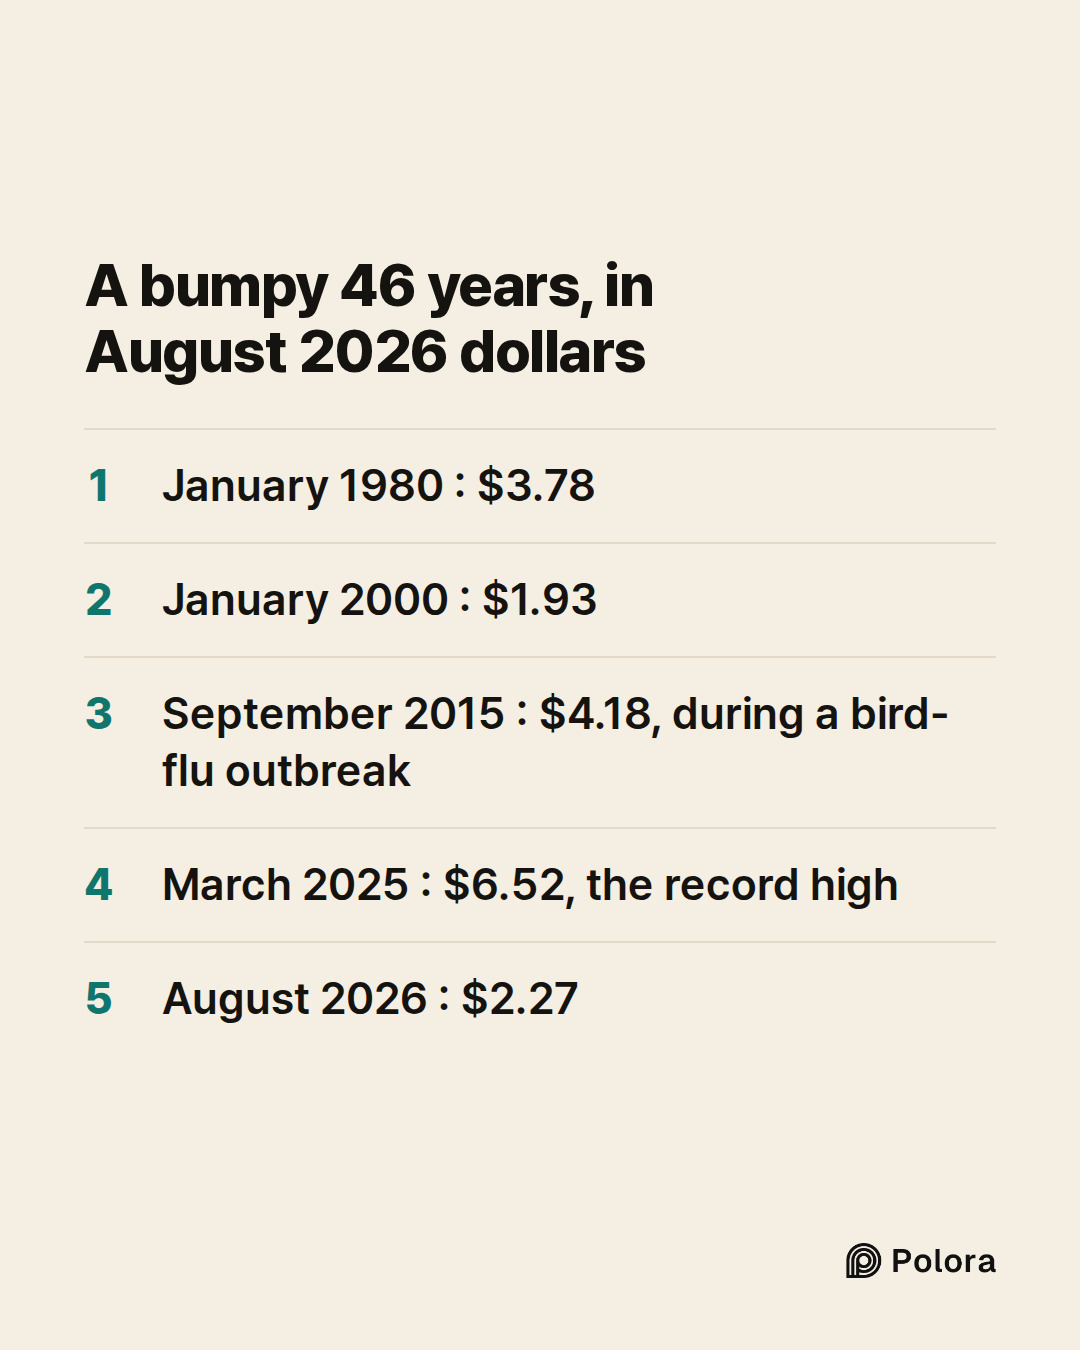
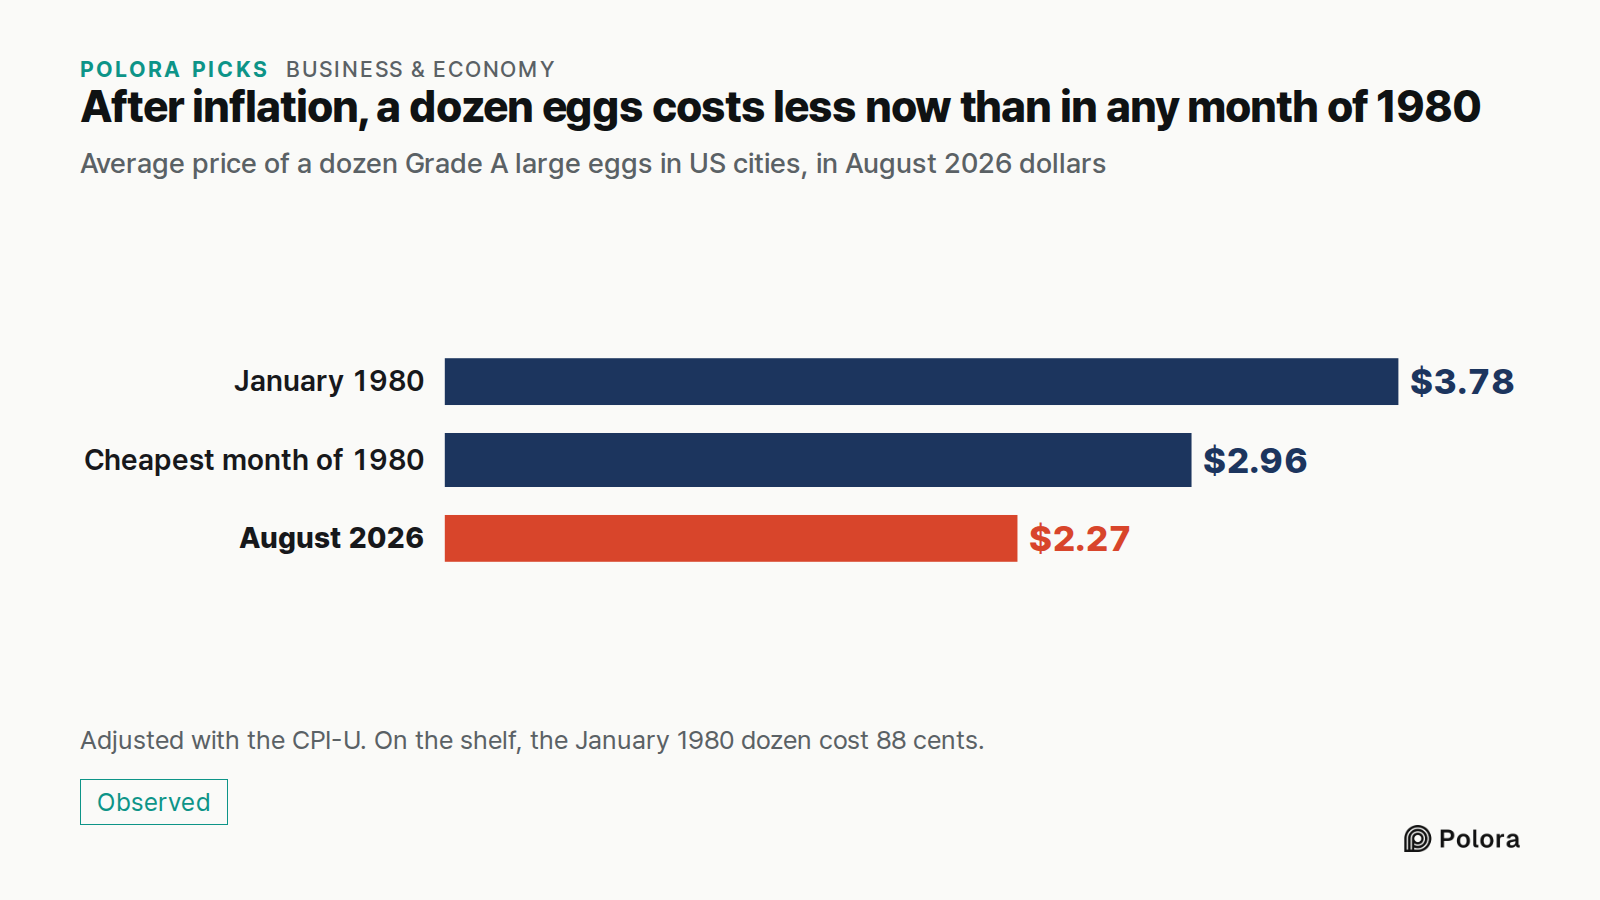
In January 1980 a dozen Grade A large eggs cost 88 cents on average in US cities, according to the US Bureau of Labor Statistics (BLS). Prices in general have risen a lot since then. To compare the two years fairly, we convert each month's price into August 2026 dollars, using how much the Consumer Price Index (CPI-U), BLS's measure of prices for city consumers, rose between that month and August 2026. On that basis, the January 1980 dozen cost $3.78.
In August 2026 the average was $2.27. Even the cheapest month of 1980 was higher, at $2.96 in today's dollars.
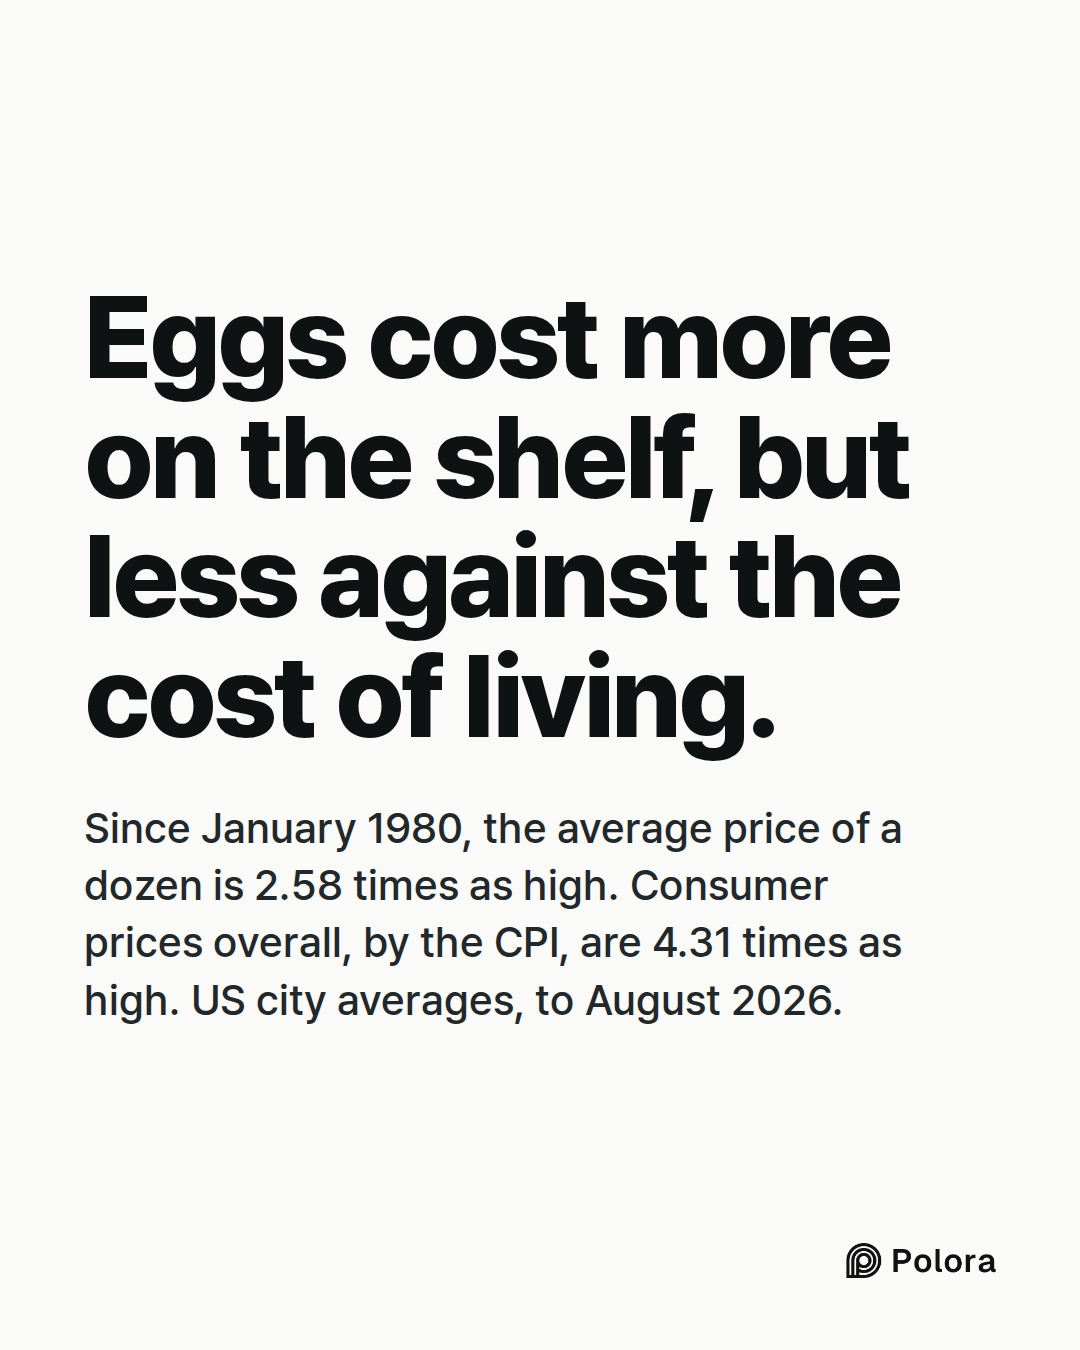
By August 2026, consumer prices overall were 4.31 times as high as in January 1980. The average price of a dozen eggs was 2.58 times as high. So eggs cost more on the shelf, but less compared with the cost of living as a whole, as the CPI measures it.
A bumpy 46 years
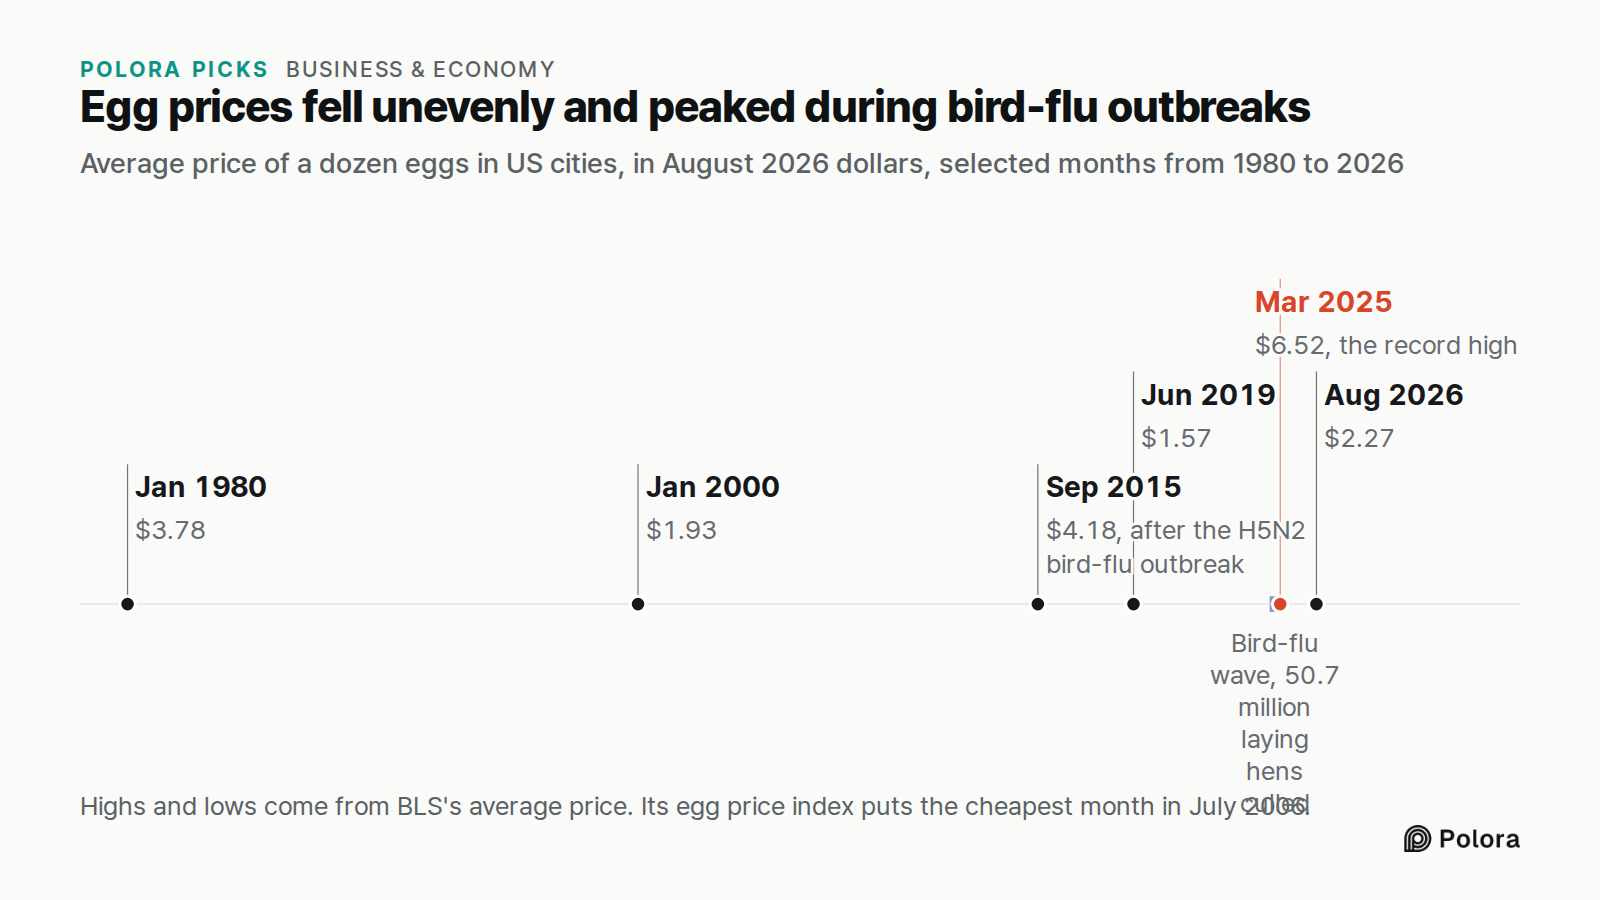
The fall was not steady. All the amounts below are in August 2026 dollars unless marked as shelf prices. By January 2000 the price had dropped to $1.93. Later spikes came at the same time as bird-flu outbreaks. For the 2024–25 spike, the US Department of Agriculture (USDA) points partly to the hens that were lost.
2015. An H5N2 bird-flu outbreak hit Midwest egg farms that spring. The price reached $4.18 in September 2015, then fell back to $1.57 by June 2019.
2022. Bird flu returned in February 2022. USDA's Economic Research Service (ERS) counts more than 43 million egg-laying hens lost by the end of that year.
Late 2024 to early 2025. A new wave, from mid-October 2024 to early March 2025, led to the culling of 50.7 million laying hens. ERS says that "strong egg demand coupled with tight supplies contributed" to record wholesale and retail prices. In March 2025 shoppers paid $6.23 a dozen, or $6.52 in August 2026 dollars. That is the highest of the 559 months with data since January 1980.
Prices then fell through June 2026, to $2.15 (BLS has no figure for October 2025), before edging up to $2.27 in August.
Eggs measured in minutes of work
So far eggs have been set against prices in general. Another way to judge whether eggs are cheap is how long you have to work to buy them.
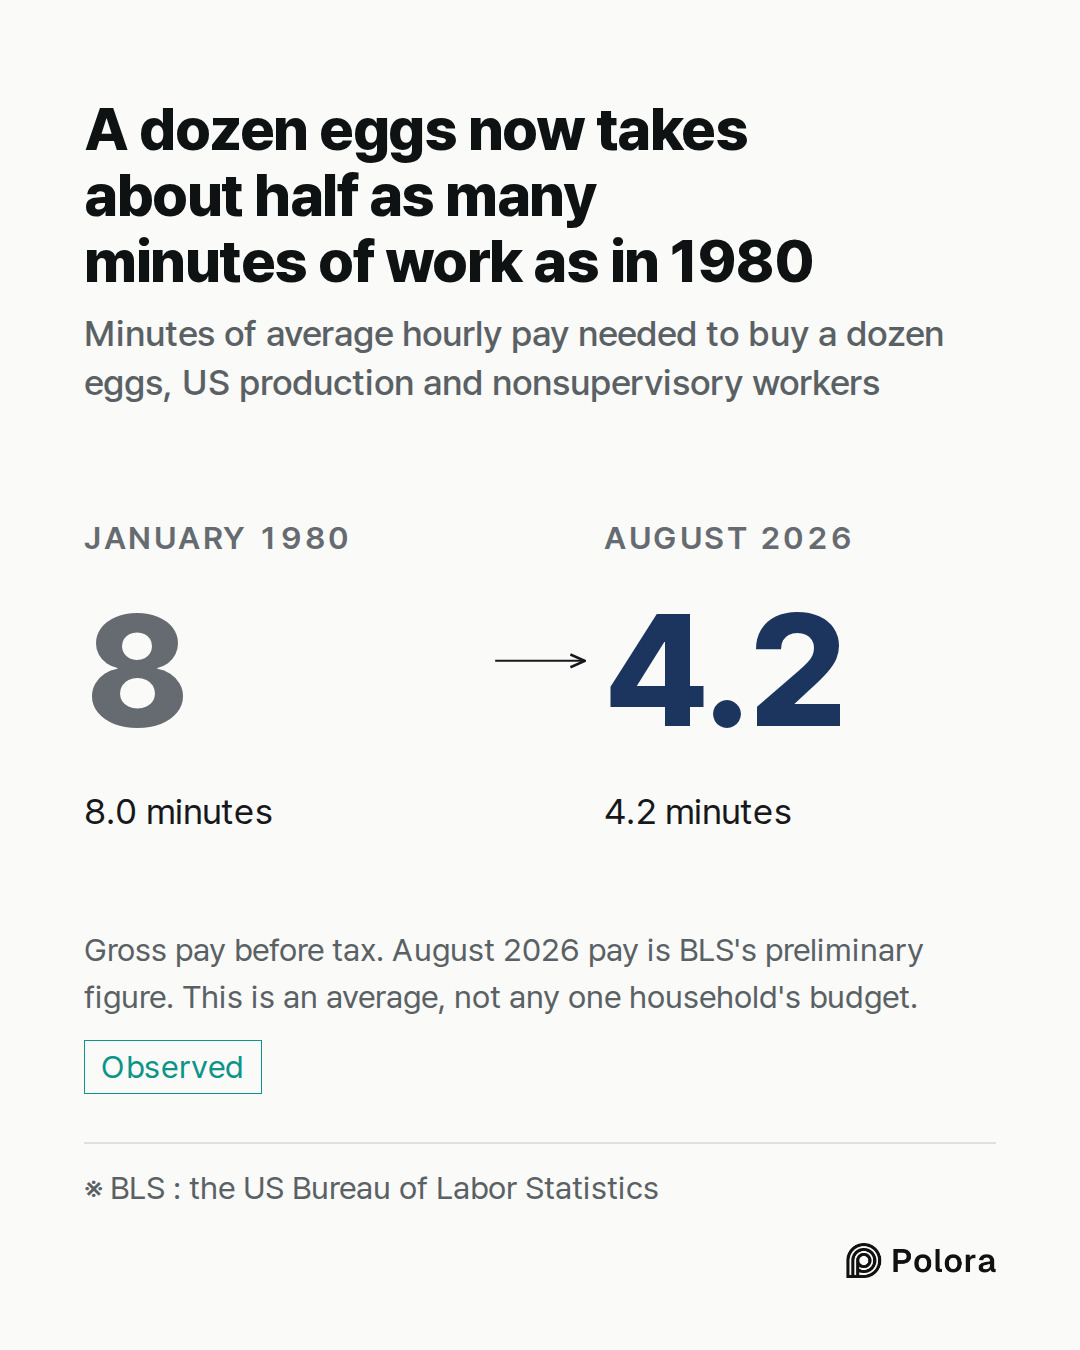
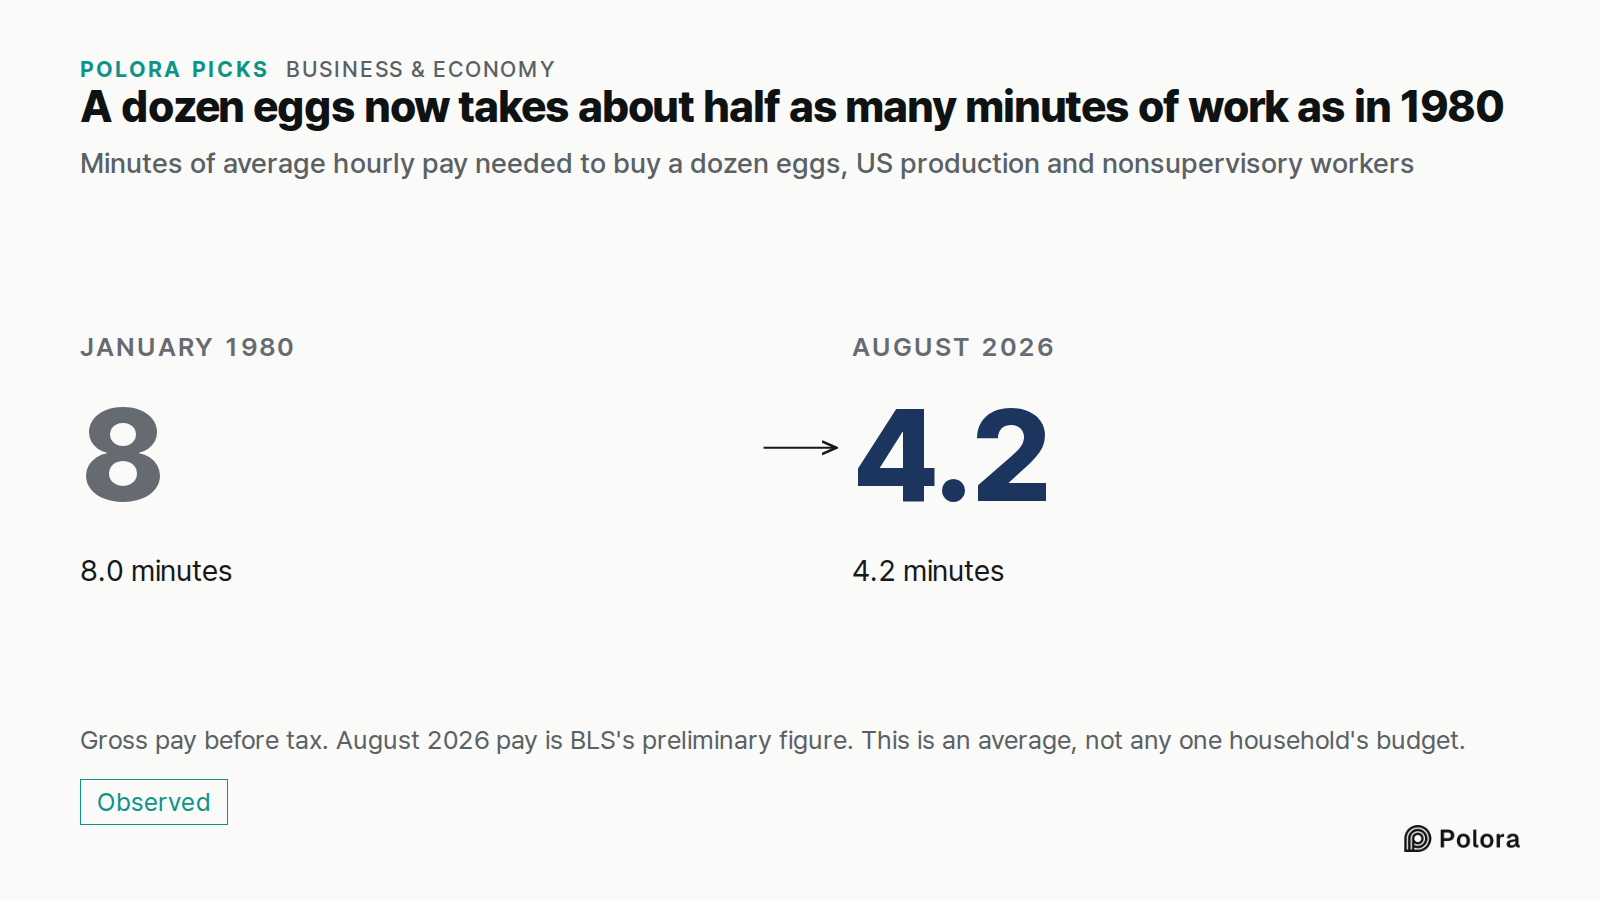
BLS publishes average hourly earnings for production and nonsupervisory workers in private industry. In service industries, that means everyone up to and including working supervisors. In manufacturing, mining and construction, it means production and construction workers. The figure is gross pay per hour, before deductions such as income tax. BLS says it leaves out benefits, irregular bonuses and employers' payroll taxes. In January 1980 it was $6.60 an hour, so a dozen eggs cost 8.0 minutes of work. In August 2026 it was $32.53 (BLS's preliminary figure), so a dozen cost 4.2 minutes. That is 48% less. At the March 2025 peak, a dozen cost 12.0 minutes.
By August 2026 these workers' hourly pay was 4.93 times as high as in January 1980, a little more than the rise in the CPI-U (4.31 times). That is why eggs look even cheaper against wages than against prices in general. (When BLS adjusts this group's pay for inflation, it uses a slightly different index, the CPI-W, built from the spending of wage earners and clerical workers.)
This is an average across many workers. It does not describe any one household's budget.
Cage-free and organic eggs
BLS's average covers a single item, a dozen Grade A large white eggs. BLS's current description says it "includes organic, non-organic, cage free, free range, and traditional" eggs. Across the US egg industry, the mix has shifted a lot :
ERS estimated that 12.9% of US laying hens were cage-free in 2017. By 2019, certified organic hens were more than 4.5% of the flock.
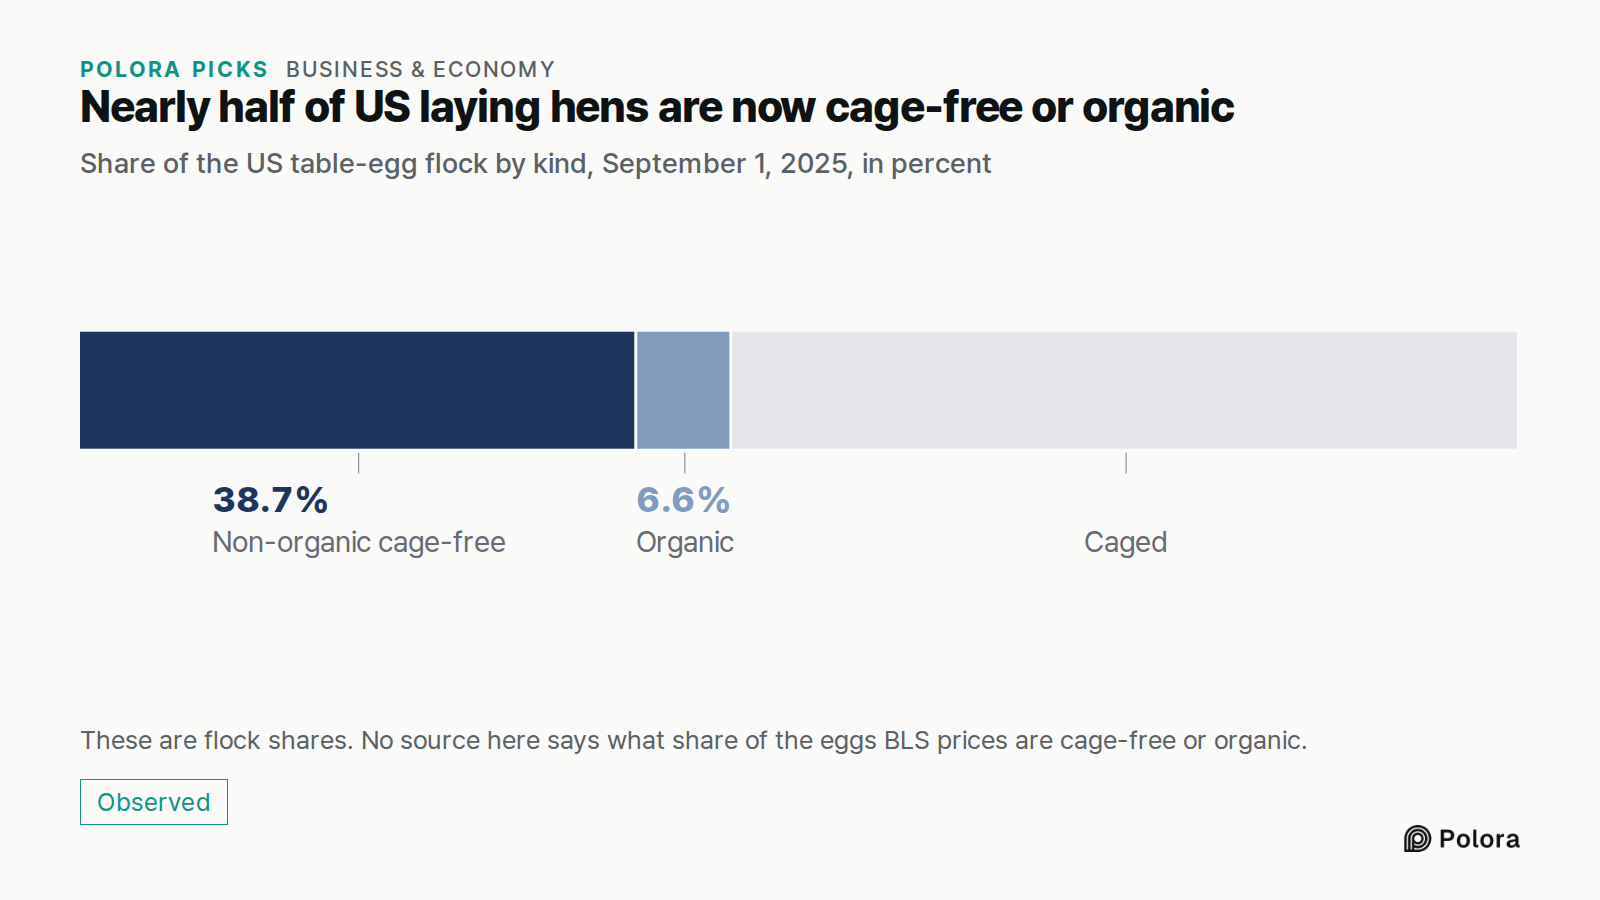
By September 1, 2025, USDA's Agricultural Marketing Service counted 38.7% of the table-egg flock as non-organic cage-free and 6.6% as organic. Caged and cage-free hens stood at 55 to 45. (The 2017 ERS estimate does not say whether it includes organic hens, so the two figures may not be counted quite the same way.)
Spending moved the same way. The share of US retail egg spending on white eggs with no welfare or production claim fell from 41% in January 2008 to 27% in December 2018.
These kinds usually cost more. An ERS study of retail sales from 2008 to 2018 estimated that eggs labelled cage-free sold for 13.8% more on average than comparable eggs without the claim, and organic eggs for 40.9% more.
Does this shift show up in BLS's average? None of the sources used here say what share of the eggs BLS priced in 1980 or in 2026 were cage-free or organic. Flock shares and spending shares cannot stand in for that. If the dozens BLS prices have shifted toward these kinds, then with everything else unchanged that would push the average up, not down. The figures used here cannot separate the effect of the mix from the price changes.
How sure is this?
BLS itself says its average prices "are best used to measure the price level in a particular month, not to measure price change over time". For change over time it recommends its price index for eggs, which covers eggs more broadly than the one Grade A large item. We checked the main claims against that index, also adjusted for inflation :
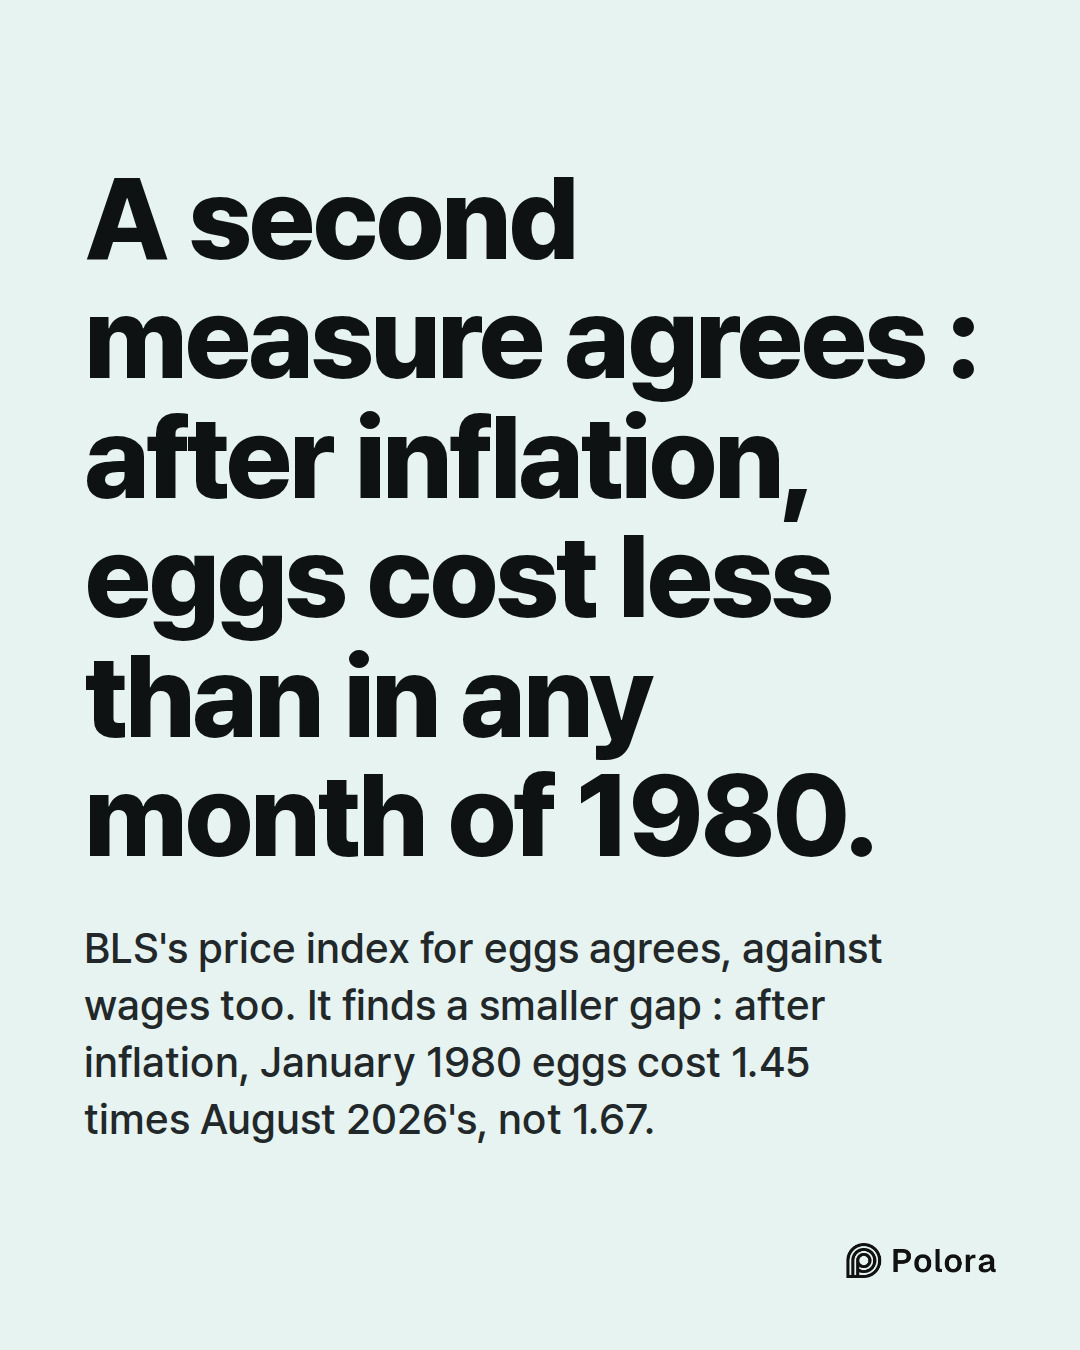
Both measures agree that August 2026 is cheaper than every month of 1980, and that March 2025 was the most expensive month from January 1980 to August 2026.
They disagree on how big the changes are. By the average price, eggs in January 1980 cost 1.67 times what they did in August 2026, after inflation. By the index, 1.45 times.
They also disagree on the cheapest month since January 1980. The average price puts it in June 2019 ; the index puts it in July 2006.
Against wages, both agree eggs were cheaper in August 2026 than in every month of 1980. From January 1980 to August 2026, the fall is 48% by the average price and 40% by the index. But by the index, the most expensive month against wages was February 1984, not March 2025.
So "cheaper than in 1980" holds on every inflation-adjusted and wage-adjusted measure here. On the shelf, of course, a dozen costs more than the 88 cents of 1980. The exact dollar amounts and minutes come from the average price.
- US Bureau of Labor Statistics : average price, eggs, Grade A large, per dozen, US city average (series APU0000708111)
- US Bureau of Labor Statistics : Consumer Price Index for all urban consumers, all items, not seasonally adjusted (CUUR0000SA0)
- US Bureau of Labor Statistics : Consumer Price Index, eggs (CUUR0000SEFH)
- US Bureau of Labor Statistics : average hourly earnings of production and nonsupervisory employees, total private, not seasonally adjusted (CEU0500000008)
- US Bureau of Labor Statistics, Handbook of Methods, Current Employment Statistics : concepts (what hourly earnings include and exclude)
- BLS series notes on what the egg average includes and how to use average prices, as republished by FRED, Federal Reserve Bank of St. Louis
- USDA Economic Research Service, "Retail egg prices fall, following declining wholesale prices" (June 2025)
- USDA Economic Research Service, "Avian influenza outbreaks reduced egg production, driving prices to record highs in 2022"