What is being compared
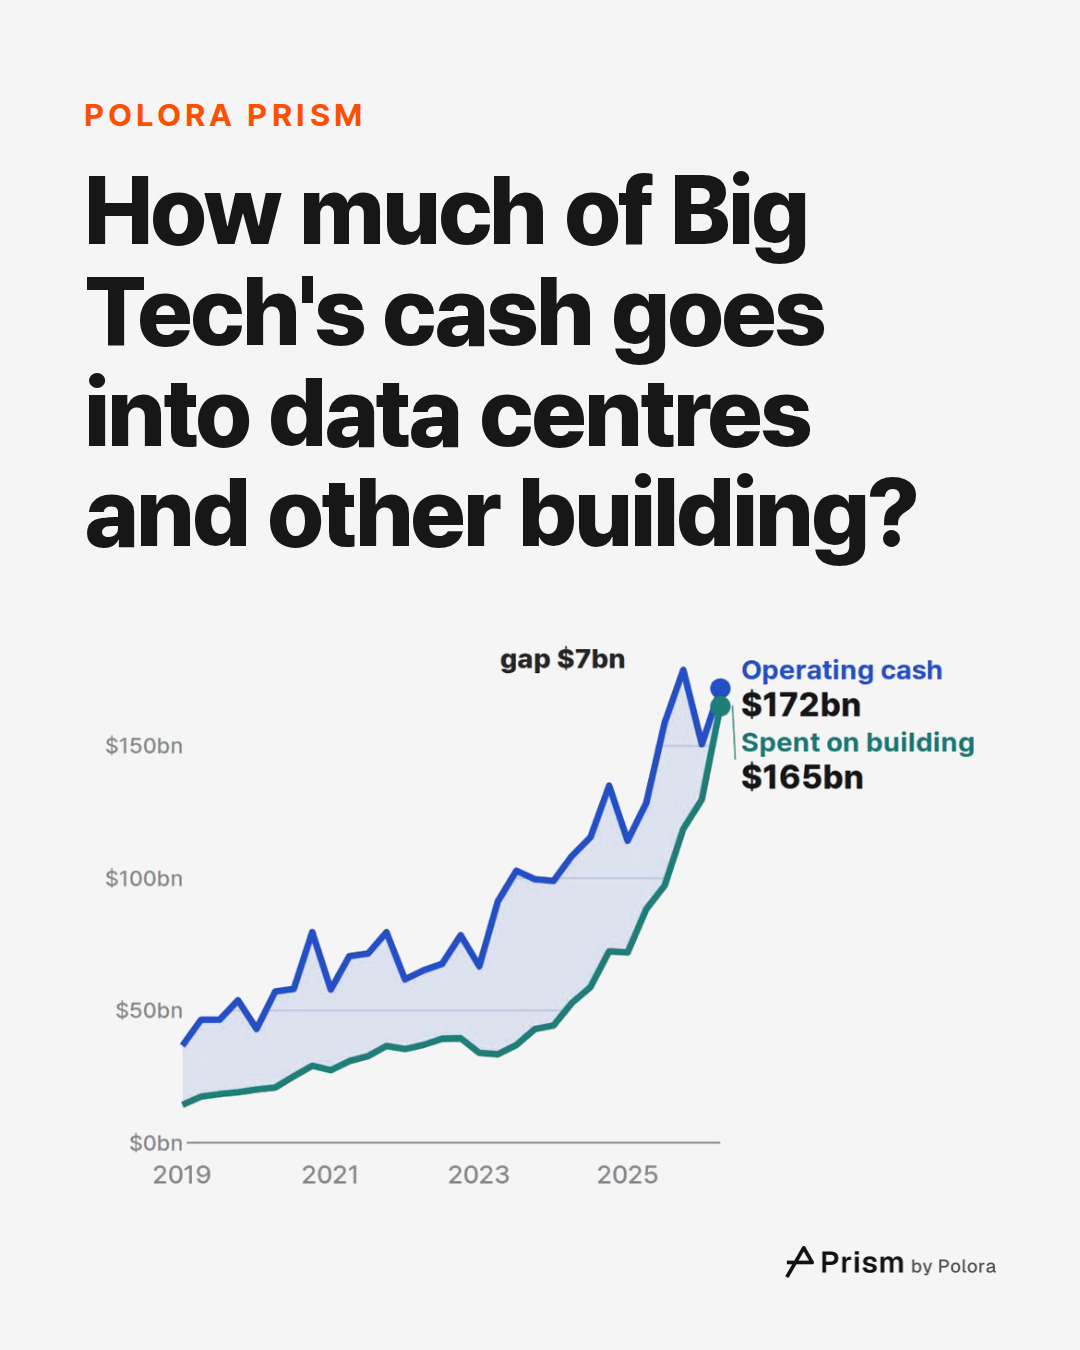
This piece sets two lines from the four companies' cash-flow statements side by side. The companies file these statements with the US Securities and Exchange Commission. The first line is operating cash : the cash that running the business brought in during the quarter. It is counted after paying staff, suppliers and taxes, and before the cash the companies put into investments, including this spending. The second line is what the companies paid in cash for property and equipment : data centres, servers, network gear, offices and, at Amazon, warehouses and its delivery network. Here it is called spending on building.
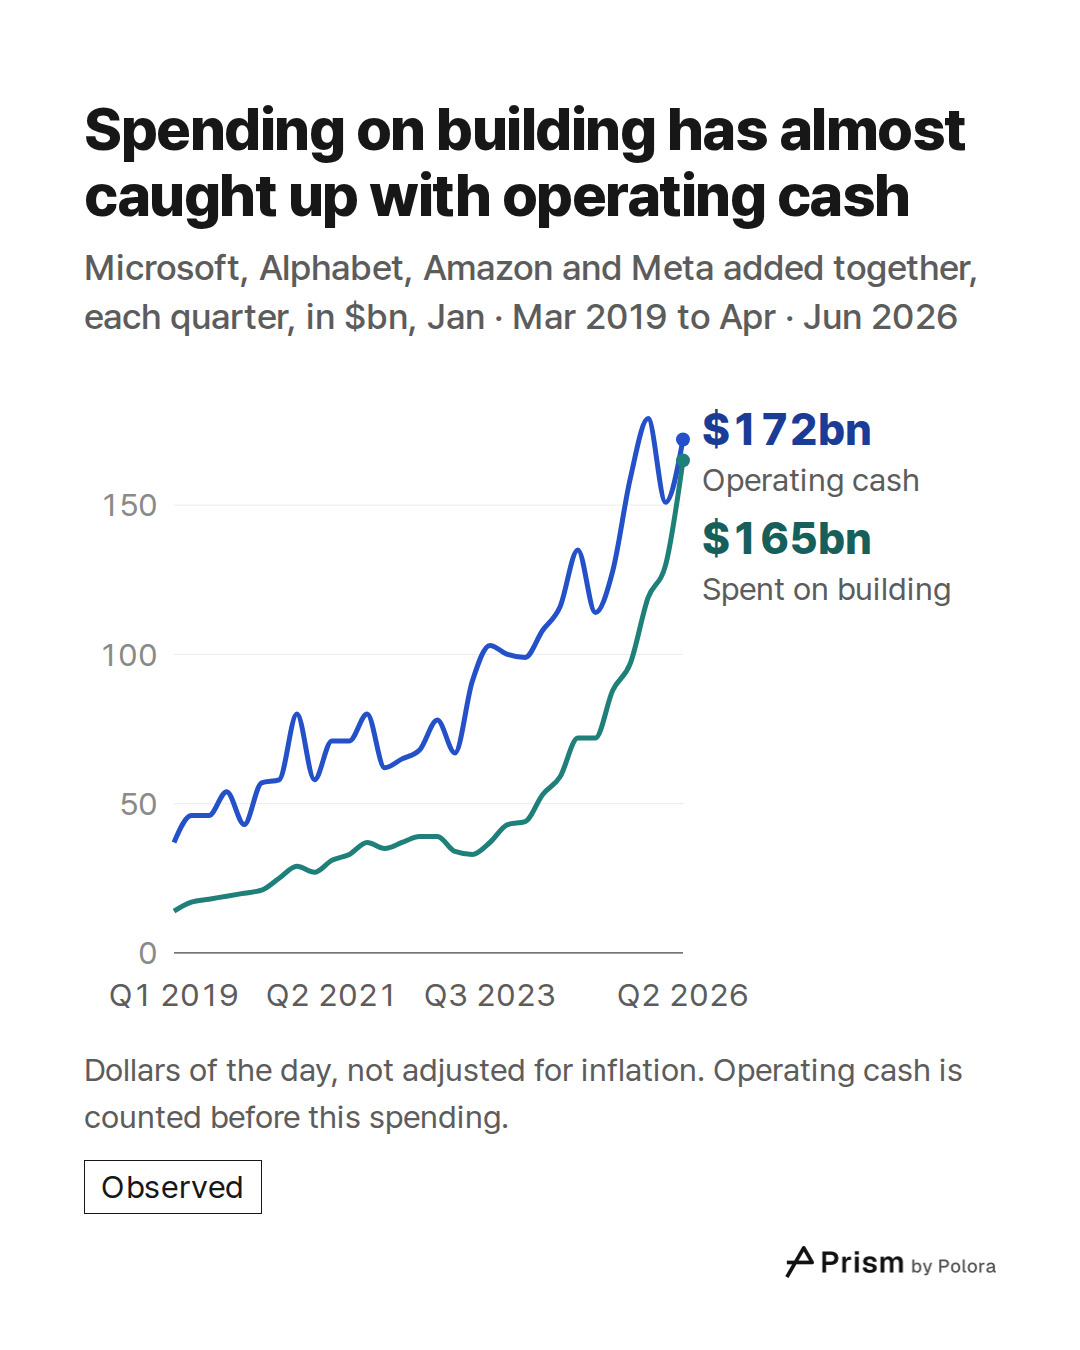
All figures are in dollars of the day, not adjusted for inflation, and the four companies are added together quarter by quarter. The companies report year-to-date totals, so each quarter is the year to date minus the months before it. Microsoft's financial year starts in July, so its April–June quarter is the last of its fiscal year and is worked out the same way from its annual report. Its quarters still cover the same calendar months as the others'.
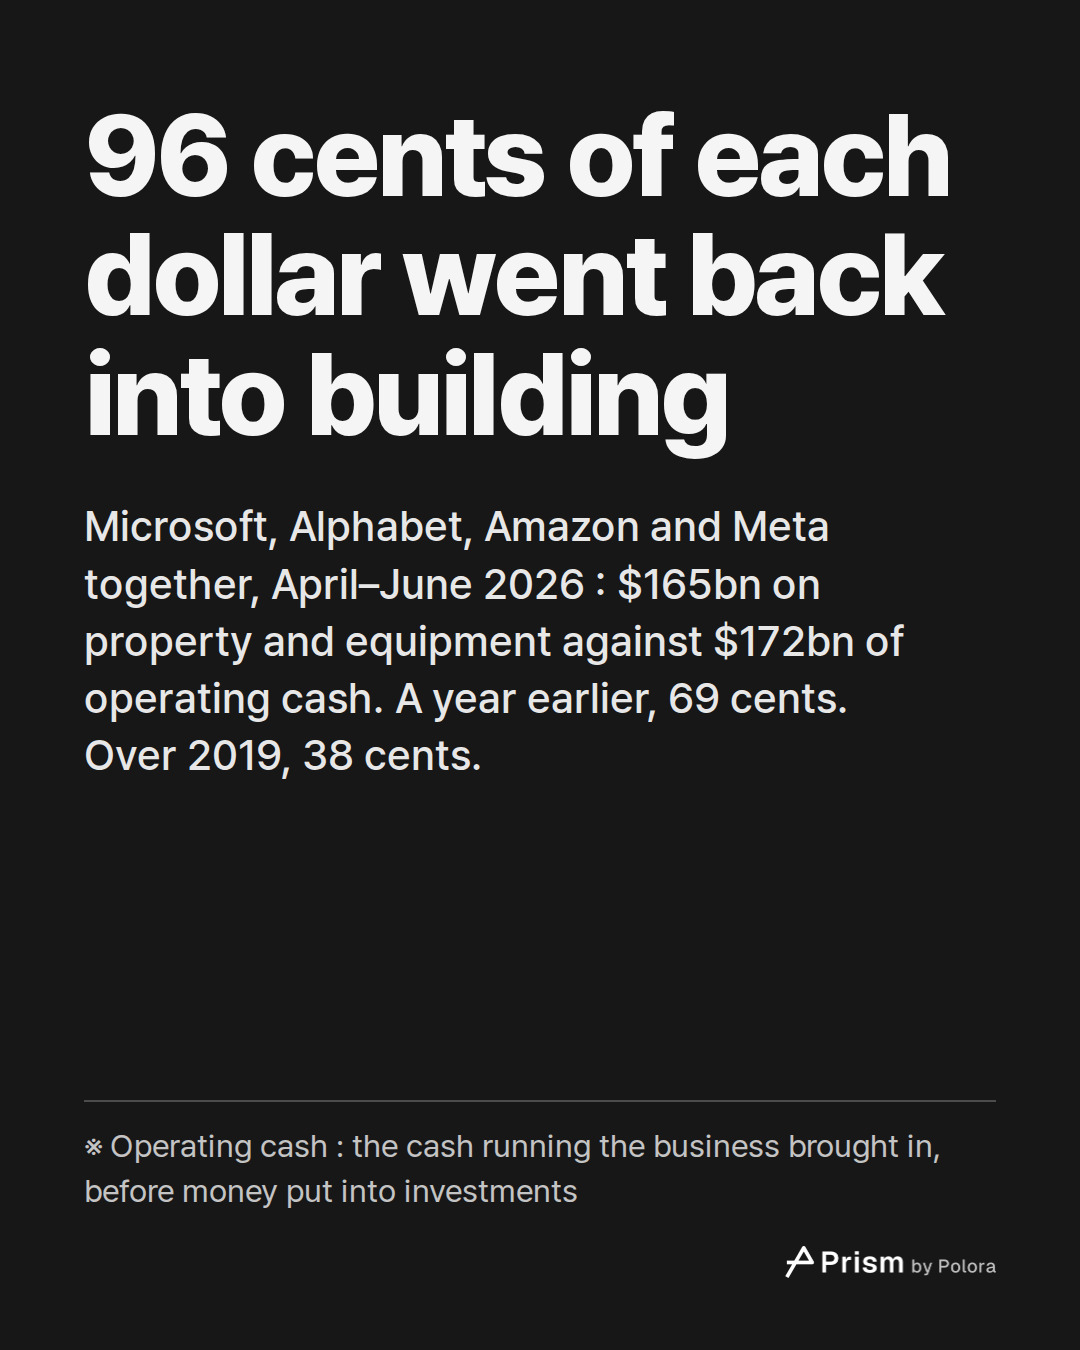
From 38 cents to 96
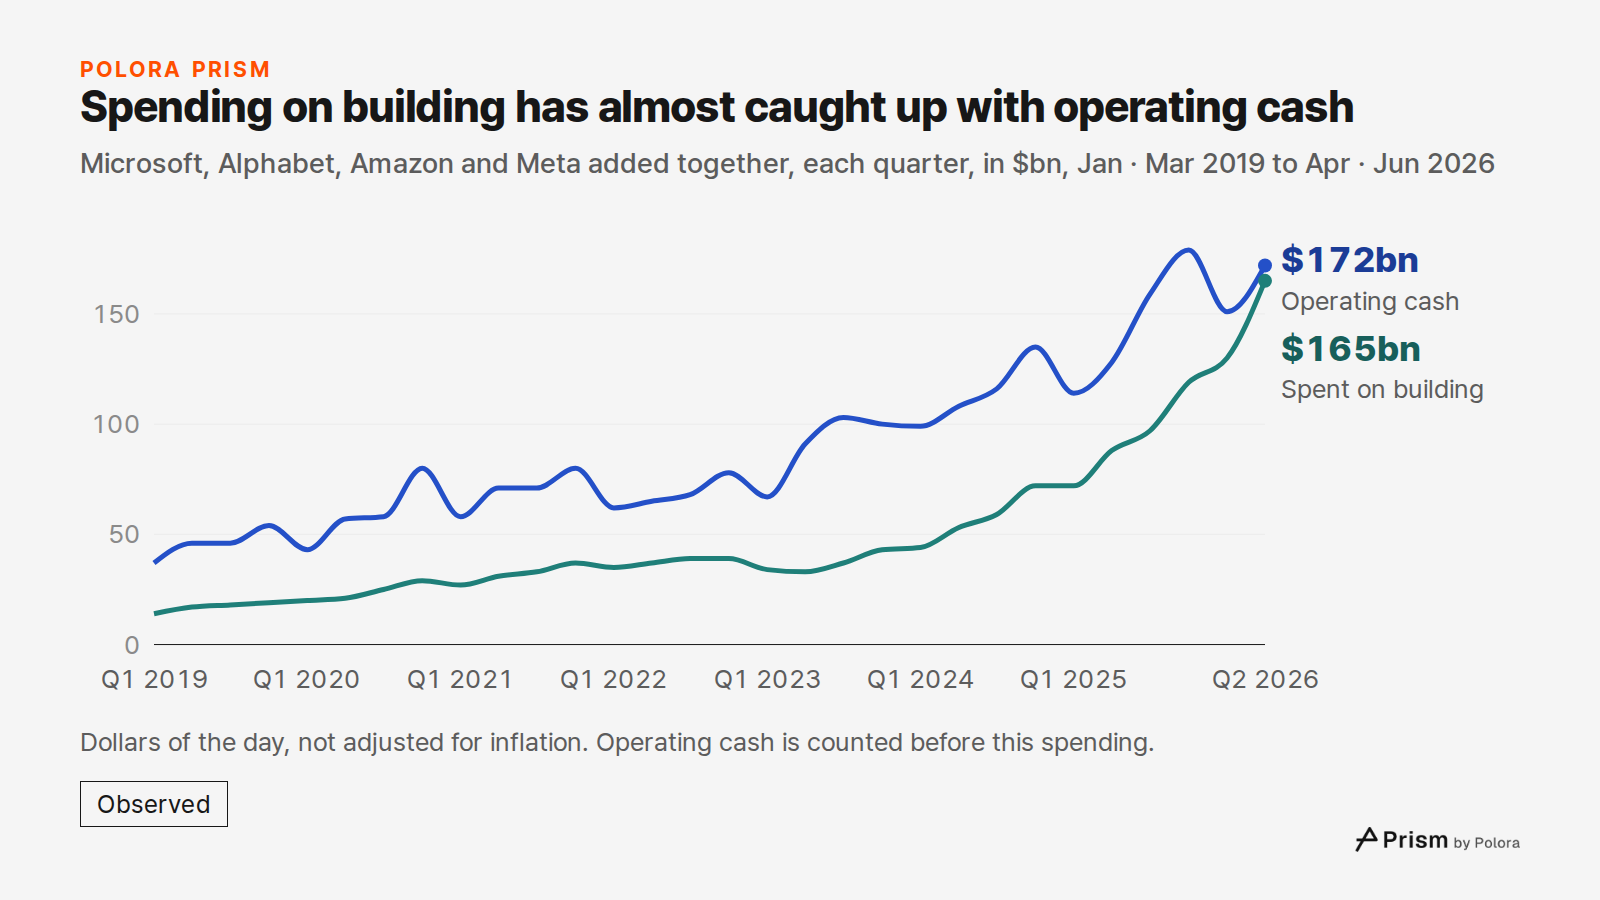
Over the full year 2019, the four spent 38 cents on building for each dollar of operating cash. For the next few years the gap between the two lines stayed wide. Over the full year 2022 spending rose while operating cash slipped slightly. Over 2023, operating cash jumped and spending dipped.
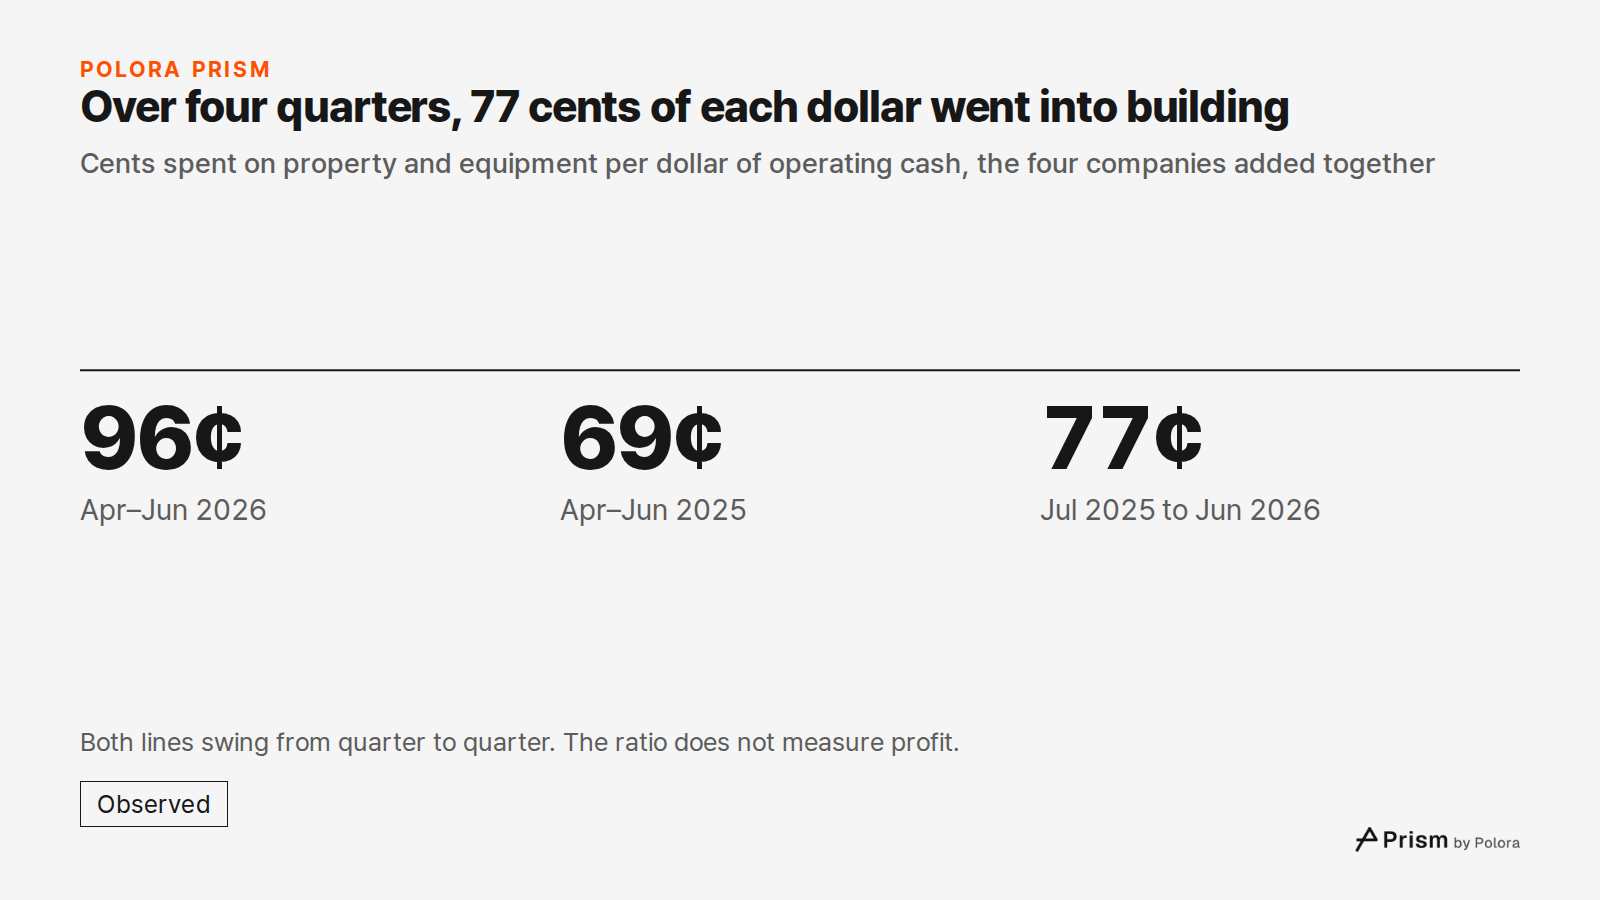
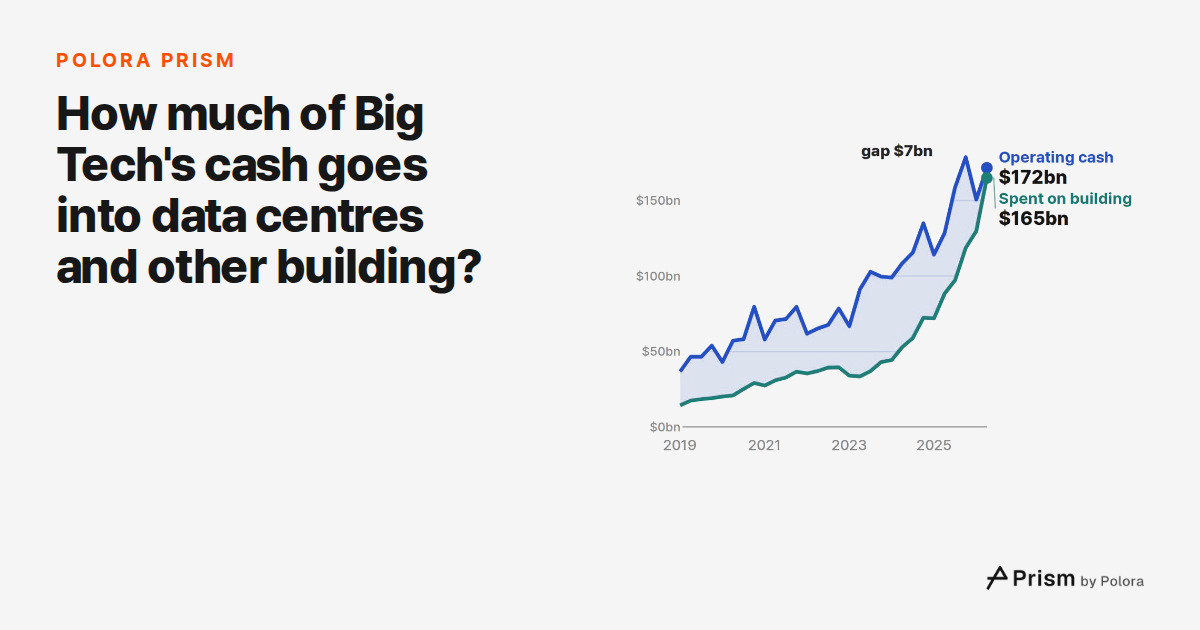
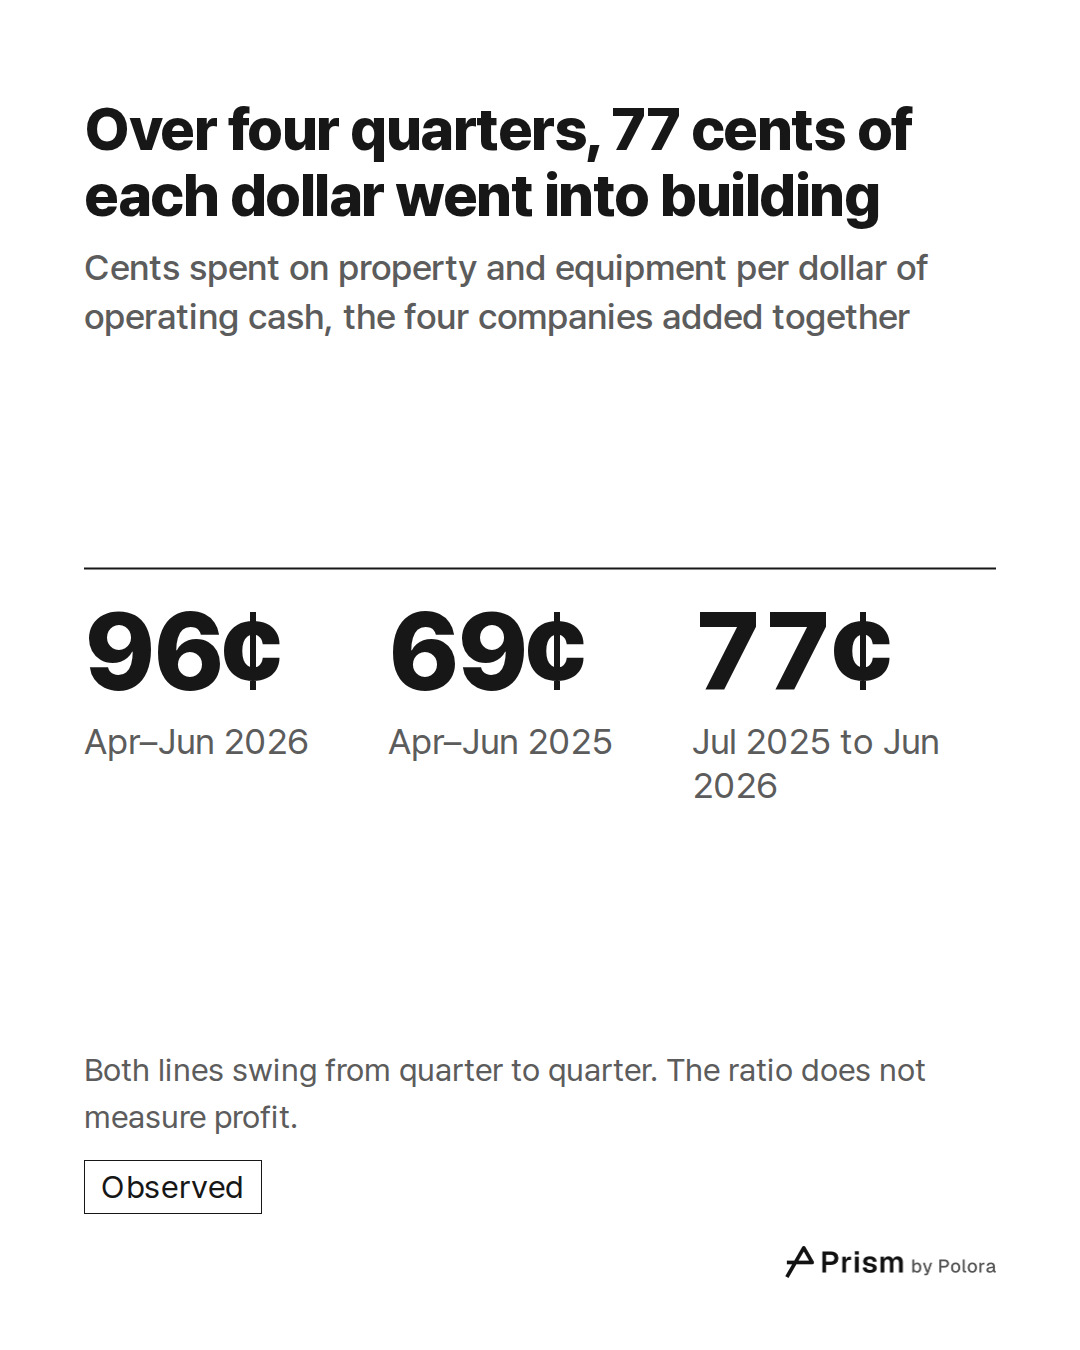
Then spending took off. The four spent $44bn in January–March 2024 and $119bn in October–December 2025. In January–March 2026 they spent 86 cents of each operating-cash dollar. In April–June 2026 they spent $165bn of $172bn, which left a gap of about $7bn between the two lines. In the same months a year earlier they had spent $88bn of $128bn, or 69 cents.
Not the same at every company
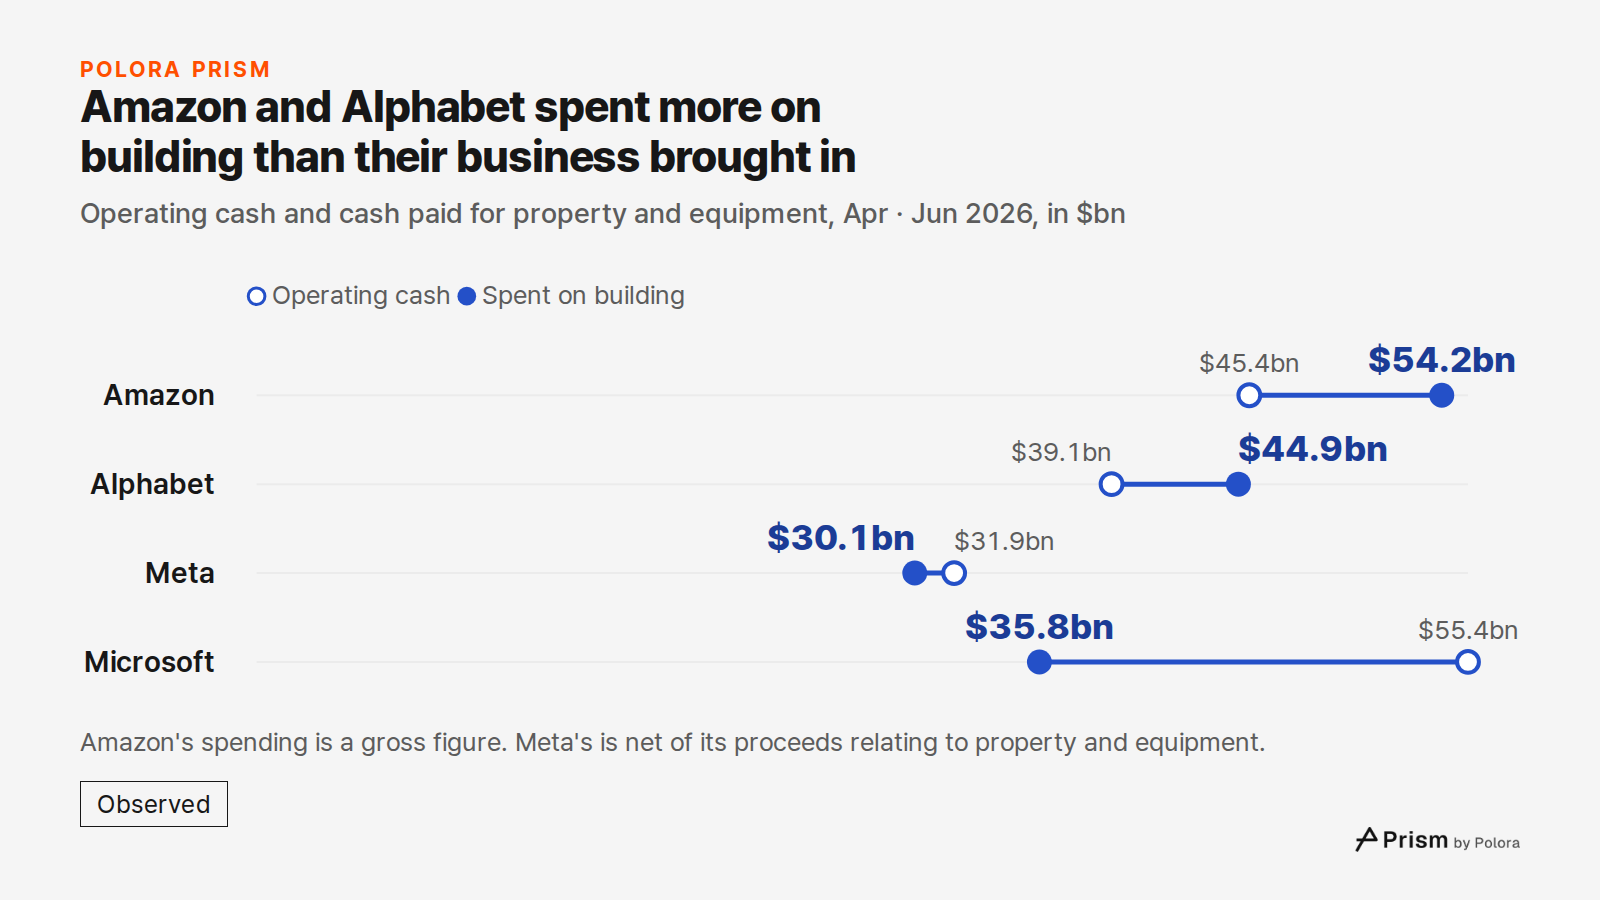
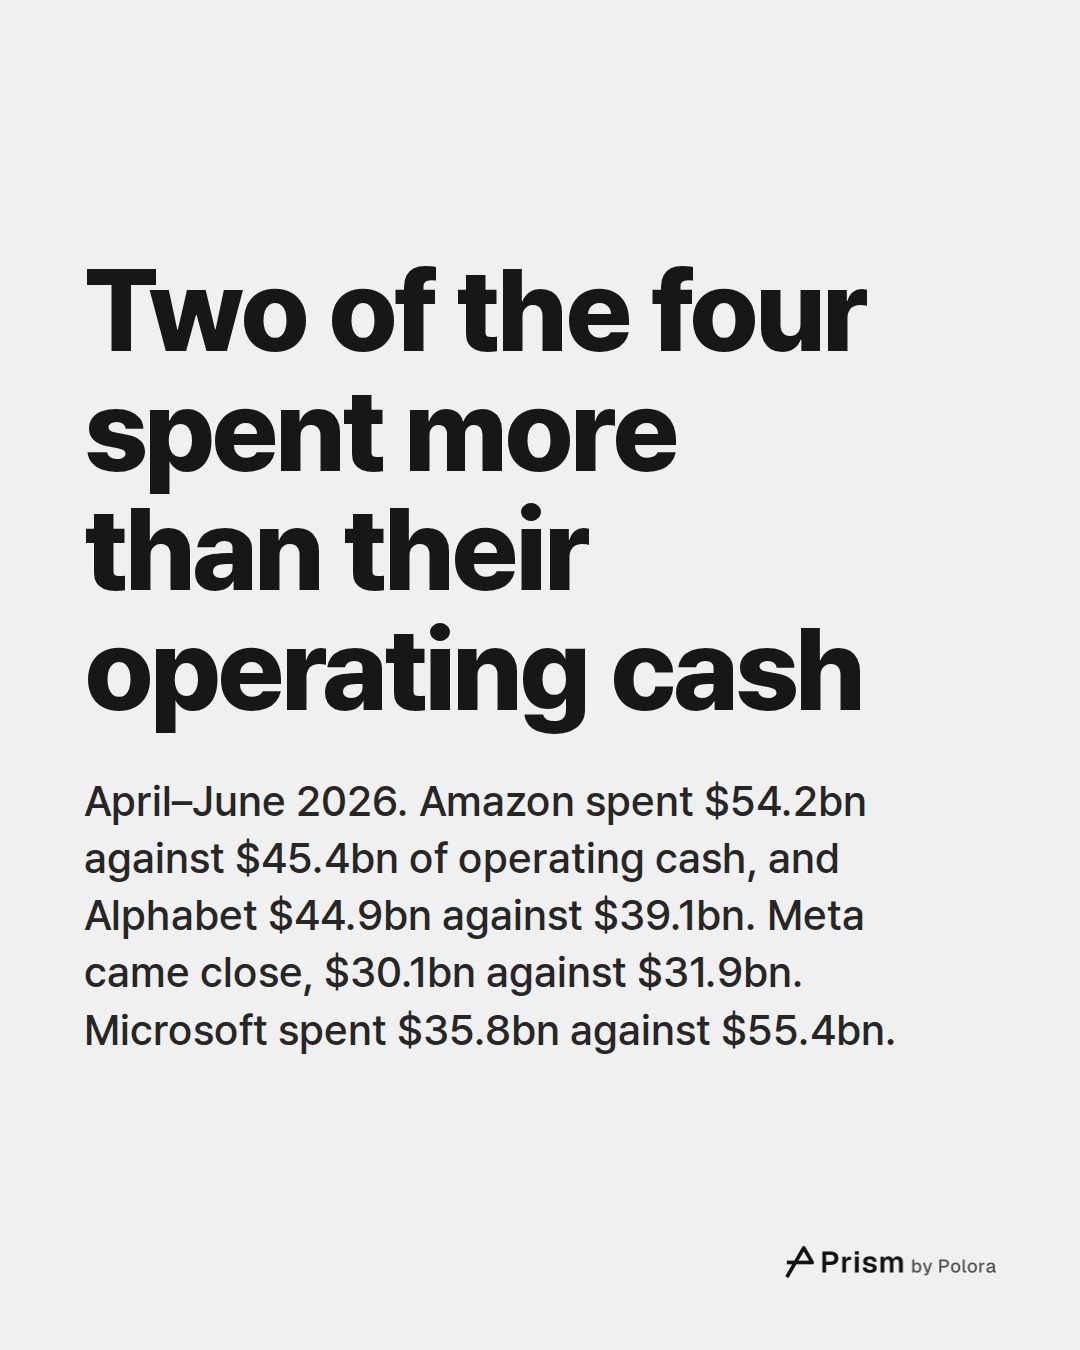
In April–June 2026, two of the four spent more on property and equipment than their own operating cash. Amazon spent $54.2bn against $45.4bn of operating cash, and Alphabet spent $44.9bn against $39.1bn. Meta came close, spending $30.1bn against $31.9bn. Microsoft spent $35.8bn against $55.4bn, the widest margin of the four.
One quarter, or a year
Both lines swing from one quarter to the next, so a single quarter can overstate or understate the trend. That is why the piece compares April–June with the same months a year earlier. Taking four quarters together smooths out those swings : from July 2025 to June 2026, the four spent $511bn of $660bn in operating cash, or 77 cents of each dollar. The latest quarter on its own is the highest reading in the period shown, from 2019 onwards.
What the money is for, in the companies' words
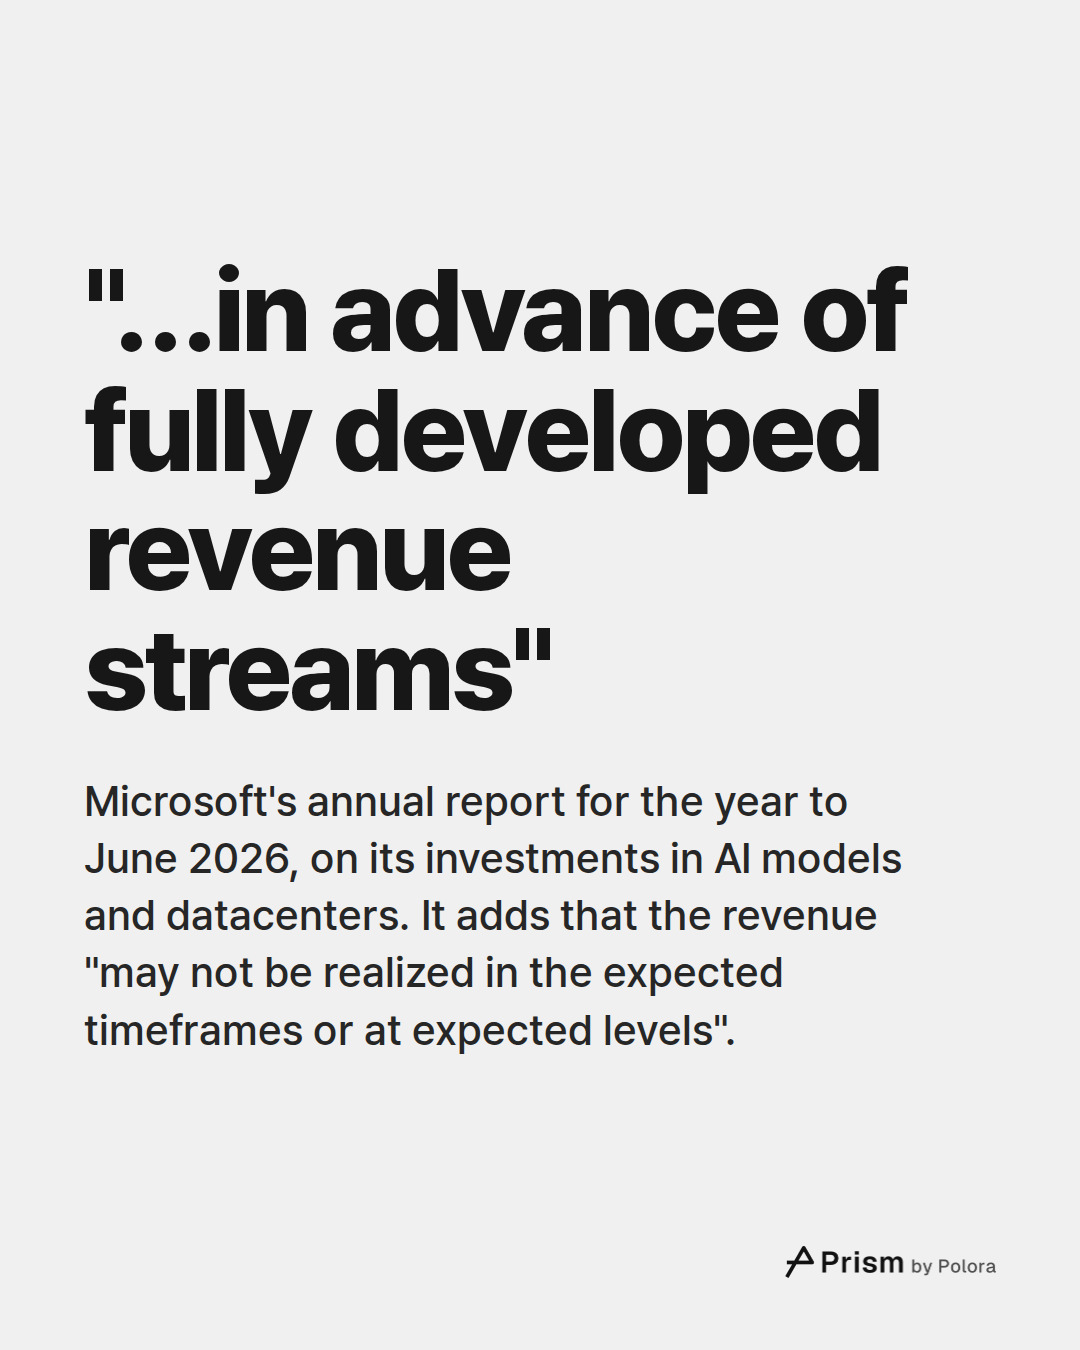
The data cannot separate spending on artificial intelligence from other building. The companies' own filings say what the money is for. Microsoft's annual report for the year to June 2026 says it is making "significant capital and operational investments to develop, train, deploy, and support AI models and related cloud-based services, including building and expanding datacenters". It adds that these investments are being made "at significant scale and on an accelerated timeline" and "in advance of fully developed revenue streams", and that the revenue "may not be realized in the expected timeframes or at expected levels".
Alphabet's quarterly report says the rise in its purchases of property and equipment in the first half of 2026 was "driven by investments in technical infrastructure". Meta's says it "continued to invest in servers, data centers, and network infrastructure". Amazon's says its "cash capital expenditures", a measure net of proceeds from asset sales and incentives, "primarily reflect investments in technology infrastructure (the majority of which is to support AWS business growth) and in additional capacity to support our fulfillment network". Amazon's July earnings release looks at a different measure, its spending over the past twelve months net of proceeds from sales and incentives, and says the increase on a year earlier "primarily reflects investments in artificial intelligence".
What the narrow gap does and does not say
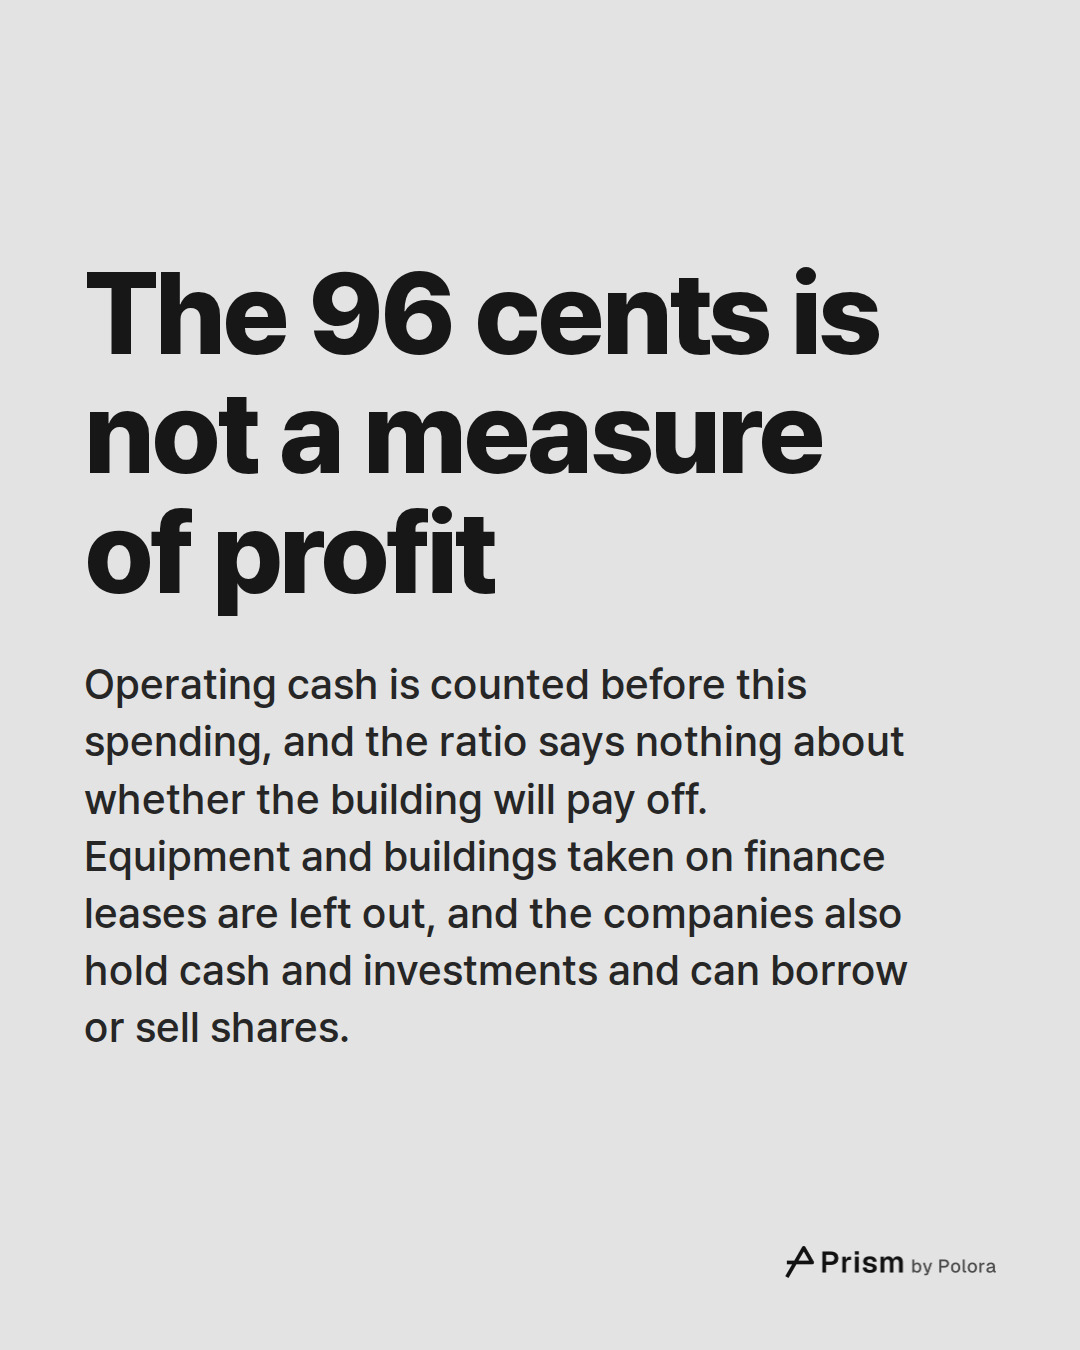
Operating cash is counted before this spending, so the ratio is not a measure of profit, and it says nothing about whether the building will pay off. Nor is it the companies' whole investment. Equipment and buildings taken on finance leases are left out, and all four report leases for data centres or servers. Alphabet and Meta also report data-centre leases they have signed that have not yet begun.
The companies define the spending in slightly different ways. The piece takes the same line for all four, the cash paid for property and equipment as each cash-flow statement shows it, but those lines are not identical. Amazon's is a gross figure. Amazon's own "cash capital expenditures" deduct proceeds from asset sales and incentives, which gives $53.1bn for April–June 2026 against $54.2bn gross. Meta's figure here is net of its proceeds relating to property and equipment, as its cash-flow statement now shows it. Meta's own headline "capital expenditures" also add principal payments on finance leases, which are not included here.
Operating cash is also not the only money the companies have. They hold cash and investments, and they can borrow or sell shares. Alphabet sold new shares and preferred stock in June 2026, and its filing says the money will be used "for general corporate purposes, including capital expenditures to scale AI infrastructure and global compute". Alphabet also sold bonds in the quarter, and Meta sold bonds in May 2026. Microsoft's annual report says it expects its cash, short-term investments, cash flows from operations and access to capital markets "to continue to be sufficient" to fund its operations and commitments, including "material capital expenditures". None of the filings quoted here says a share or bond sale was needed to pay for a particular quarter's building, and the figures here do not show that.
April–June 2026 is the latest quarter all four had reported when the figures were gathered, in late October 2026. Meta had already filed its July–September report; Microsoft, Alphabet and Amazon had not.
How the figures were made
Each company's figures come from the data the SEC publishes from its filings. Each figure was checked line by line against a second filed document : another quarterly or annual report printing the same period or, for the newest quarters, the company's earnings release. Meta changed how it showed proceeds relating to property and equipment between 2022 and early 2024, so its earlier figures were first put on the same net basis as its current ones. On that basis, the two sources gave the same figure every time.
- Microsoft, annual report (Form 10-K) for the year ended June 30, 2026
- Alphabet, quarterly report (Form 10-Q) for the quarter ended June 30, 2026
- Amazon, quarterly report (Form 10-Q) for the quarter ended June 30, 2026
- Amazon, second-quarter 2026 earnings release (Form 8-K, exhibit 99.1)
- Meta, quarterly report (Form 10-Q) for the quarter ended June 30, 2026
- SEC EDGAR, Microsoft's reported purchases of property and equipment, all filings
- SEC EDGAR, Microsoft's reported operating cash flow, all filings
- SEC EDGAR, Alphabet's reported purchases of property and equipment, all filings
![Sources 8 : sec.gov · Microsoft, annual report (Form 10-K) for the year ended June 30, 2026: [, sec.gov · Alphabet, quarterly report (Form 10-Q) for the quarter ended June 30, 2026: [, sec.gov · Amazon, quarterly report (Form 10-Q) for the quarter ended June 30, 2026: [ + 5](https://media.cdn.polora.ai/picks/2026/10/pickrun_377a762191bd412b/sn9KXEUxp2m1WiS_-slide-08--how-much-of-big.jpg)