Why has gold fallen almost 30% from its record despite war and high inflation?

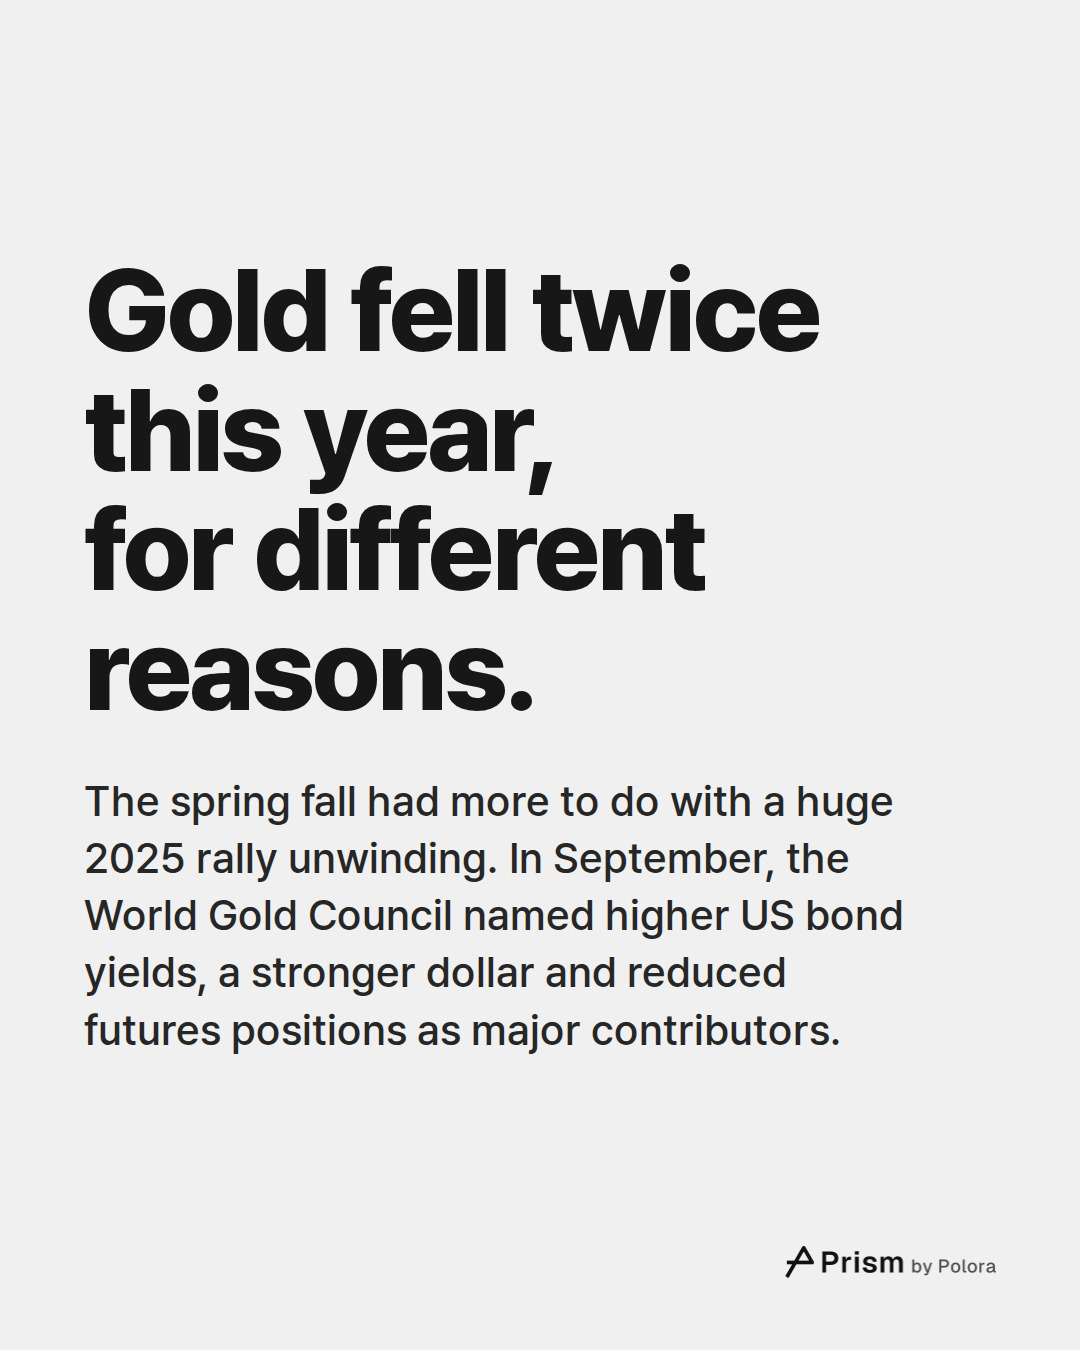
It fell in stages. Early in 2026, gold gave back part of a very fast 2025 rally. In September, higher US bond yields, a stronger dollar and futures selling pushed it down. Gold pays no interest, so it costs more to hold when safe bonds pay more. War and inflation do not guarantee that gold will rise.

2026-10-29

Gold is about 28% below its record in a year that seemed made for it

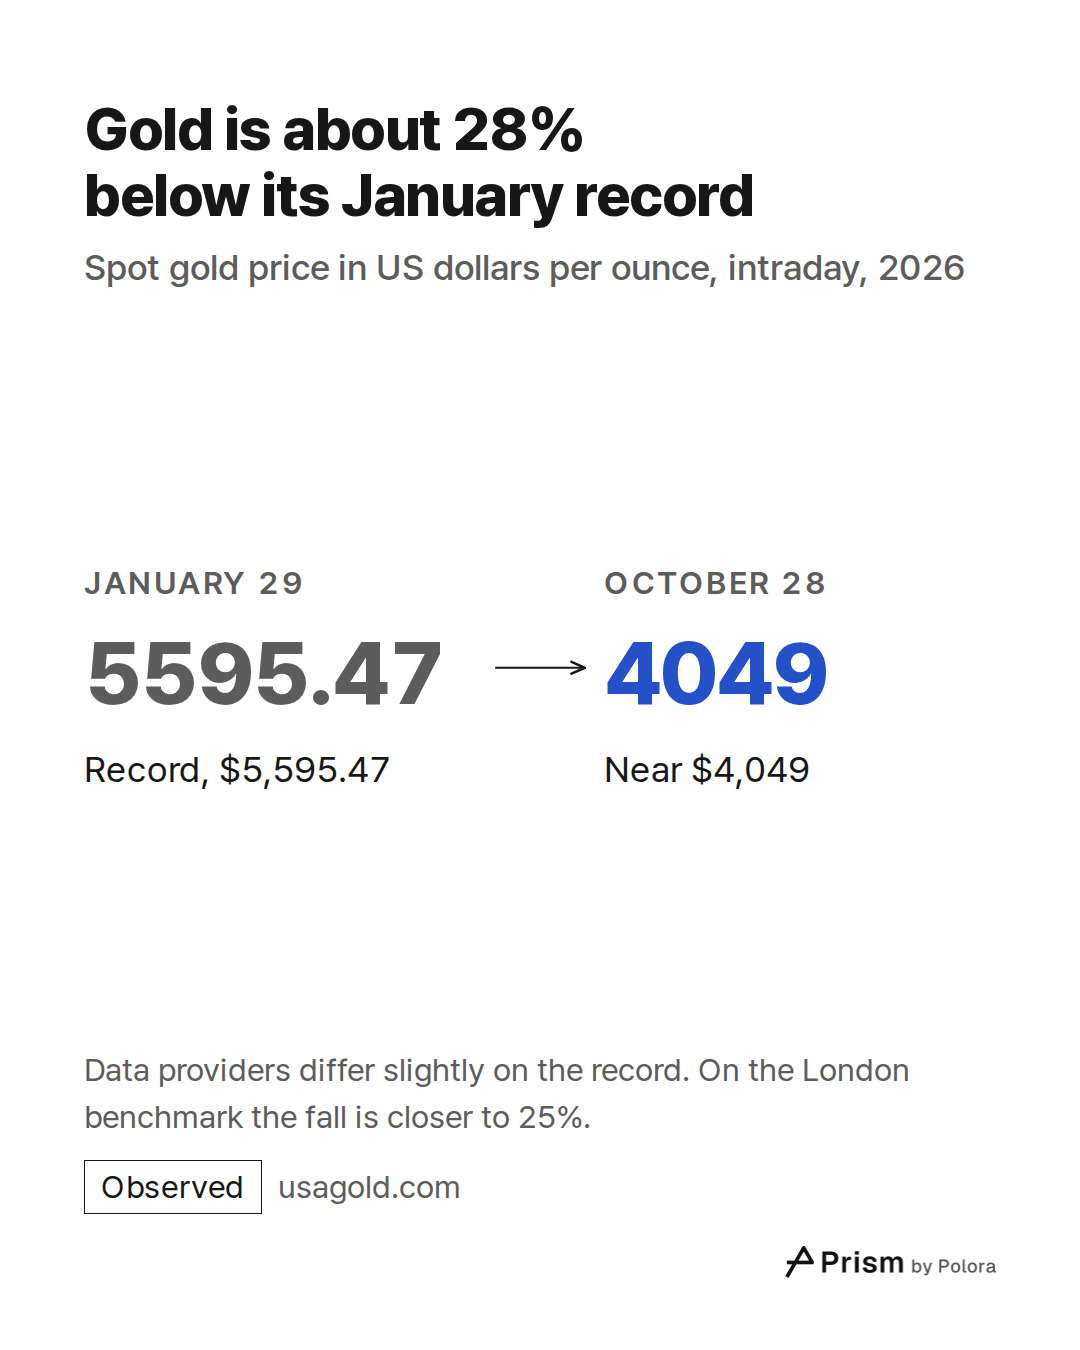
On January 29, 2026, gold traded as high as $5,595.47 an ounce. That is its record on the spot price, the price at which gold changes hands at any moment of the trading day, though data providers differ slightly on the exact figure. During trading on October 28 it stood near $4,049. That was about 28% below the record and about 6% lower than at the start of the year. Gold also has a benchmark price, set in London by auction twice a day. According to the World Gold Council (WGC), the gold industry's research body, that benchmark peaked at $5,405 on the same day. Measured on the benchmark, the fall is closer to 25%. The fall comes close to 30% only when the intraday spot record is compared with the intraday low of $3,986.50 on October 23, which was about 29% below the record.

This happened in the kind of year that the popular story says is good for gold. The United States and Israel struck Iran on February 28. According to a market commentary by the broker OANDA, the international oil benchmark, Brent, went from about $73.50 a barrel to about $120 in early March. US consumer prices rose 3.7% in the year to September. Both war and inflation were present, and gold fell anyway.

Part of the answer is how far gold had already risen. In 2025 it gained roughly two thirds, with the exact figure depending on the price series used, and that year is often described as its best since 1979. Some of this year's fall therefore gave back a very fast climb. The rest of the answer lies in what it costs to hold gold.
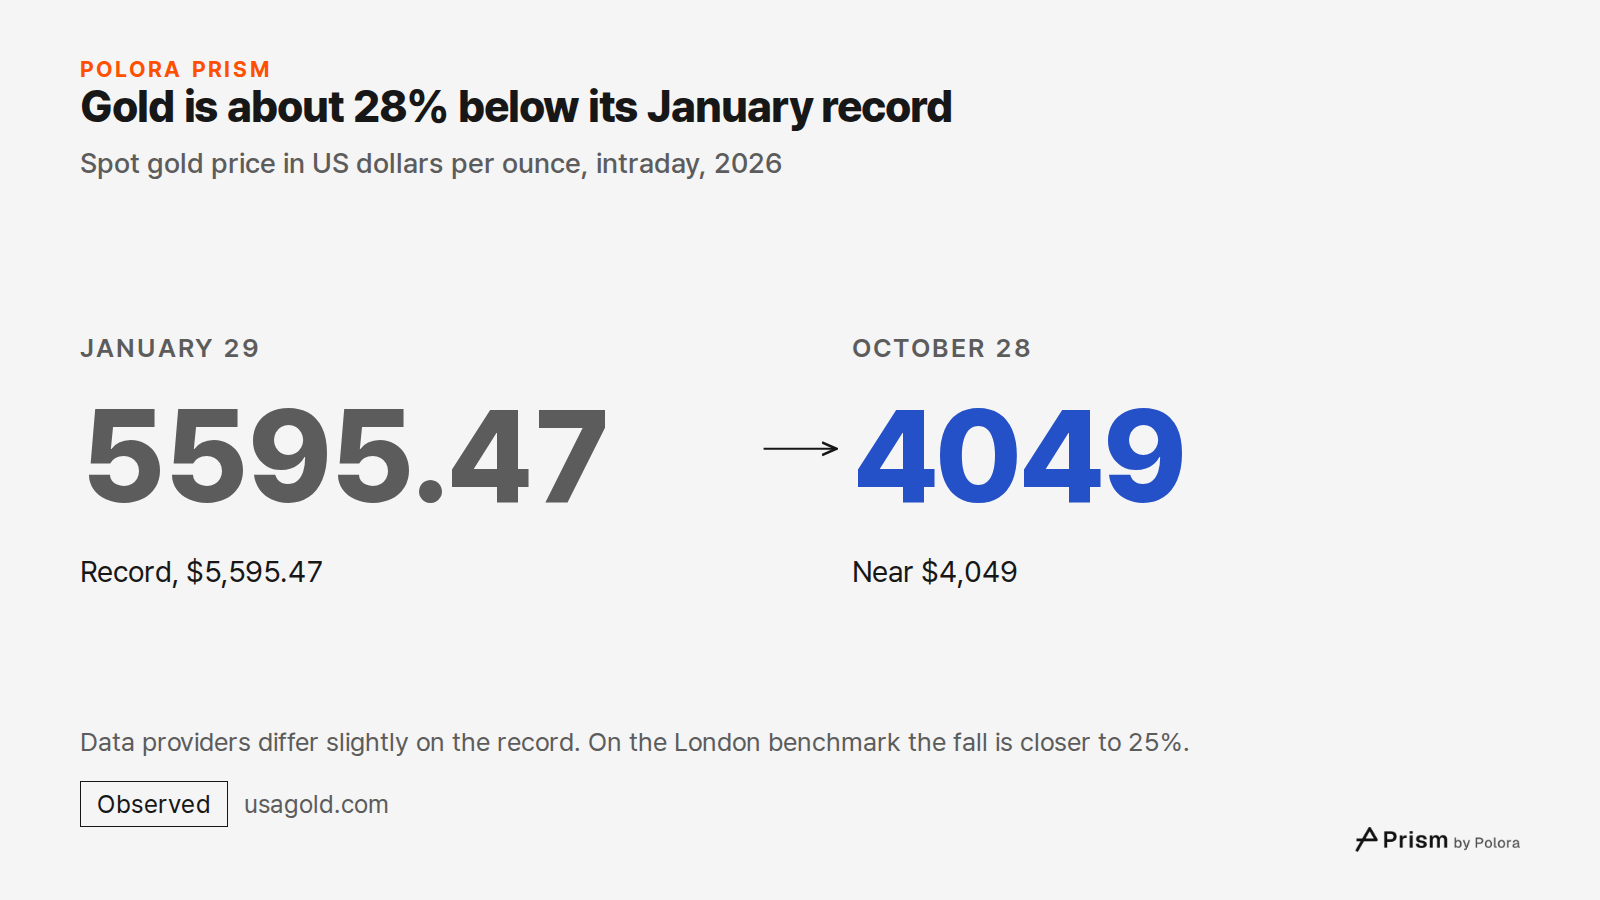
Gold is about 28% below its January record · Spot gold price in US dollars per ounce, intraday, 2026 · January 29 · 5595.47 · Record, $5,595.47 · October 28 · 4049 · Near $4,049 · Data providers differ slightly on the record. On the London benchmark the fall is closer to 25%.
Spot gold price in US dollars per ounce, intraday, 2026

Gold fell twice this year, for different reasons

The fall from the record was not one long slide. By June 24, spot gold had already touched $3,959.33, about 29% below the record. According to OANDA's commentary, gold fell in March, as the war began, while investors rushed into US dollars for cash. The WGC has a model that splits gold's returns by cause. For the first half of the year, it put 24% of the month-to-month variation in gold's price down to momentum, meaning investors following the trend and taking profits after 2025. It put 17% down to risk and uncertainty, 14% to currencies and only 3% to interest rates, whose effect it called mixed. It left 30% unexplained. These figures are shares of how much the price moved around, not shares of the fall.

Gold then climbed back to about $4,658 by August 25 on one official reference price, and fell again from September into October. These two falls need two explanations. Higher bond yields and a stronger dollar have the best-documented role in the second one, and that is the one this piece follows.
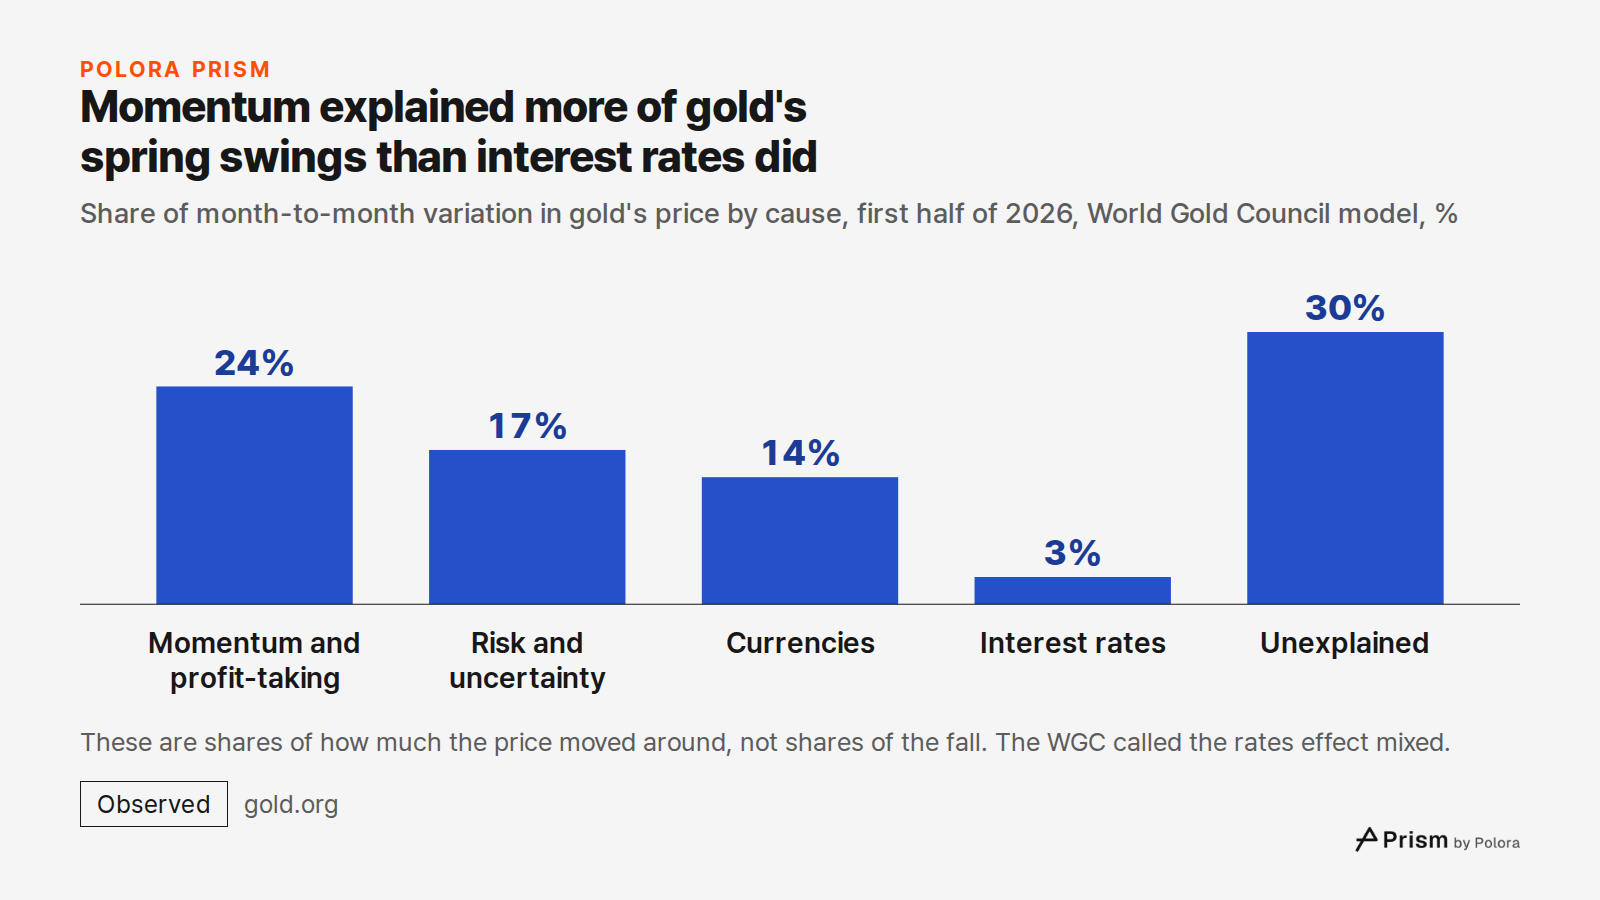
Momentum explained more of gold's spring swings than interest rates did · Share of month-to-month variation in gold's price by cause, first half of 2026, World Gold Council model, % · Momentum and profit-taking · Risk and uncertainty · Currencies · Interest rates · Unexplained · 24% · 17% · 14% · 3%
Share of month-to-month variation in gold's price by cause, first half of 2026, World Gold Council model, %

Holding gold costs you the interest you give up

Gold pays no interest and no dividend. Owning it means giving up what the same money would earn somewhere safe, such as a US government bond. What counts is not the rate printed on the bond but what it pays after inflation, which is called the real interest rate. If a bond pays 5% and prices rise 2% a year, the real return is about 3%.

Markets quote this rate directly. The US Treasury sells bonds whose value rises with inflation, known as TIPS, and their yield is the real return investors demand. When that yield goes up, so does the cost of holding gold instead.

Inflation was high, but bond markets priced in little more of it

US consumer prices rose 3.7% in the year to September, according to the Bureau of Labor Statistics. Much of that rise came from energy. Gasoline prices were up 34.2% and energy as a whole 20.4%. Excluding food and energy, prices rose 2.6%.

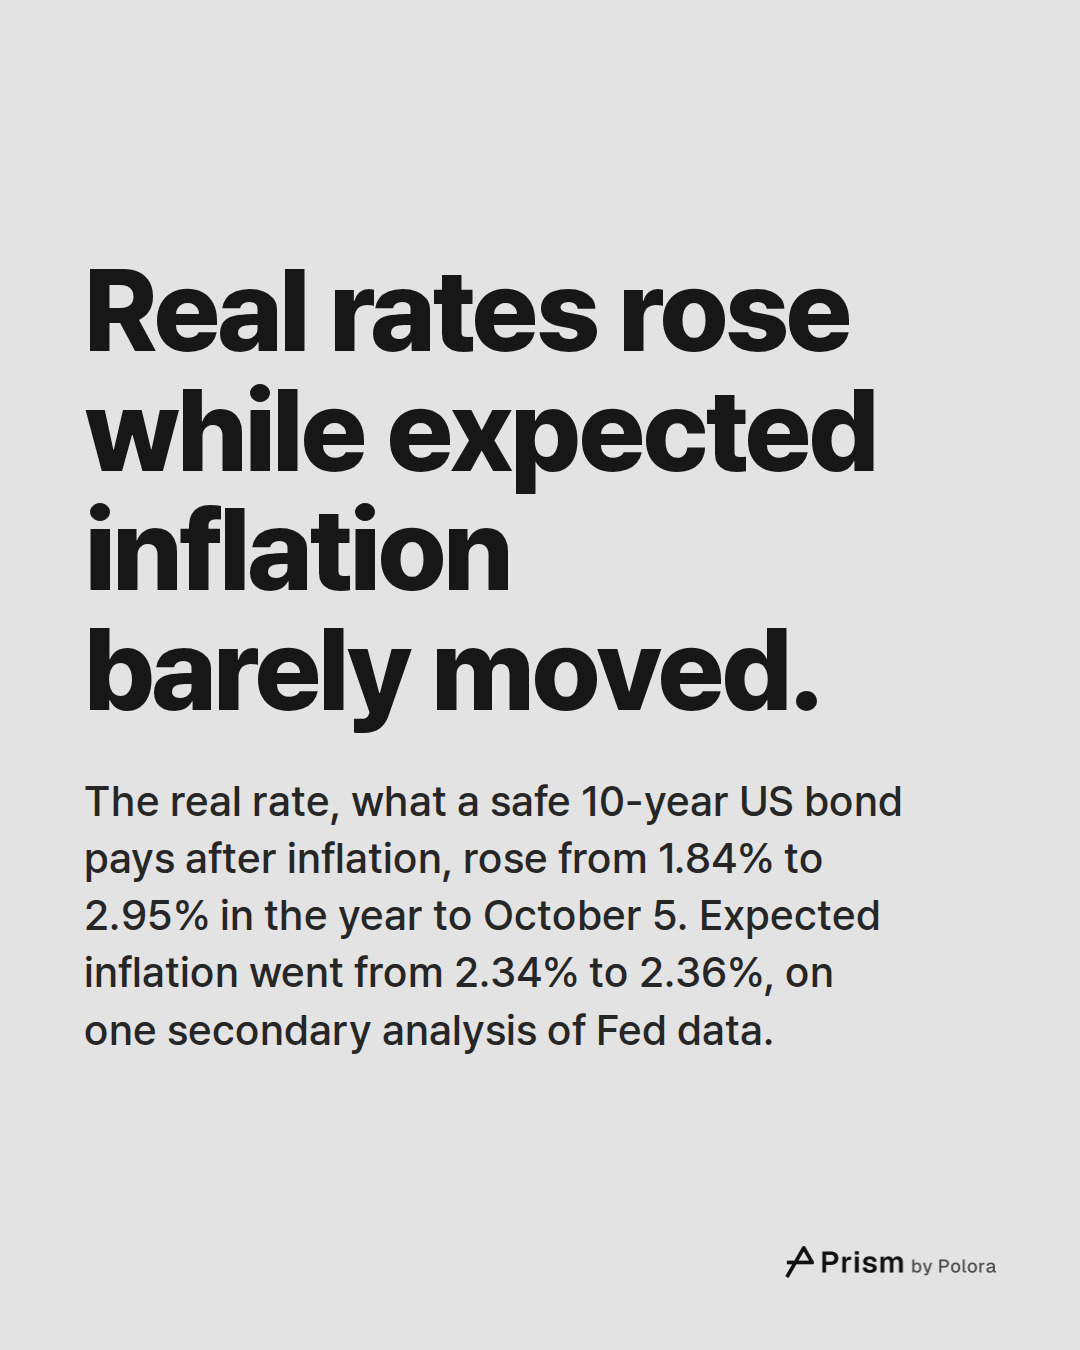
Bond markets did not price in much more inflation ahead. One measure of the inflation investors expect is the gap between the yields on ordinary and inflation-linked 10-year Treasuries. According to one analysis of Federal Reserve data, that gap was 2.36% on October 5, almost the same as the 2.34% of a year earlier. The ordinary 10-year Treasury yield itself was 5.31%. The real rate reached 2.95% on October 5, its highest close since November 2008, up from 1.84% a year before. On those figures, with expected inflation almost unchanged, nearly all of the rise in yields was a rise in the real rate. These daily figures come from a secondary analysis, and they were not confirmed against the official daily series when this piece was checked. A single reading of the gap also does not show how long investors expected inflation to last.

On the same figures, the real rate rose from 2.55% to 2.95% between September 10 and October 5. Over the same weeks, an official reference price for gold fell from $4,407 to $4,183, about 5%. In this stretch, high inflation came with a higher return on safe bonds, and so with a higher cost of holding gold, while gold fell. The timing fits that explanation, but on its own it does not prove it.
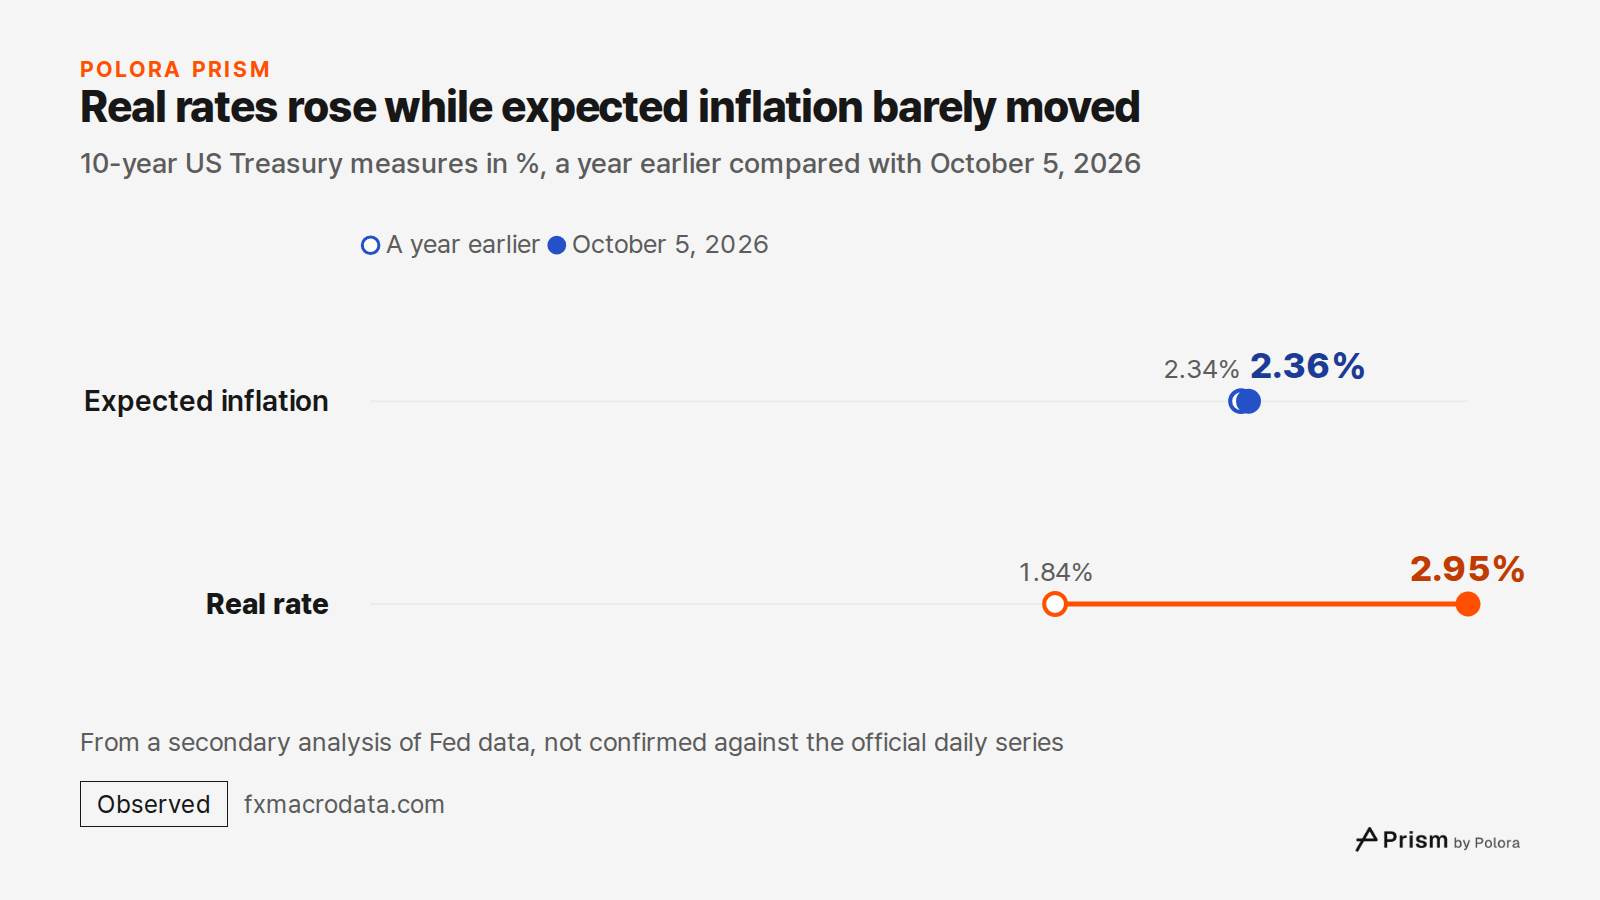
Real rates rose while expected inflation barely moved · 10-year US Treasury measures in %, a year earlier compared with October 5, 2026 · A year earlier · October 5, 2026 · Expected inflation · Real rate · 2.34% · 1.84% · 2.36% · 2.95% · From a secondary analysis of Fed data, not confirmed against t
10-year US Treasury measures in %, a year earlier compared with October 5, 2026

The Fed raised rates and the dollar rose

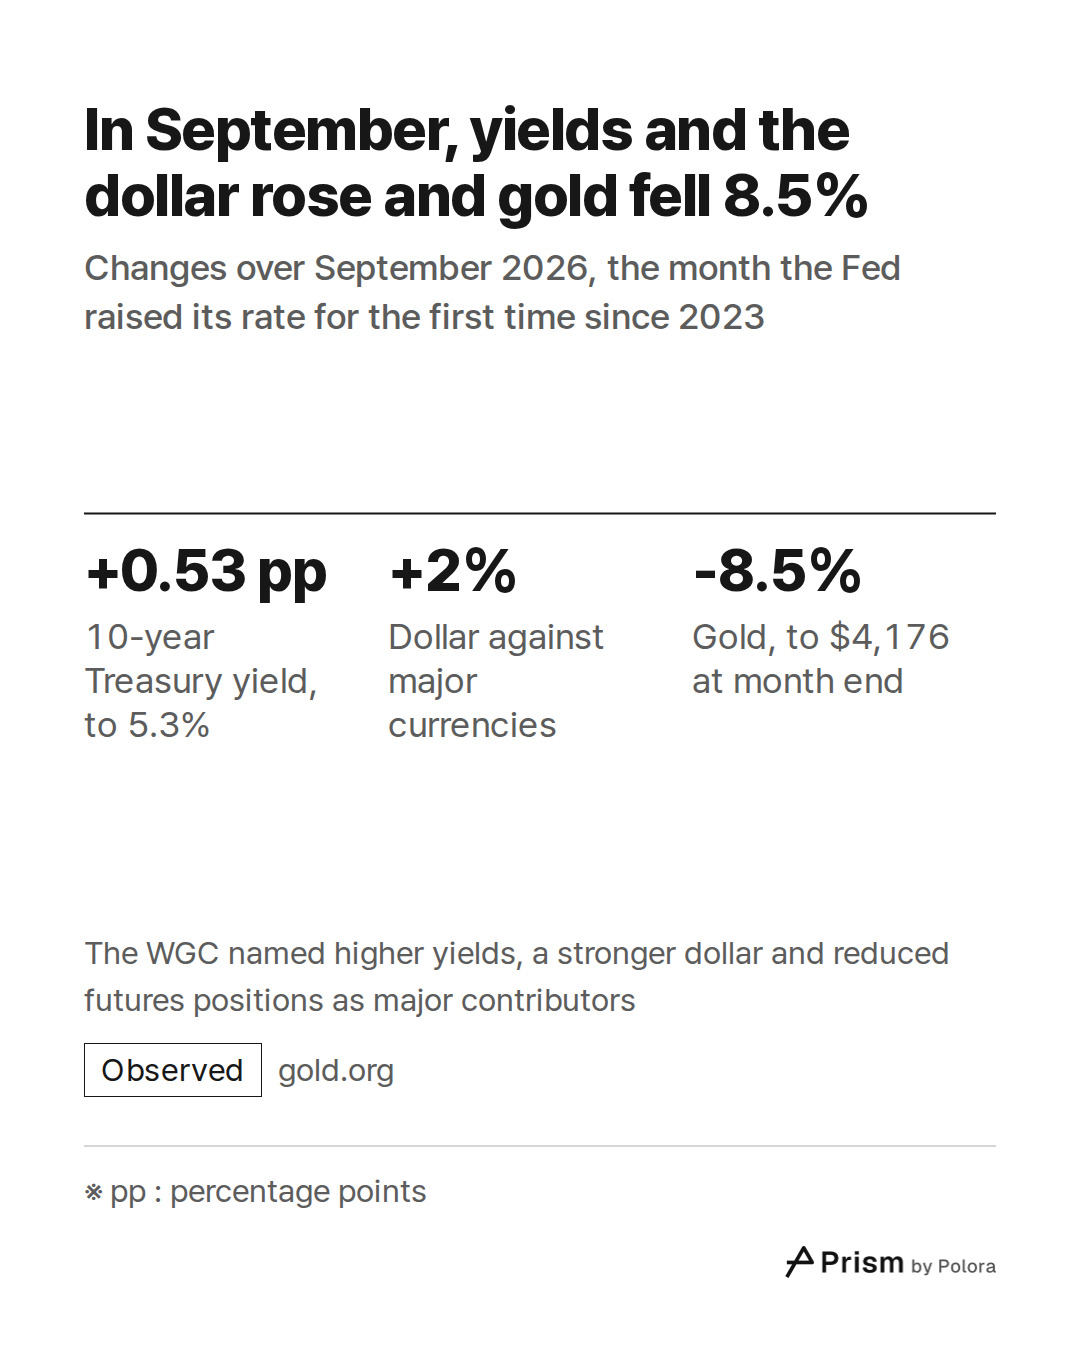
On September 16 the Federal Reserve, the US central bank, voted 12 to 0 to raise its policy rate by a quarter point to a range of 3.75% to 4%. It was the Fed's first increase since 2023. According to the WGC, the 10-year Treasury yield rose 0.53 percentage points in September to 5.3%, and an index of the dollar against major currencies rose 2%. Gold ended the month at $4,176, down 8.5%. The WGC named higher Treasury yields, the stronger dollar and reduced futures positions as major contributors to that fall.

The dollar matters because gold is priced in dollars. When the dollar rises, gold costs more for buyers paying in other currencies. The Fed met again on October 27 and 28, and markets largely expected it to leave rates unchanged. Its decision was due after this piece was written.
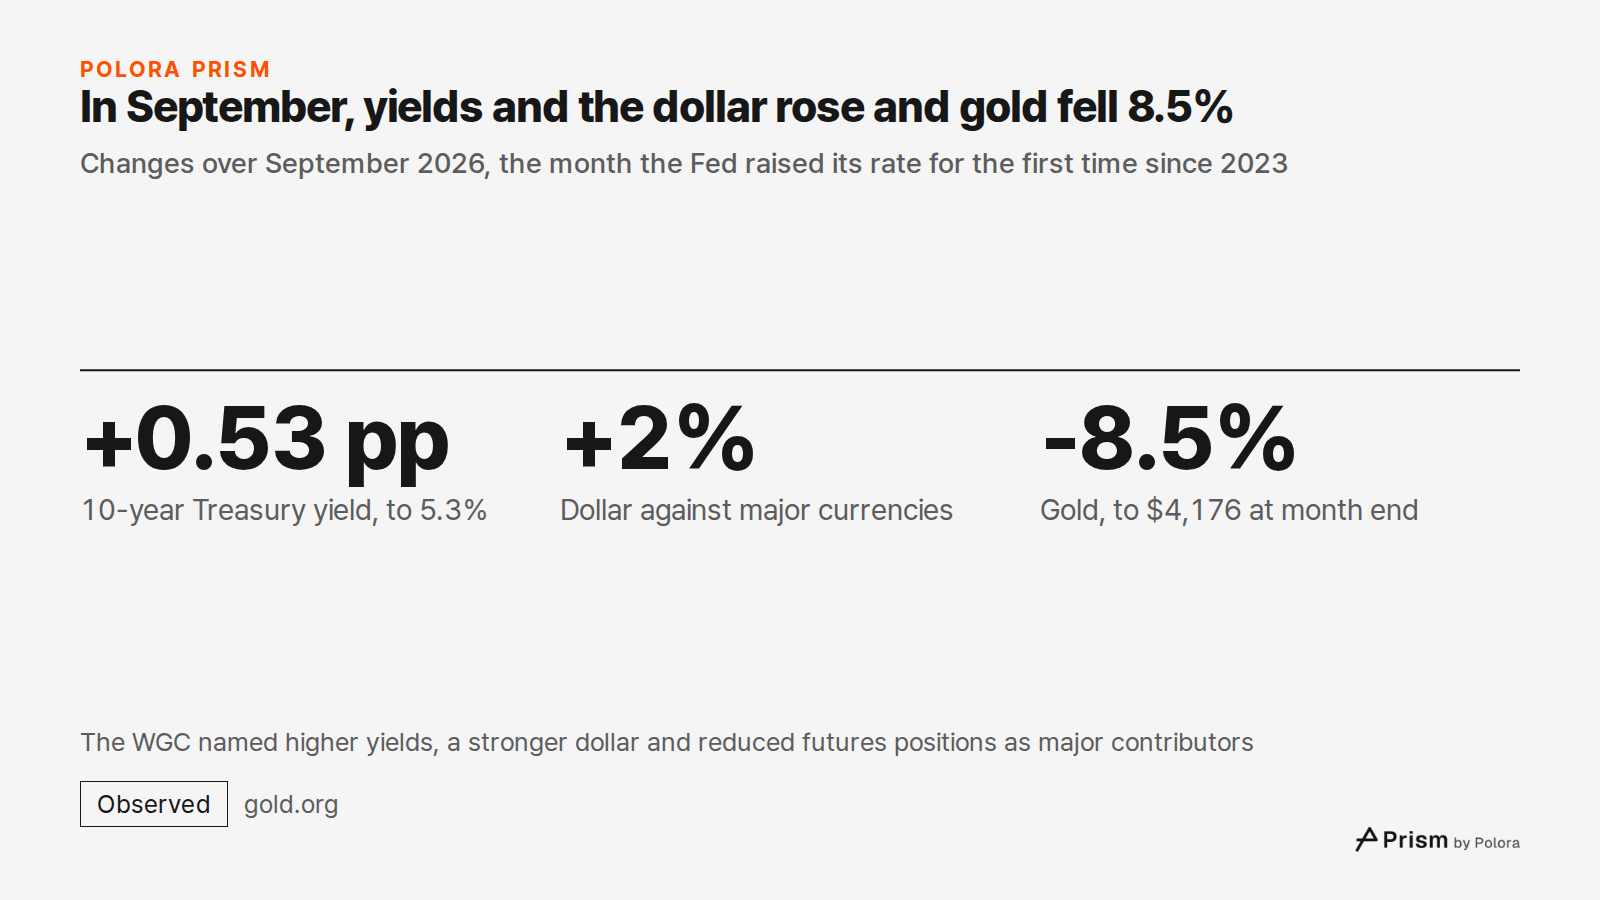
In September, yields and the dollar rose and gold fell 8.5% · Changes over September 2026, the month the Fed raised its rate for the first time since 2023 · +0.53 pp · +2% · -8.5% · 10-year Treasury yield, to 5.3% · Dollar against major currencies · Gold, to $4,176 at month end · The WGC named highe
Changes over September 2026, the month the Fed raised its rate for the first time since 2023

Central banks bought a second-quarter record, and the price fell anyway

Central banks bought a net 289 tonnes of gold in the second quarter, the most for any second quarter in WGC records. That figure is easy to over-read. The WGC's revised figure for the first quarter is only 57 tonnes, so central banks bought 345 tonnes in the first half, the lowest first-half total since 2022.

Gold funds traded on stock exchanges, known as ETFs, sold a net 45 tonnes in the second quarter. The WGC linked those outflows, particularly in North America, to higher expected inflation and interest rates and to a stronger dollar.

In the third quarter the funds turned around, yet the price still fell. According to figures reported by Kitco, investors put a record $31 billion into gold ETFs. In September, however, traders in gold futures cut their bets on a rising price by about $12 billion, or 84 tonnes. Futures are contracts often bought with borrowed money. Different buyers respond to different things. Central banks follow long-term reserve plans, while futures traders tend to respond to the cost of money week by week. These flows show buyers pulling in opposite directions. On their own, they do not show which group moved the price.
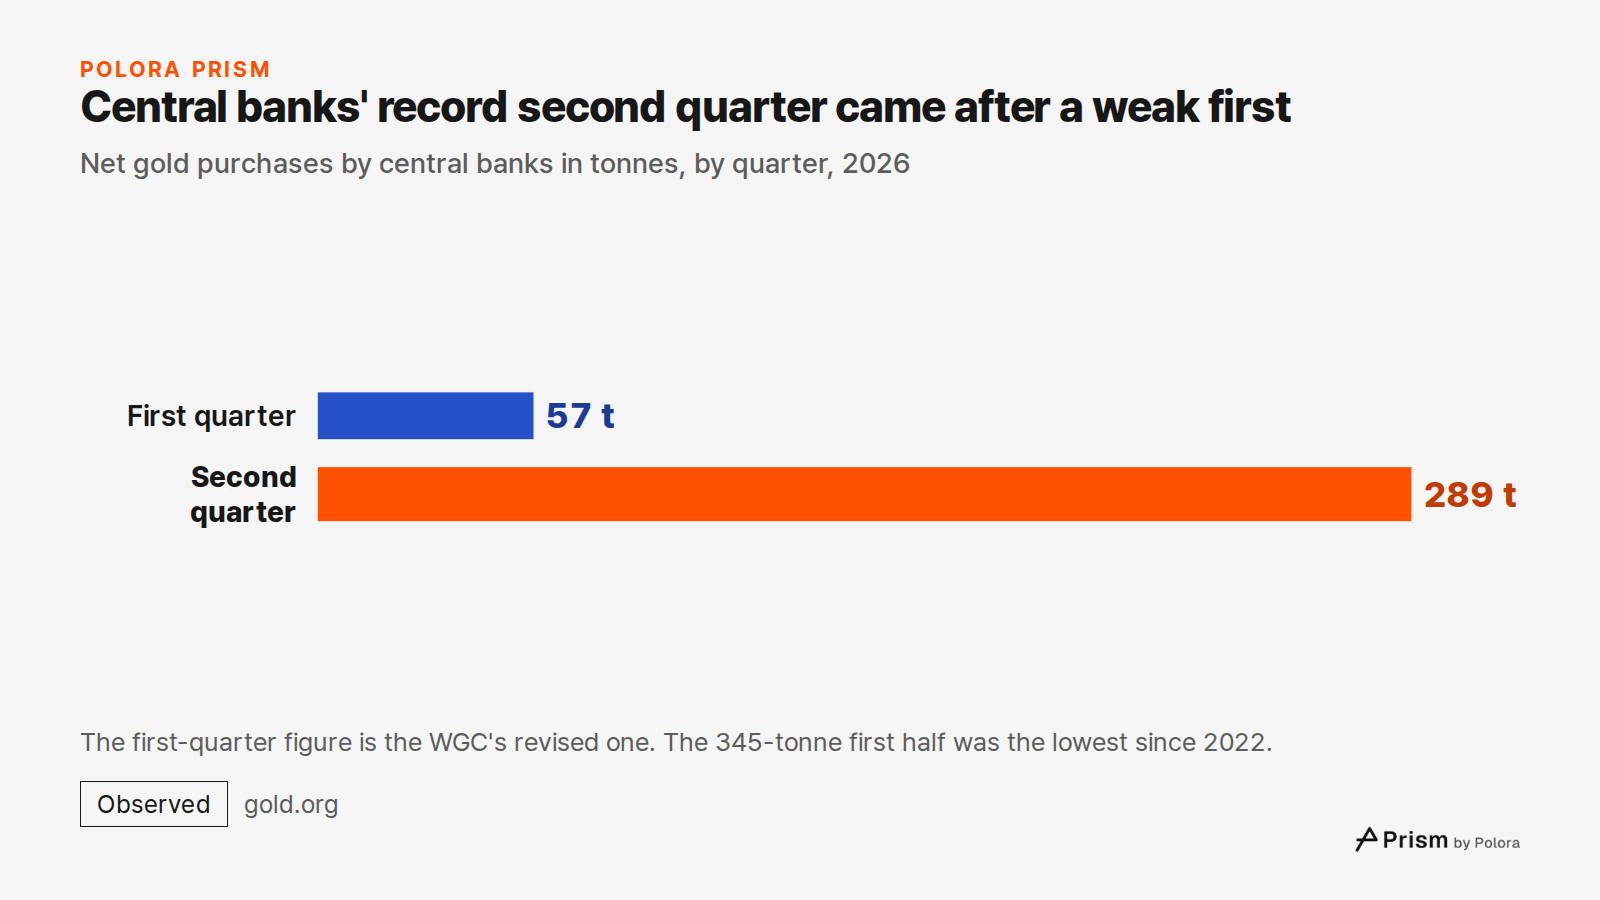
Central banks' record second quarter came after a weak first · Net gold purchases by central banks in tonnes, by quarter, 2026 · First quarter · Second quarter · 57 t · 289 t · The first-quarter figure is the WGC's revised one. The 345-tonne first half was the lowest since 2022.
Net gold purchases by central banks in tonnes, by quarter, 2026

Reports disagree on why gold fell on October 23

Gold fell below $4,000 for the first time since July, to a reported low of $3,986.50 on October 23. Accounts of why differ. A Reuters report carried by Kitco linked the drop to rising oil prices, which fed worries about inflation and strengthened expectations of another Fed rate increase. The Associated Press reported Brent at $116.72 a barrel and the 10-year Treasury yield at 4.99% that day.

One market analysis site, TradingKey, gave a different explanation. Technology shares, silver and copper were sold off at the same time as gold. TradingKey said investors were selling whatever was easiest to sell in order to cut positions held with borrowed money. For comparison, the 10-year real yield stood at 2.64% on October 22, below its early October peak. The reports available do not settle which explanation mattered more.

When investors rush for cash, an asset known as a safe haven can be sold like anything else, precisely because it is easy to sell. Whether that is what happened on October 23 remains open.
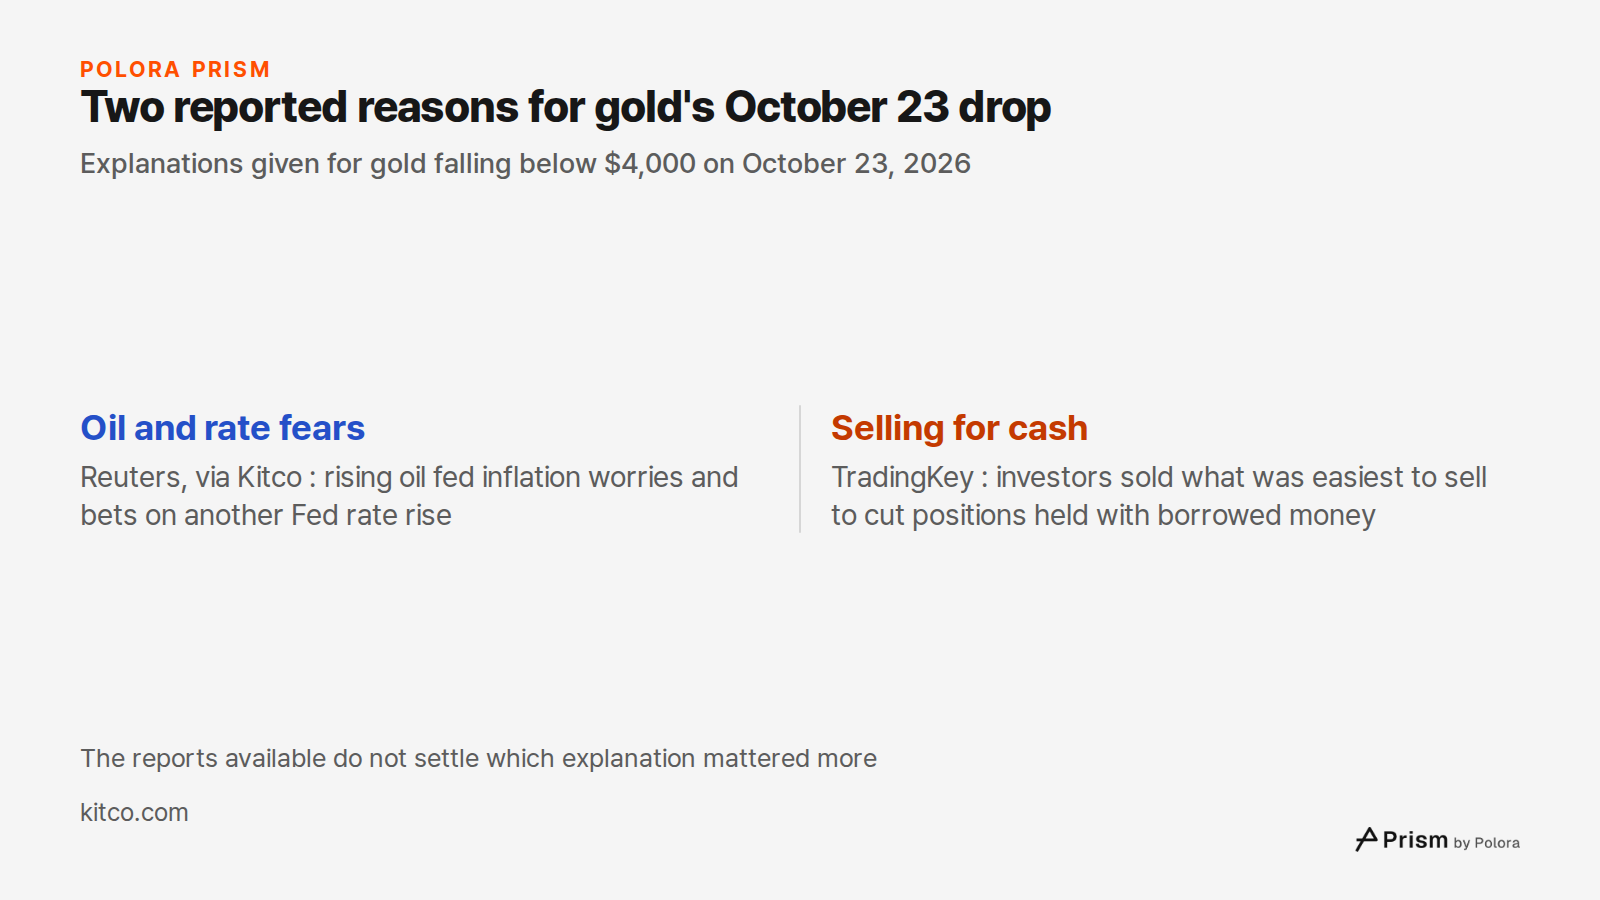
Two reported reasons for gold's October 23 drop · Explanations given for gold falling below $4,000 on October 23, 2026 · Oil and rate fears · Selling for cash · Reuters, via Kitco : rising oil fed inflation worries and bets on another Fed rate rise · TradingKey : investors sold what was easiest to s
Explanations given for gold falling below $4,000 on October 23, 2026

The link to real rates is a pattern, not a law

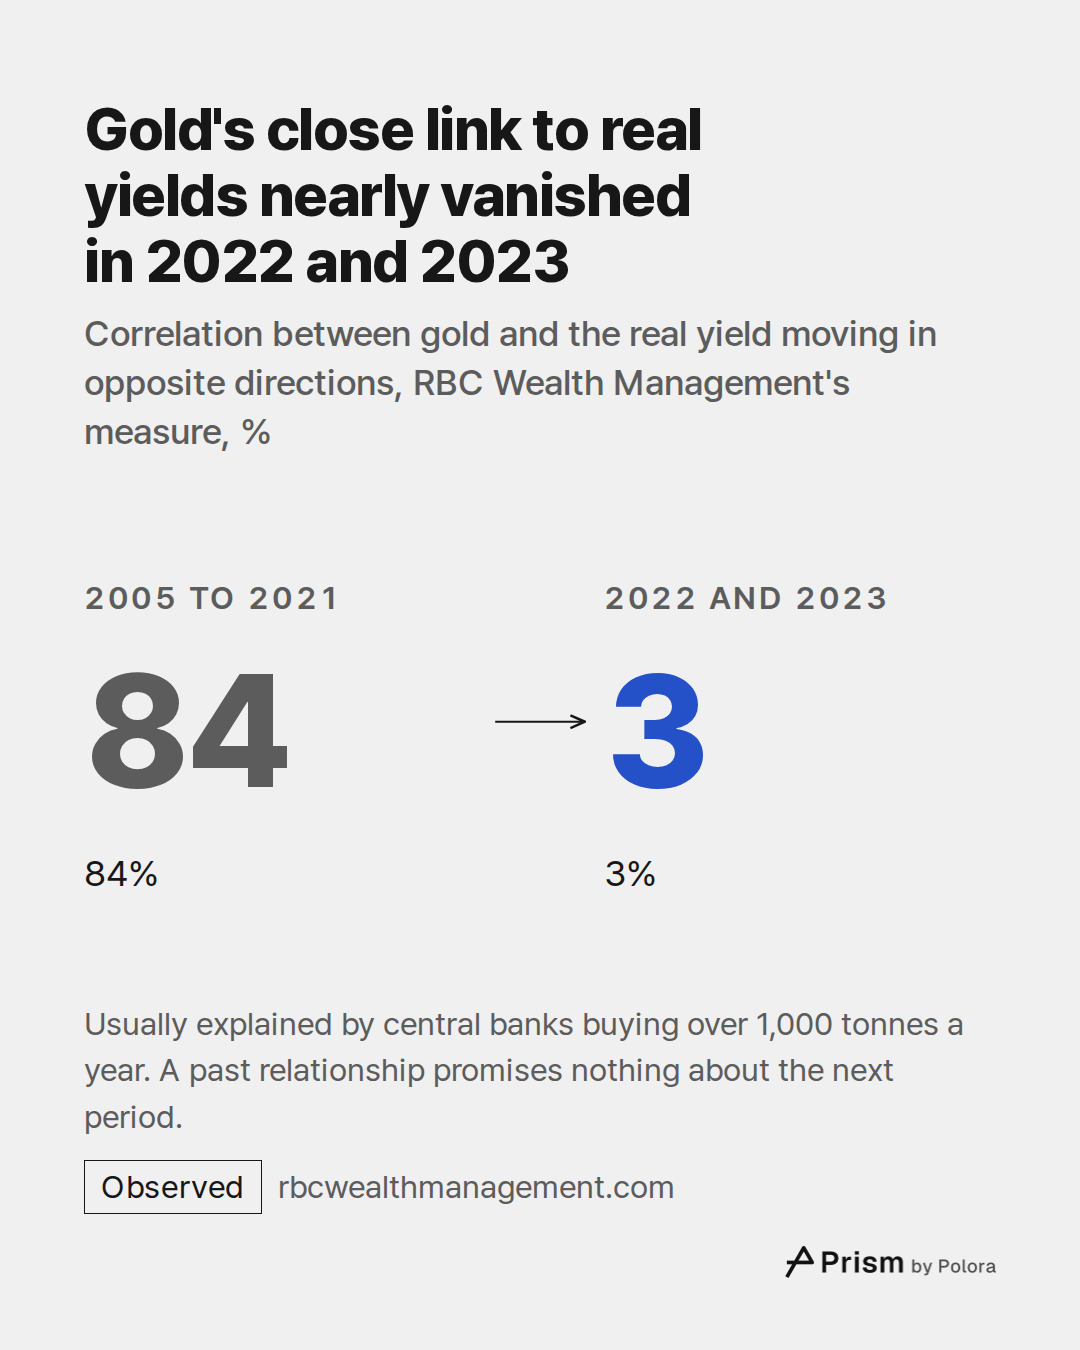
From 2005 to 2021, gold and the real yield moved closely in opposite directions, with a correlation of 84% on RBC Wealth Management's measure. In 2022 and 2023 that figure fell to 3%. Real rates rose sharply, yet gold held up and went on to new records. The usual explanation is that central banks were buying more than 1,000 tonnes a year for reasons that have nothing to do with interest rates.

The asset manager Janus Henderson reads this as the floor moving. In its reading, central bank buying raised the level at which gold trades, while real rates still drive much of its short-term direction. This year fits that reading in the autumn and fits it less well in the spring. A relationship seen over one period promises nothing about the next.
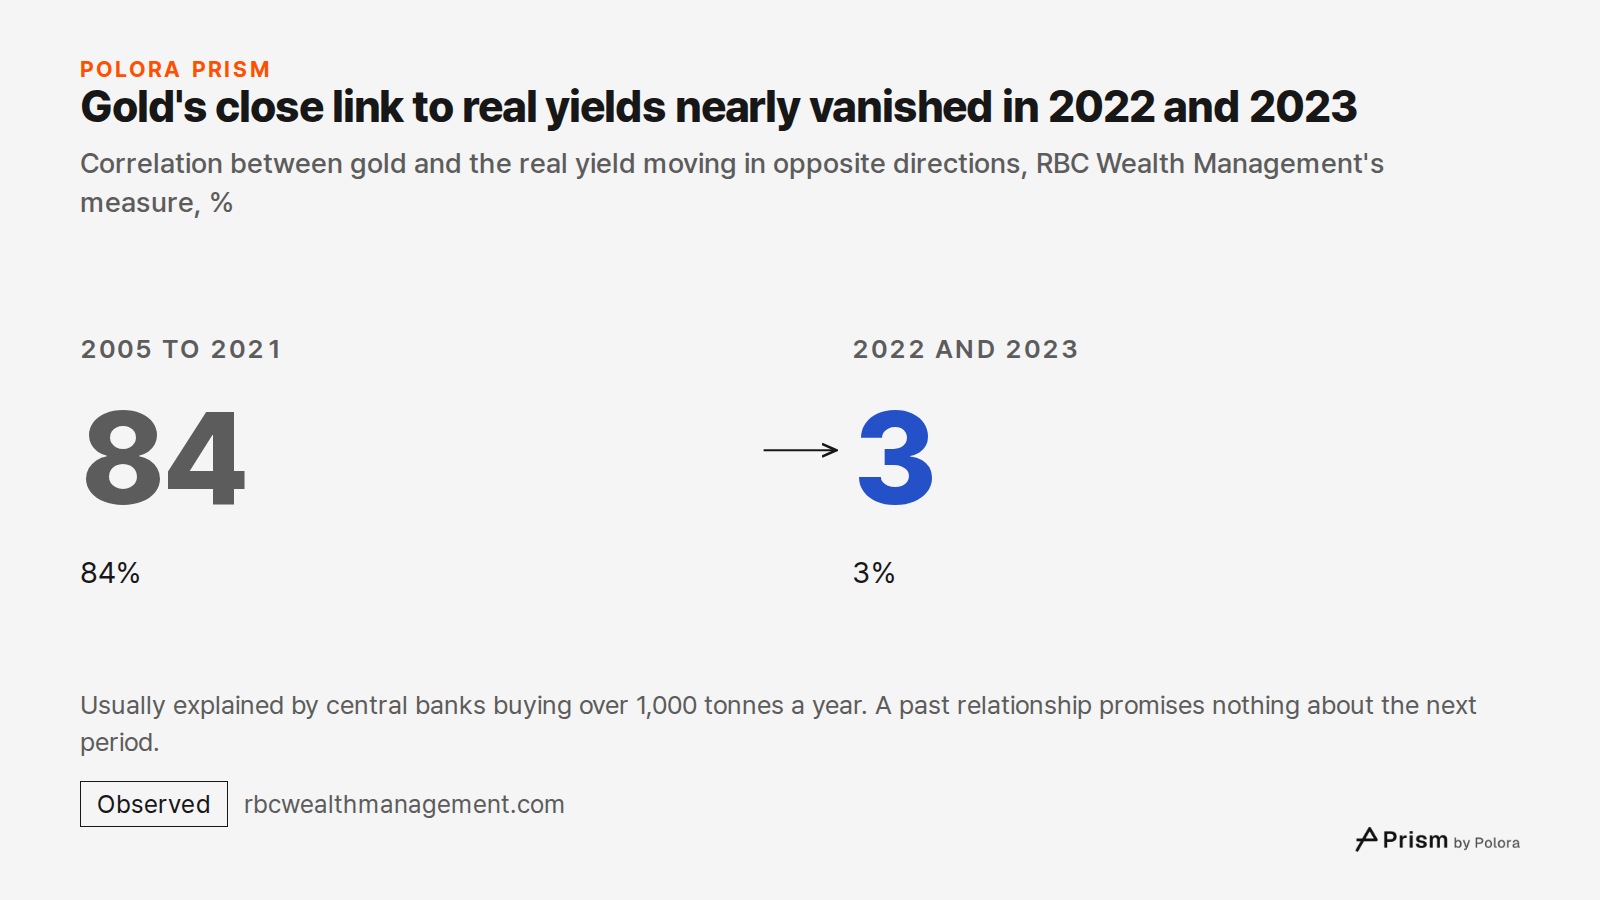
Gold's close link to real yields nearly vanished in 2022 and 2023 · Correlation between gold and the real yield moving in opposite directions, RBC Wealth Management's measure, % · 2005 to 2021 · 84 · 84% · 2022 and 2023 · 3 · 3% · Usually explained by central banks buying over 1,000 tonnes a year. A
Correlation between gold and the real yield moving in opposite directions, RBC Wealth Management's measure, %

Gold competes with what safe money pays

War and inflation do not guarantee a rising gold price. Gold also competes with what safe money pays after inflation. This year inflation rose, but the bond market's inflation gauge barely moved. On the figures above, bond yields rose mostly in real terms, the Fed added a rate increase, and the cost of holding a metal that pays nothing went up. That fits the September fall better than the war does.

It does not explain everything. The spring fall had more to do with a huge rally unwinding, and the October 23 drop has competing explanations. Nothing in these numbers says which way any of them will move next.
Why has gold fallen almost 30% from its record despite war and high inflation?Why has gold fallen almost 30% from its record despite war and high inflation?War and inflation do not guarantee a rising gold price. · Gold pays no interest, so it costs more to hold when safe bonds pay more.January 29 · 5595.47 · Record, $5,595.47 · October 28 · 4049 · Near $4,049 · Gold is about 28% below its January record · Spot gold price in US dollars per ounce, intraday, 2026 · Data providers differ slightly on the record. On the London benchmark the fall is closer to 25%.Gold fell twice this year, for different reasons. · The spring fall had more to do with a huge 2025 rally unwinding. In September, the World Gold Council named higher US bond yields, a stronger dollar and reduced futures positions as major contributors.Real rates rose while expected inflation barely moved. · The real rate, what a safe 10-year US bond pays after inflation, rose from 1.84% to 2.95% in the year to October 5. Expected inflation went from 2.34% to 2.36%, on one secondary analysis of Fed data.※ pp : percentage points · +0.53 pp · +2% · -8.5% · 10-year Treasury yield, to 5.3% · Dollar against major currencies · Gold, to $4,176 at month end · In September, yields and the dollar rose and gold fell 8.5% · Changes over September 2026, the month the Fed raised its rate for the first time since2005 to 2021 · 84 · 84% · 2022 and 2023 · 3 · 3% · Gold's close link to real yields nearly vanished in 2022 and 2023 · Correlation between gold and the real yield moving in opposite directions, RBC Wealth Management's measure, % · Usually explained by central banks buying over 1,000 tonnes a year. ASources 16 : gold.org · World Gold Council, Gold Mid-Year Outlook 2026, usagold.com · USAGold, Daily precious metals market report, October 28, 2026, oanda.com · OANDA, 2026 Iran conflict : impact on oil, gold, bitcoin and forex + 13Read the full story at · polora.ai

Why has gold fallen almost 30% from its record despite war and high inflation?

Alpha · deepseek-v4-pro

The short answer: gold did not fall *despite* war and inflation — it fell largely because the war and the inflation prints translated into a higher return on safe dollars and a stronger dollar, which is exactly what makes a non-yielding metal expensive to hold. The fall is real, but it matters which measure is used. Spot gold peaked around $5,595 on January 29, hit a low near $3,986 on October 23 — about 29% below the record — and sits around $4,049 on October 28, still roughly 28% below. The London benchmark peak was lower, around $5,405, so on that measure the drop is closer to 25%. This was not one long slide; gold fell into mid-June, recovered into late August, then fell again from September. The core mechanism is opportunity cost. Gold pays no interest or dividend, so it competes with safe assets that do. What matters is the *real* return after expected inflation. The 10-year TIPS yield rose from about 1.84% a year earlier to 2.95% by early October — its highest close since 2008. The nominal 10-year Treasury yield reached 5.31%, while the market’s expected inflation measure stayed almost unchanged at about 2.36%. That means the rise in yields was overwhelmingly a rise in *re…

Beta · gpt-6-sol

Beta: I agree that higher yields and a stronger dollar help explain September’s decline. I would not make them the main explanation for the *entire* fall from January’s peak. The World Gold Council’s first-half model assigns 24% of gold’s monthly price variability to momentum, 17% to risk and uncertainty, 14% to foreign exchange, and just 3% to rates; it leaves 30% unexplained. Those are contributions to *variability*, not percentages of the price drop. By contrast, its September analysis explicitly identifies rising Treasury yields, a stronger dollar and reduced futures positions as major contributors to that month’s 8.5% decline. (gold.org) That distinction matters to the reader’s “almost 30%.” The WGC records a $5,405 London PM benchmark high on January 29, while describing an intraday price above $5,500; those are different measures. The manuscript’s roughly 29% figure compares a reported intraday high with the reported October 23 intraday low, not two London benchmark prices. I could not independently verify its precise October 23 low or October 28 spot quote from a primary p…

Gamma · gemini-3.1-pro

Gamma: I have verified the remaining key data points from the manuscript, and they strongly support the economic mechanism described, even if the "almost 30%" figure relies on a specific intraday-to-intraday comparison as Beta noted. First, the manuscript's claims regarding the bond market's pricing of inflation and real yields are accurate. I checked the Federal Reserve Economic Data (FRED) series for October 5, 2026. The 10-year nominal Treasury yield (DGS10) did indeed close at 5.31%, with the 10-year TIPS real yield (DFII10) at 2.95%—its highest level since late 2008. The implied breakeven inflation rate was roughly 2.36%. This confirms the manuscript's argument: the spike in yields was almost entirely driven by real rates rising, not by long-term inflation fears. The market did indeed expect the inflation spike to pass. (richmondquant.com / FRED data) Second, the manuscript's claim about the historical correlation between gold and real yields breaking down is also correct. RBC Wealth Management's measure puts the statistical correlation between gold and the 10-year TIPS yield at roughly 84% for the…

Researcher · gpt-6-luna

Researcher — verification notes The strongest primary evidence retrieved supports a multi-cause, multi-episode explanation, not the claim that real yields explain the entire decline. - The WGC’s first-half model supports the distinction between the spring and autumn. It attributes 24% of first-half price variability to momentum, 17% to risk and uncertainty, 14% to foreign exchange and 3% to rates; 30% is outside the model. These are contributions to *variability*, not shares of the total price fall. Its September commentary separately says higher Treasury yields and a stronger dollar were major contributors to that month’s decline. Sources: https://www.gold.org/goldhub/research/gold-mid-year-outlook-2026 ; https://www.gold.org/goldhub/research/gold-market-commentary-september-2026 (gold.org) - The near-30% figure depends on comparing intraday extremes. The WGC gives a January 29 London PM benchmark high of $5,405, while distinguishing it from an intraday price above $5,500. I did not find a reliable primary price-feed source in this search that verifies the manuscript’s exac…

The Arbiter · gpt-6-sol

The voices agree on the basic mechanism: gold pays no interest, so higher inflation-adjusted bond yields can make it less attractive. The Fed’s September 16 rate increase is confirmed by its own statement. But they differ on how much of the nearly 30% decline that mechanism explains. (federalreserve.gov) Beta and the Researcher make an important distinction for the manuscript: the World Gold Council describes mixed interest-rate effects in the first half of 2026, when momentum also mattered. Its model assigns rates 3% of *first-half price variability*—not 3% of the total price fall. That limits Alpha’s claim that rising real yields were the main explanation throughout the year, without negating the stronger yield-and-dollar account offered for September. (gold.org) Three checks still affect what can safely be published: - “Almost 30%” needs a named price measure. The WGC distinguishes its $5,405 January 29 London benchmark high from an intraday…

The Arbiter's Final Verdict · gpt-6-sol

Verdict The manuscript’s central premise stands, but its lead explanation is too broad. War and high inflation do not guarantee a higher gold price. A rise in the return on safe bonds can weigh on gold, which pays no interest; a stronger dollar can add pressure. The evidence checked here supports those forces particularly for September 2026, not as a demonstrated explanation for the entire fall from January’s record. “Almost 30%” is a reported intraday-peak-to-intraday-low comparison, not the fall from the record to the October 28 price or a fall measured consistently with London benchmark prices. The exact spot extremes and October 28 quote were not verified against one primary feed here. The World Gold Council (WGC) mid-year outlook does confirm a different measure: its London PM benchmark high was $5,405 on January 29. What the checks support—and what needs changing | Manuscript claim | Finding | |---|---| | The first-half decline was largely an unwinding of a rapid rally. | The WGC’s first-half model gives momentu…