What is being measured
Every percentage here is a share of all the electricity generated in the United States in a calendar year, by source, as compiled by the energy think tank Ember and published by Our World in Data. Because each source is a slice of the same yearly total, the slices can be compared directly, and they add up to 100% every year, give or take rounding.
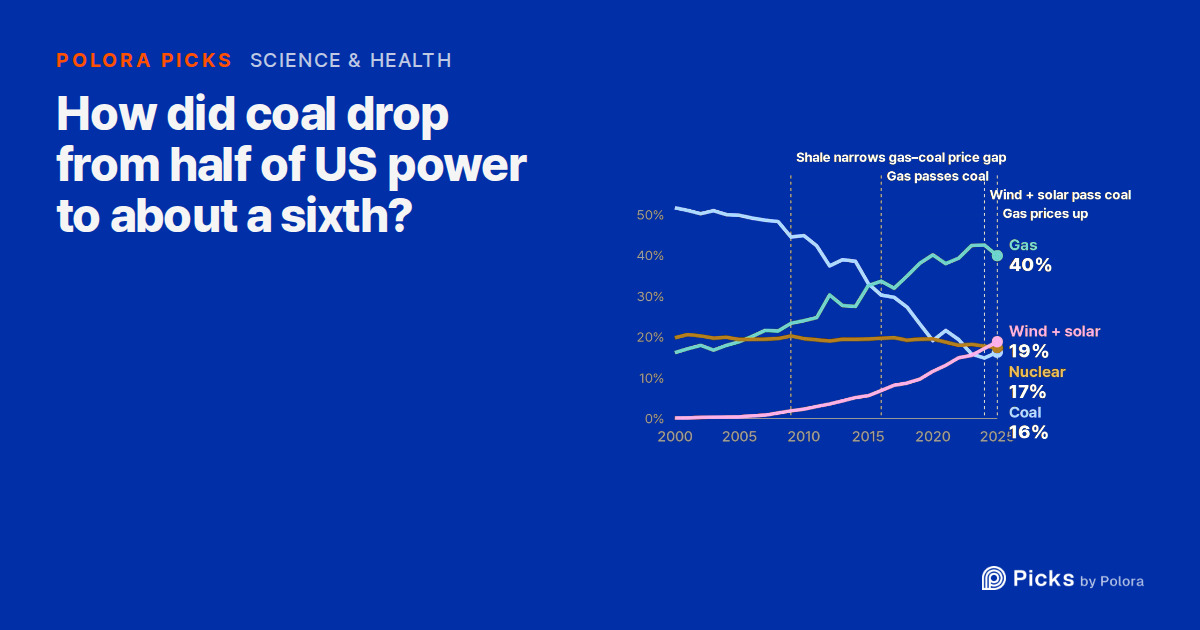
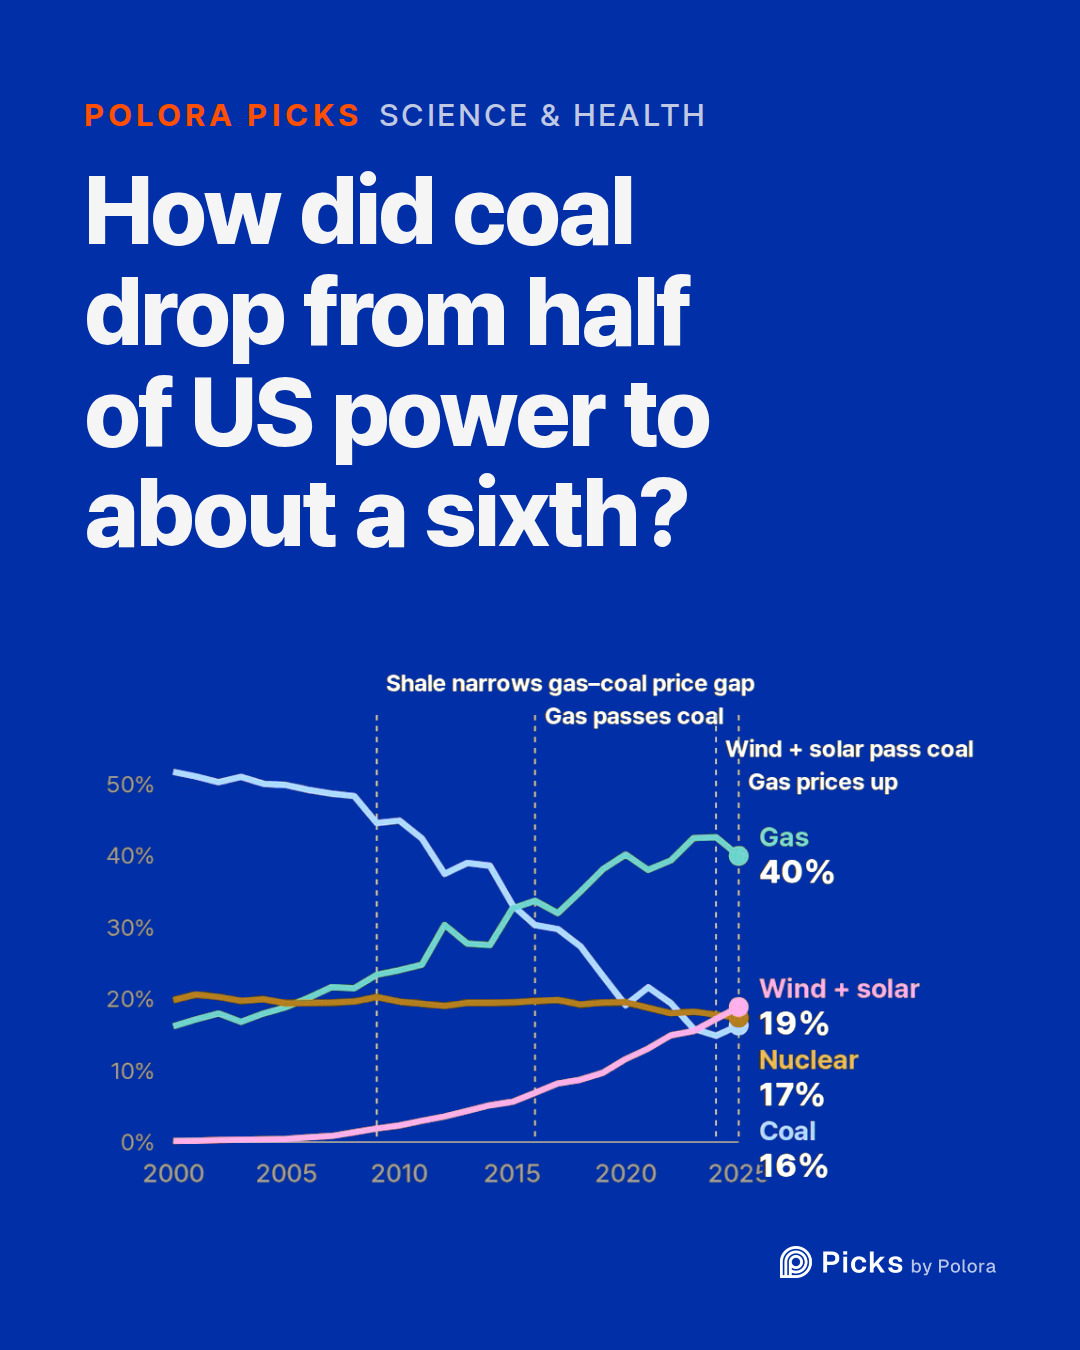
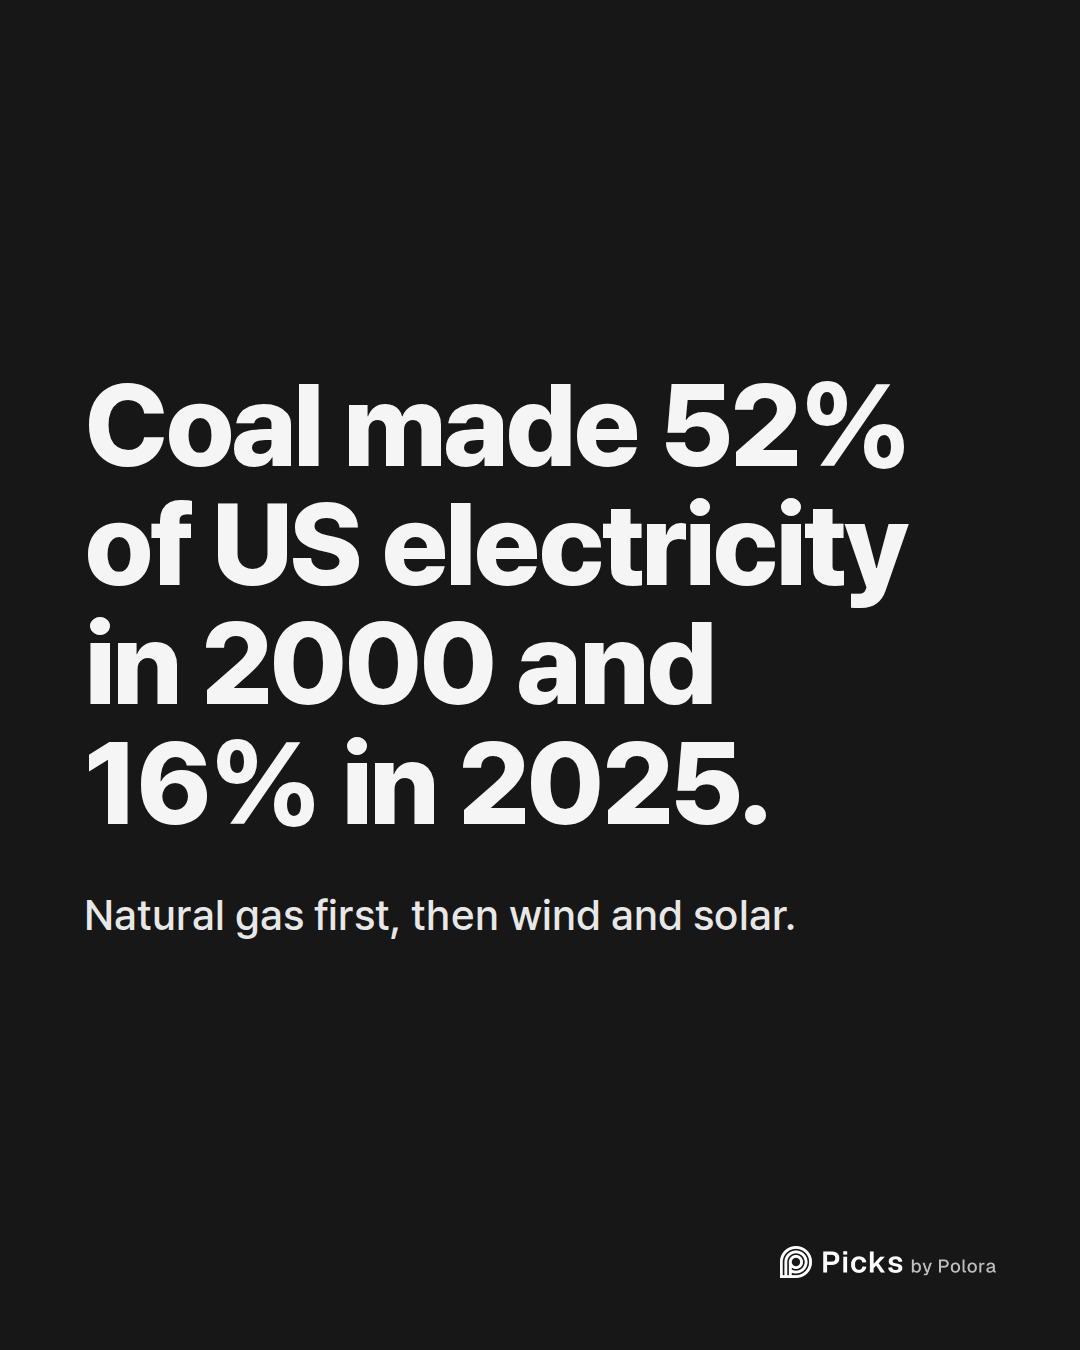
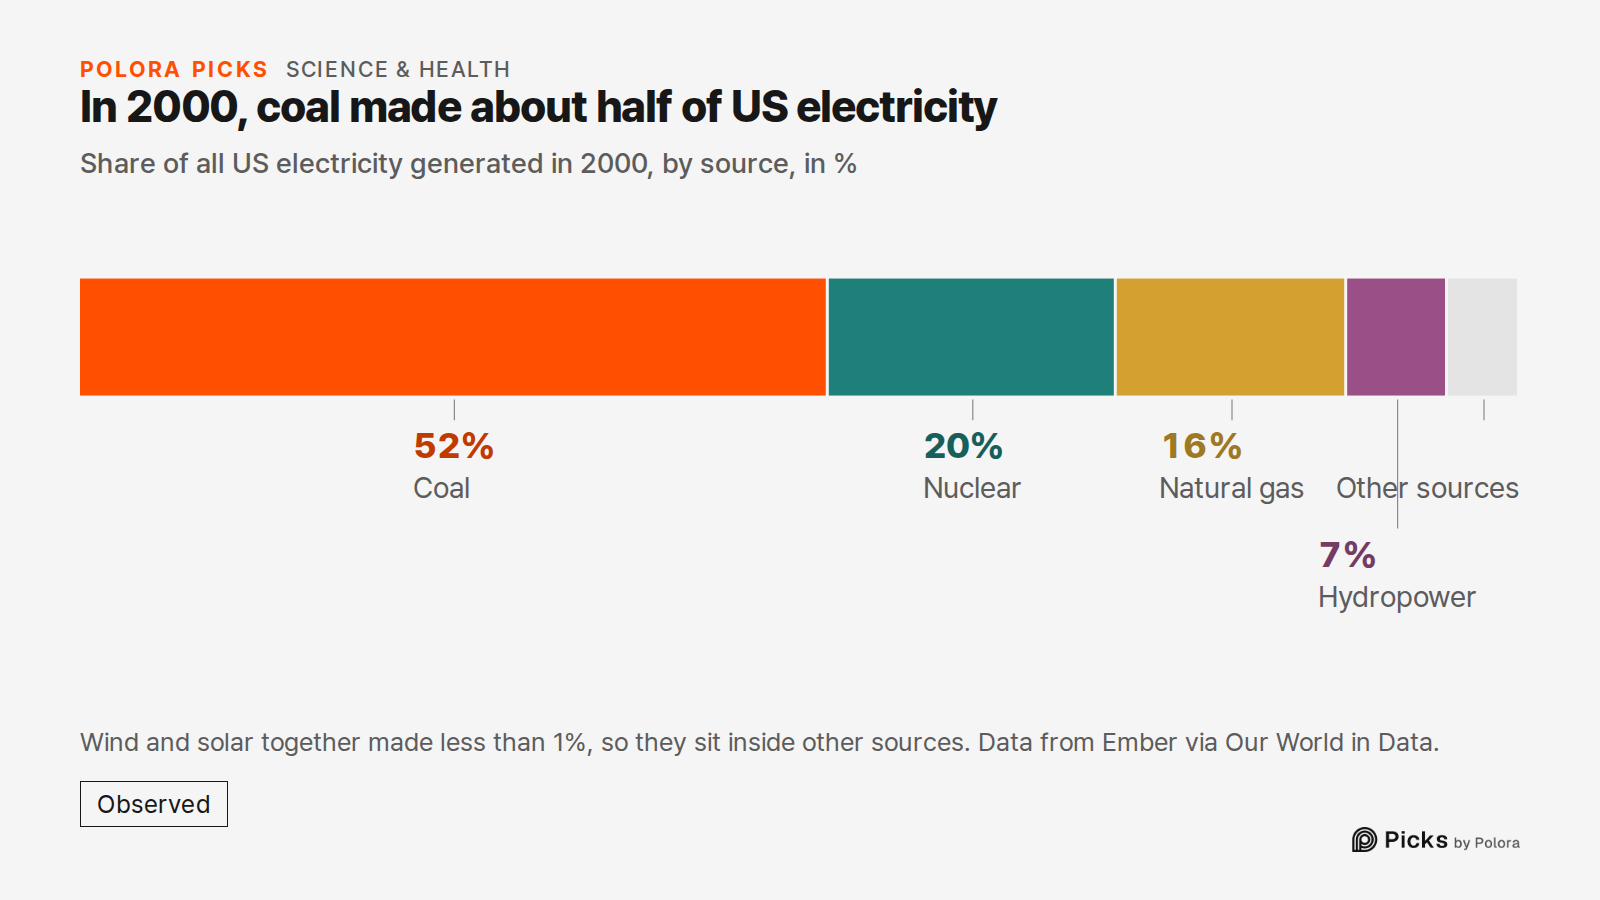
In 2000 the slices were lopsided. Coal made 52% of US electricity, nuclear 20%, natural gas 16% and hydropower 7%. Wind and solar together made less than 1%. Over the next eight years coal slipped only a little, to 48% in 2008, while gas edged up to 21%.
Cheap gas came first
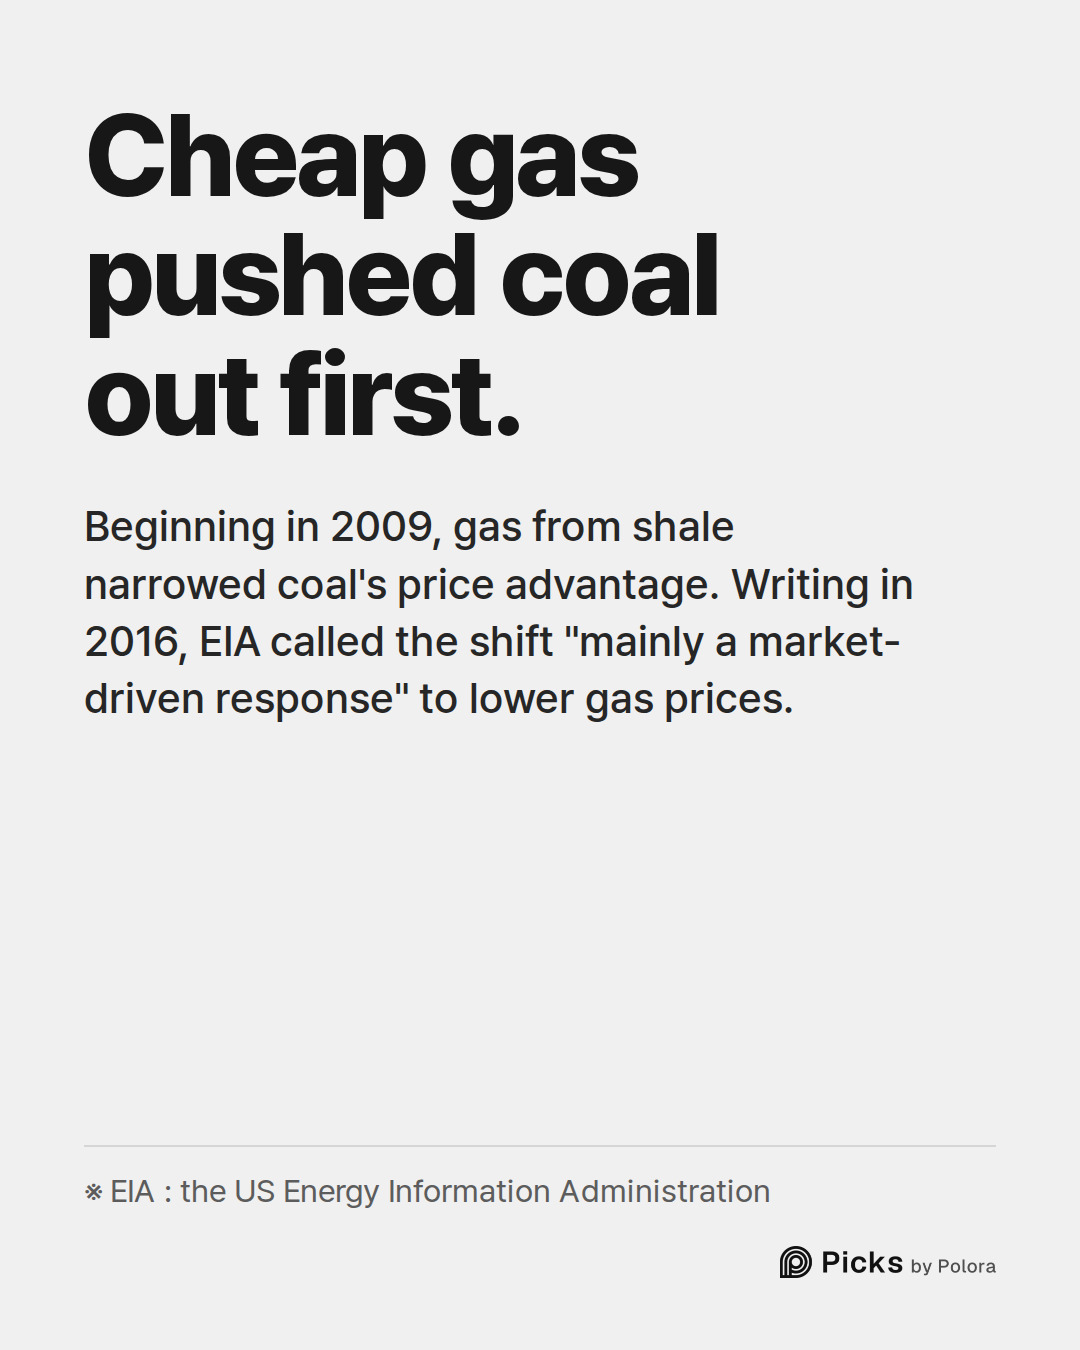
The first big shift was gas's rise. The US Energy Information Administration (EIA) explains that from 2000 to 2008 coal was much cheaper than gas, and that beginning in 2009 the price gap narrowed as large amounts of gas from shale formations changed the balance of supply and demand. Writing in 2016, EIA called coal's falling share and gas's rising one "mainly a market-driven response" to lower gas prices, with environmental rules playing a secondary role over the decade before.
The year-to-year swings fit EIA's account. From 2011 to 2012, coal's share dropped 4.9 percentage points and gas's rose 5.5. EIA ties that jump to unusually low gas prices after a very mild winter, and says coal won back some share when gas got dearer in 2013; coal's share did rise that year, before resuming its slide. By 2015 the two were almost level, at 33.1% for coal and 32.7% for gas. In 2016 gas pulled ahead, 34% to 30%, and it has stayed ahead every year since. That year, EIA notes, the benchmark gas price averaged its lowest since 1999.
Then wind and solar
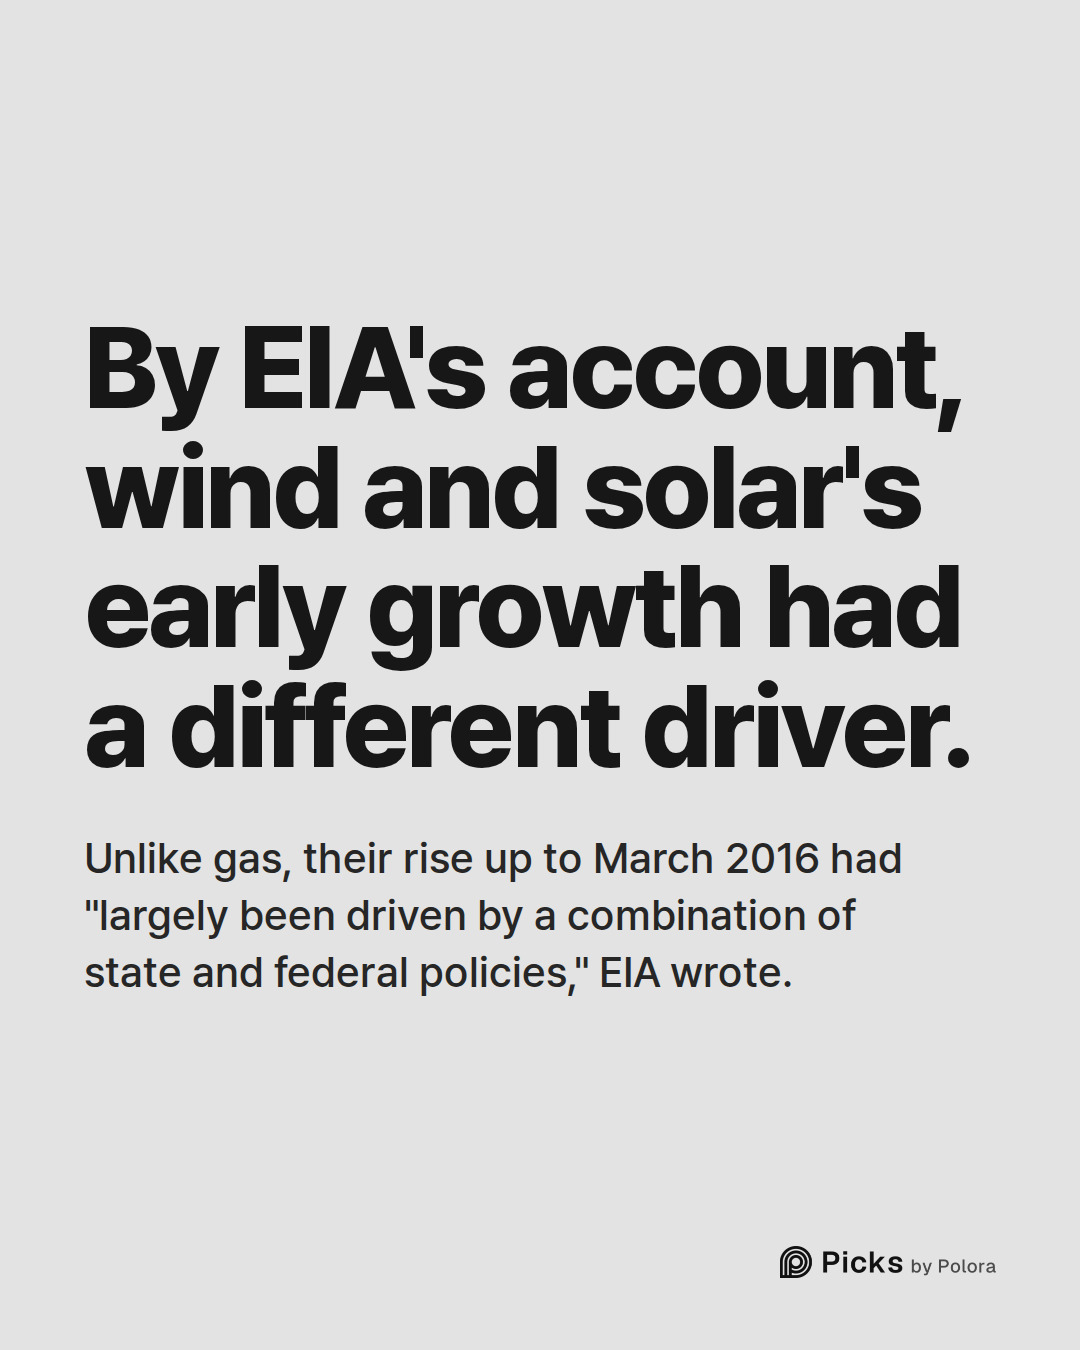
By EIA's account, wind and solar's early growth had a different driver. EIA wrote in March 2016 that, unlike gas, their rise up to then had "largely been driven by a combination of state and federal policies." Wind came first : it made more electricity than hydropower from 2019 onward. Solar took off later. It was still under 1% of US electricity in 2014, and passed hydropower in 2024.
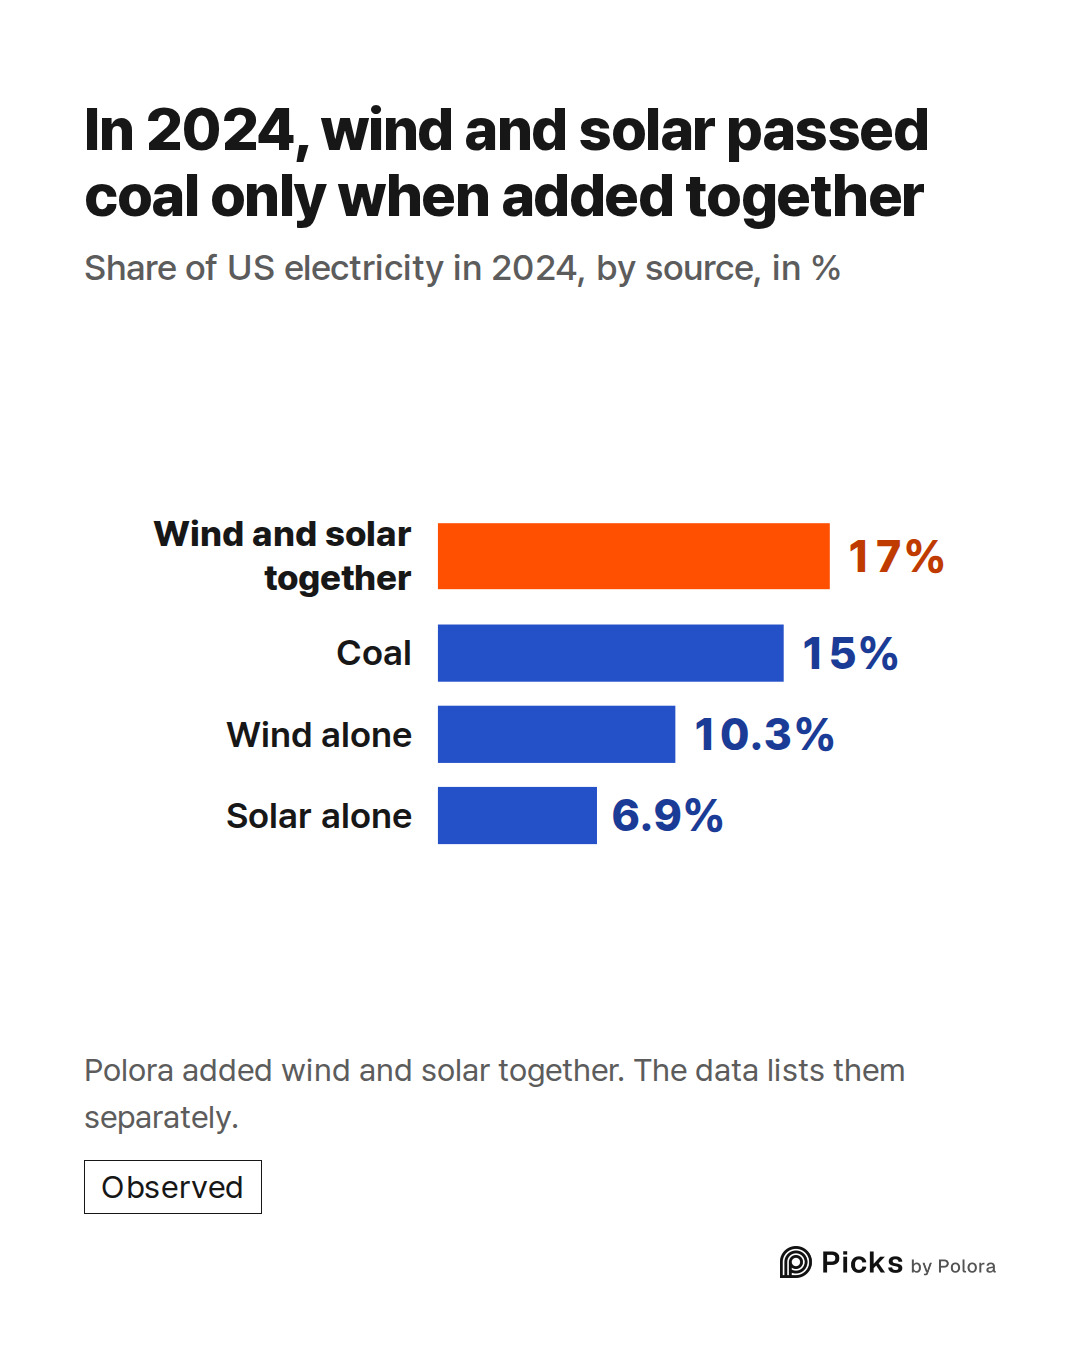
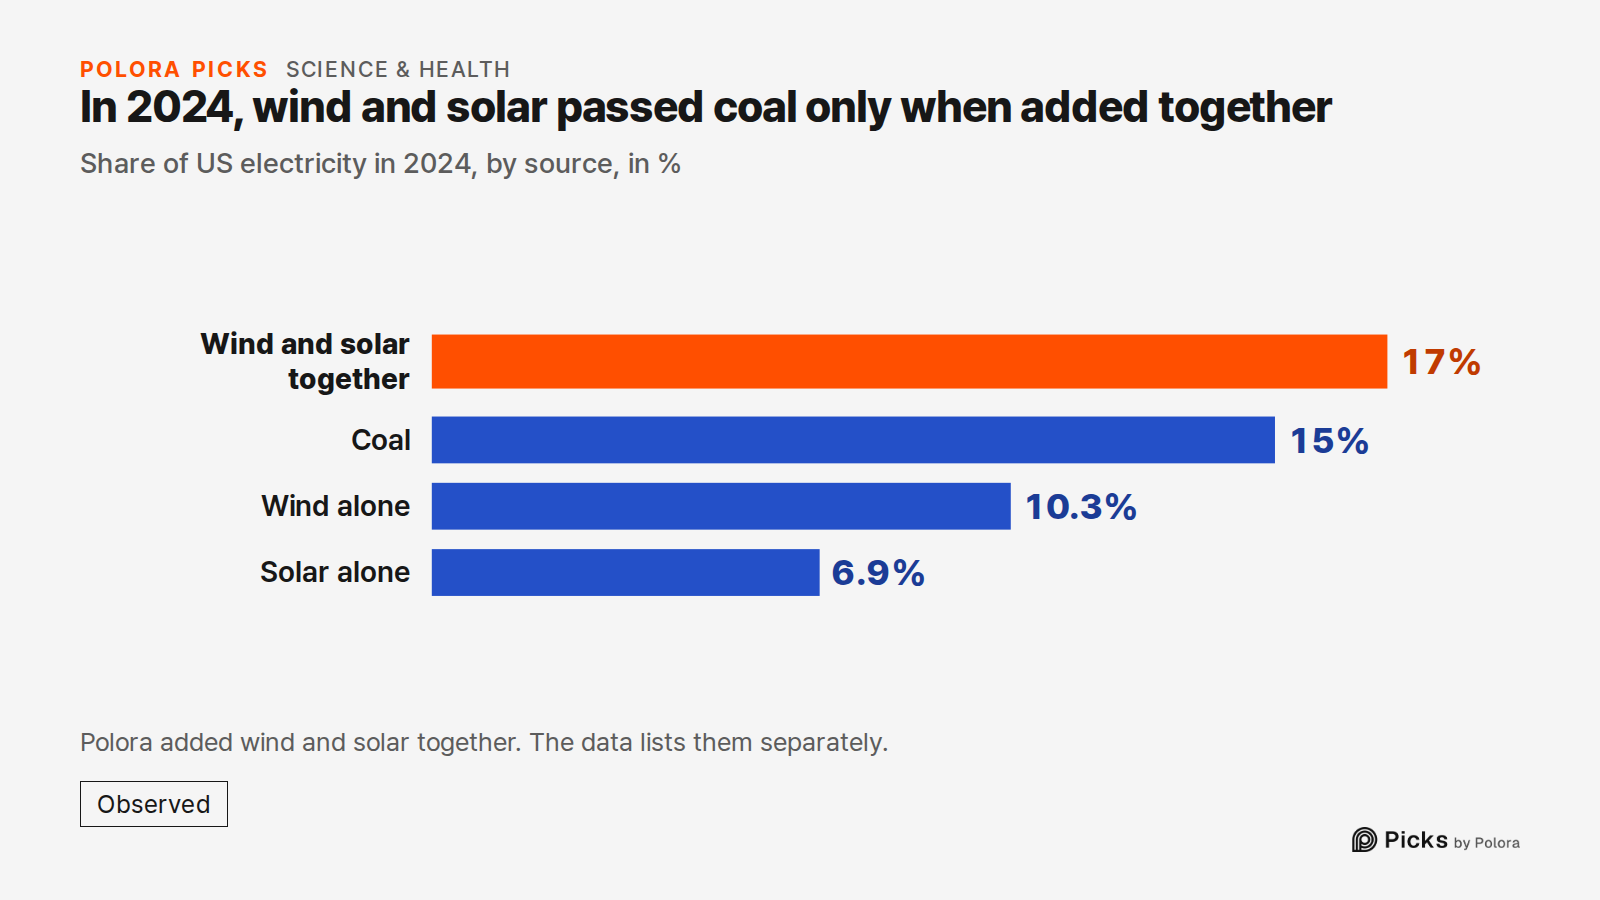
That same year, wind and solar together made 17% of US electricity, against 15% for coal, its lowest share in these 26 years. Ember counted the same crossing, as ZME Science reported. Note the word "together" : wind alone made 10.3% and solar 6.9%, so neither one beat coal by itself. In 2025 the pair reached 19% and also passed nuclear, at 17%. All of that year's gain in share came from solar; wind's share was essentially flat.
Coal's comebacks
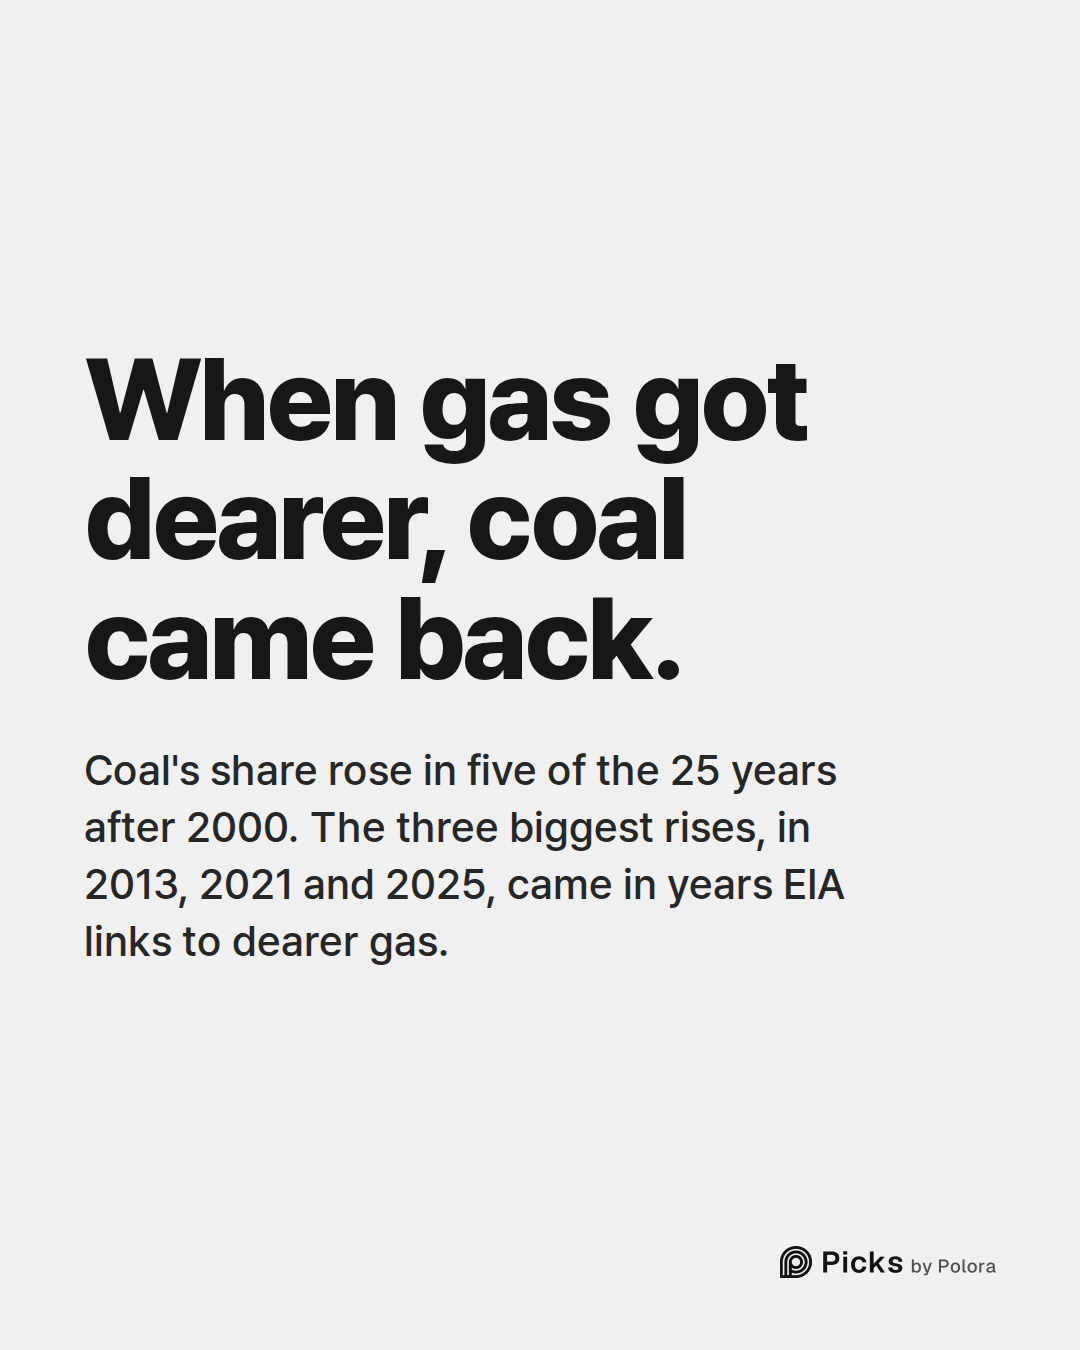
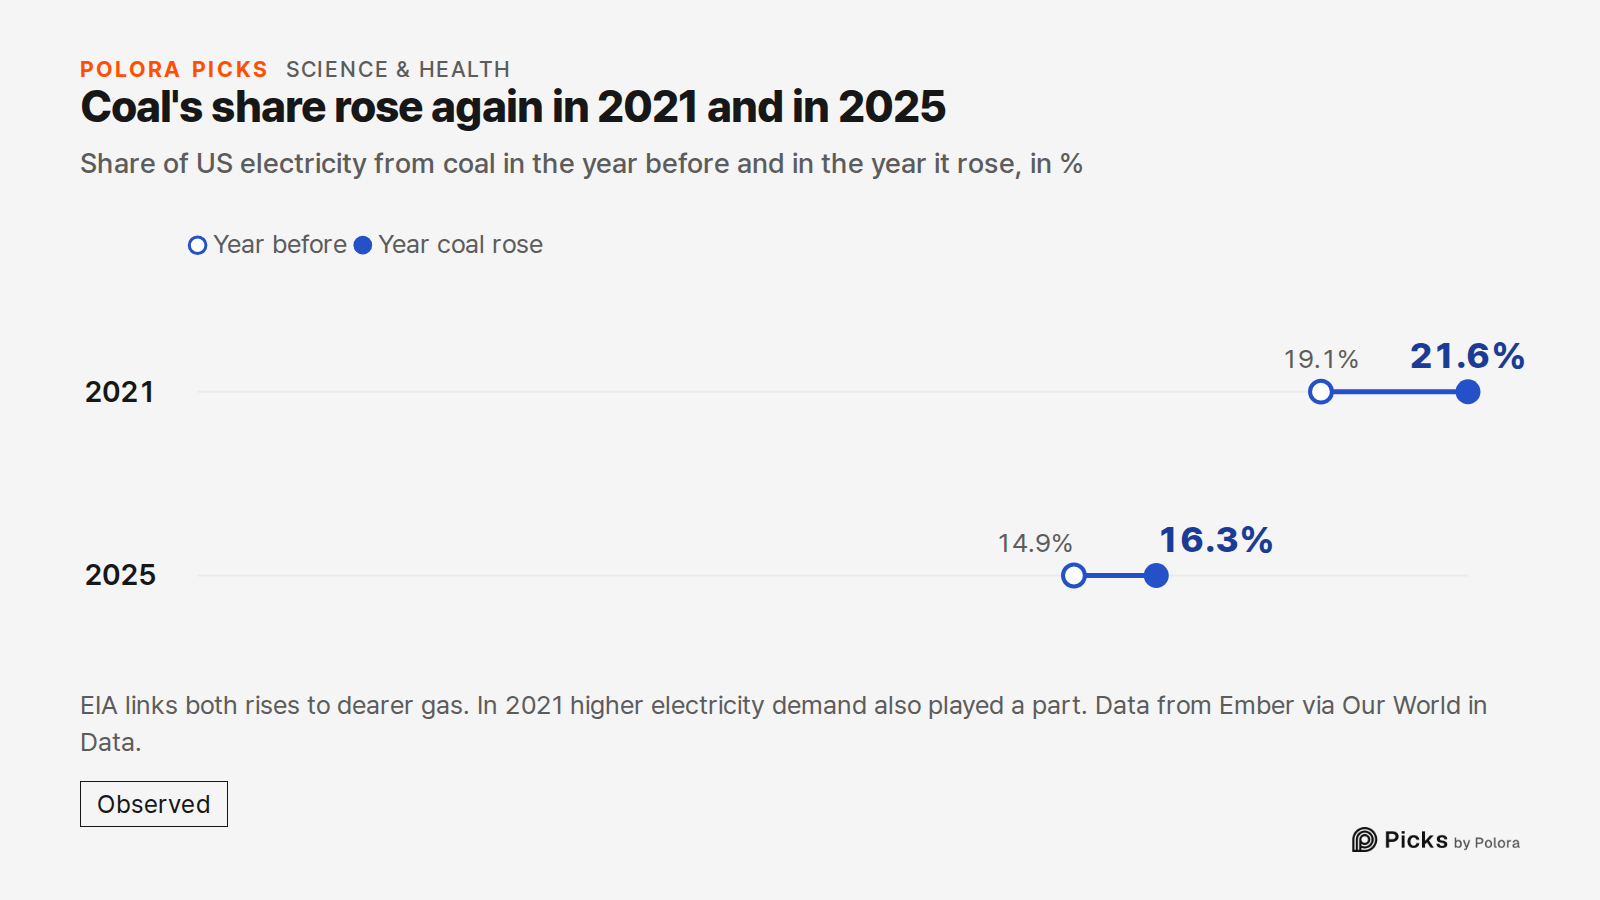
Coal's fall was not a straight line. In five of the 25 years after 2000, its share rose. The three biggest rises, in 2013, 2021 and 2025, came in years EIA links to dearer gas. In 2021 coal went from 19.1% to 21.6% as gas fell back; EIA says coal generation rose that year because of higher electricity demand and higher gas prices after the pandemic, before sliding again. In 2025 coal rose from 14.9% to 16.3%. EIA reports that across the Lower 48 states, higher gas prices that year cut gas-fired generation, and coal-fired generation rose. Solar generation rose too. EIA's 2025 figures cover the Lower 48 states, every state except Alaska and Hawaii, while these shares cover the whole country.
Gas's own share hit its highest in these 26 years, 42.6%, in 2024, and slipped to 40% in 2025. It is still by far the largest source.
What these shares do not say
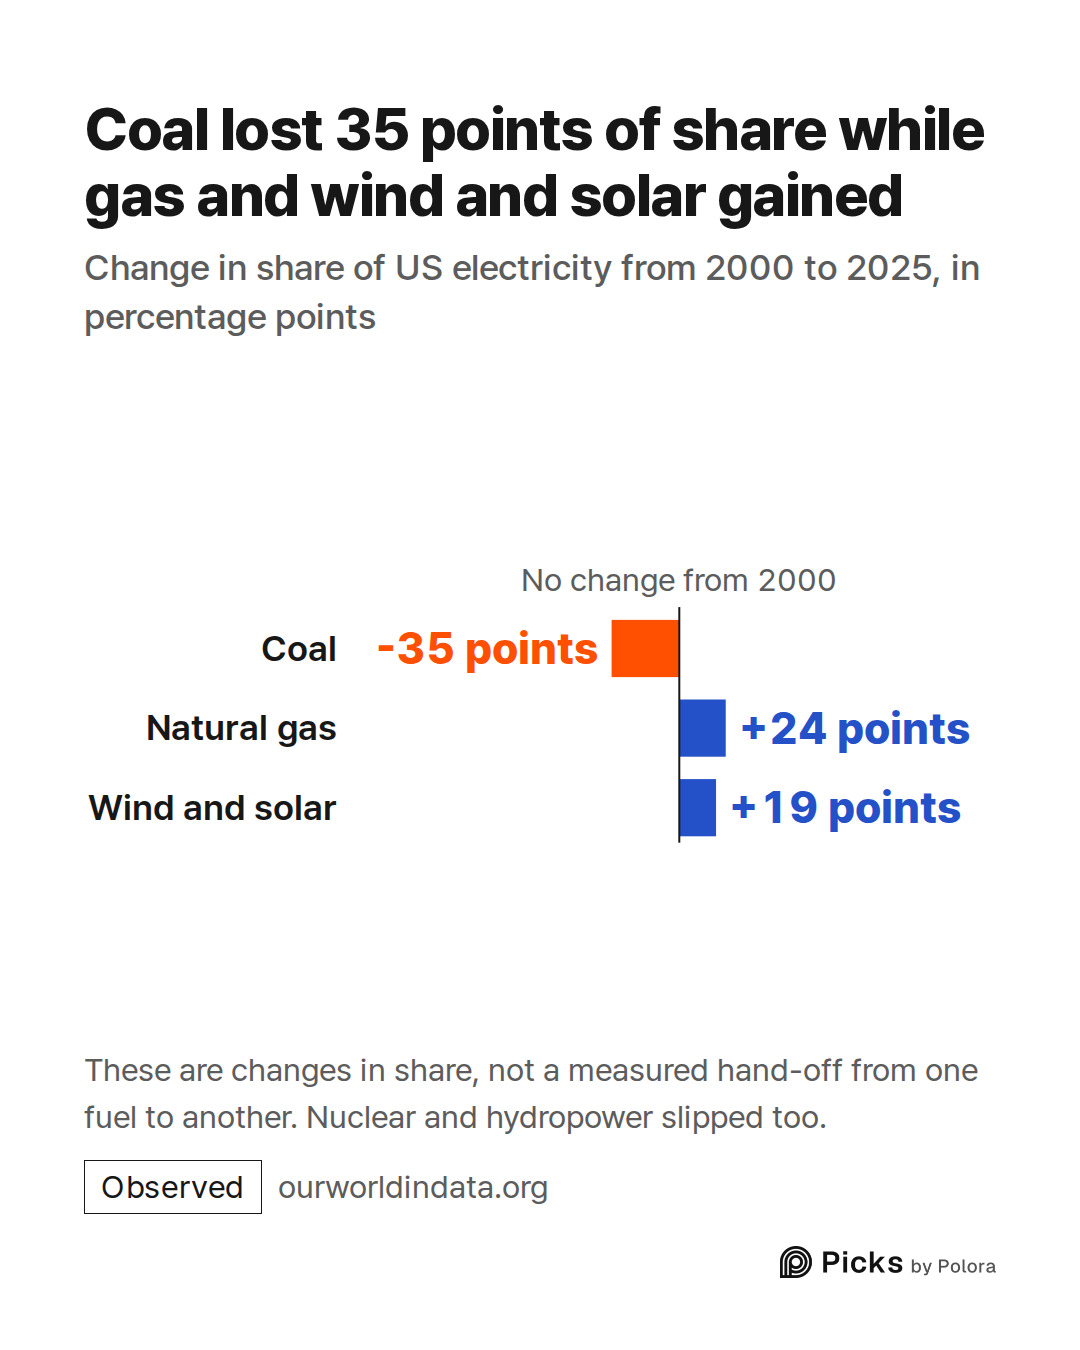
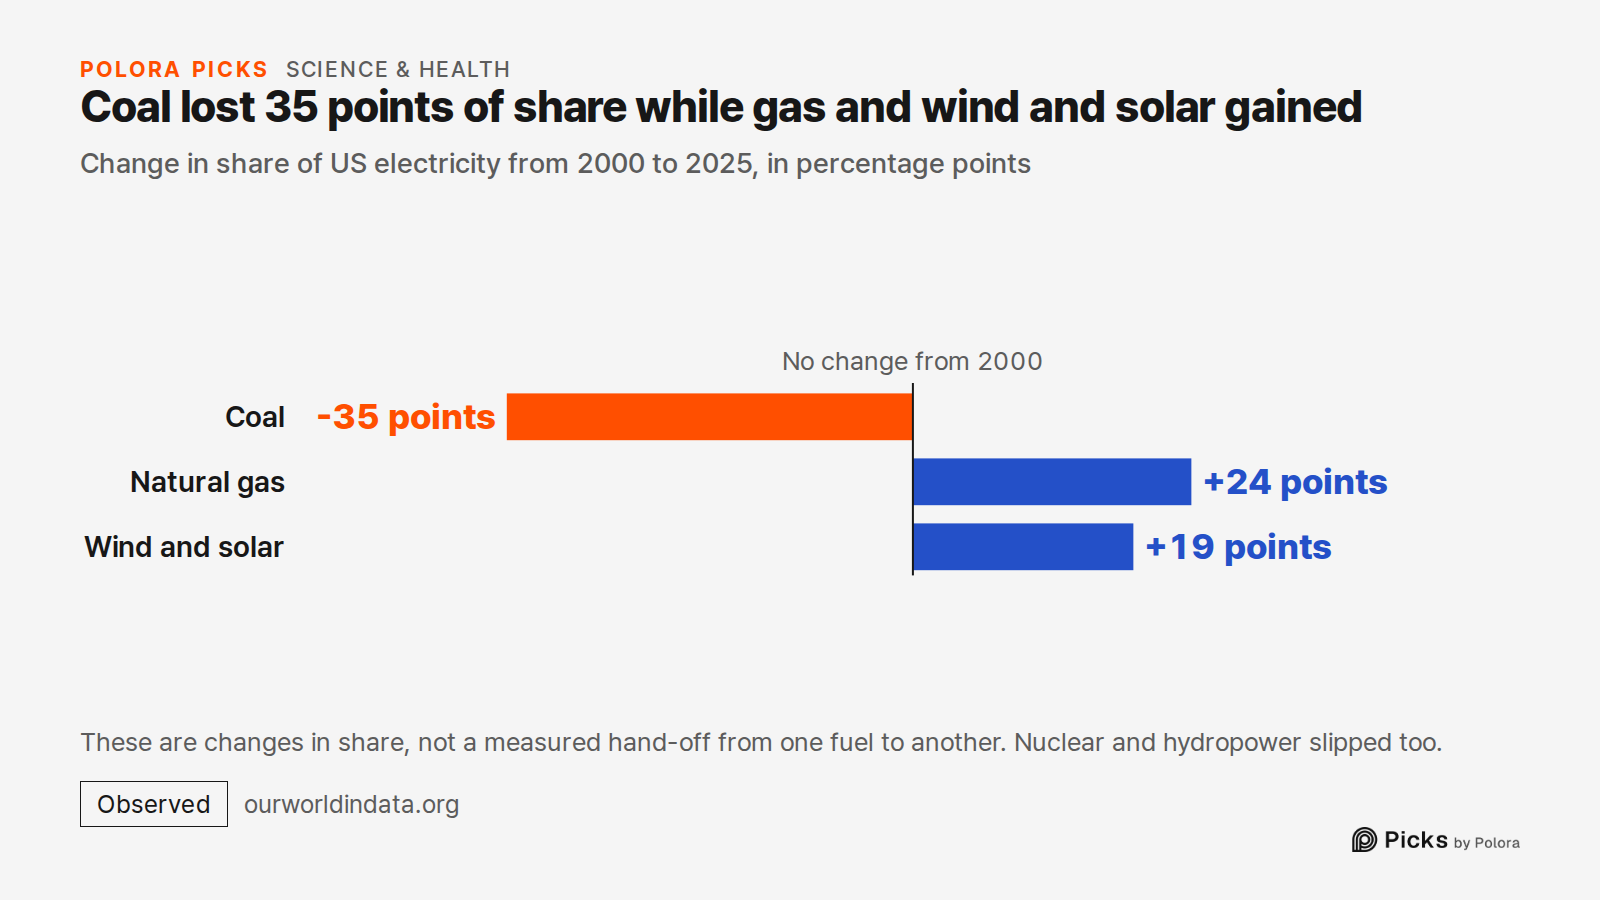
These are shares, not amounts. Total US generation changes from year to year, and this data does not show the total, so a falling share does not by itself say how much coal was burned. Nuclear's share stayed in a narrow band, between 17% and 21% of the total throughout. Fossil fuels taken together (coal, gas and oil) went from 71% of US electricity in 2000 to 57% in 2025. Over those years coal's share fell by 35 percentage points, while gas's rose by 24 and wind and solar's by 19; nuclear and hydropower slipped. Those are changes in share, not a measured hand-off from one fuel to another.
Wind and solar were added together by Polora; the data lists them separately. EIA's own yearly tallies give slightly different shares for some years, so this piece uses Ember's figures throughout. The 2025 numbers are the most recent year in the data.
- [Our World in Data, Share of electricity production by source (data from Ember, CC BY 4.0)]
- [Ember, Electricity Data Explorer]
- [EIA (March 16, 2016), Natural gas expected to surpass coal in mix of fuel used for U.S. power generation in 2016]
- [EIA (January 13, 2017), Natural gas prices in 2016 were the lowest in nearly 20 years]
- [EIA (October 27, 2022), U.S. coal-fired generation declining after brief rise last year]
- [EIA (February 2, 2026), U.S. wholesale day-ahead electricity prices rose in 2025 with higher natural gas prices]
- [ZME Science, For the first time ever, wind and solar produced more electricity than coal in the US]