What is being measured
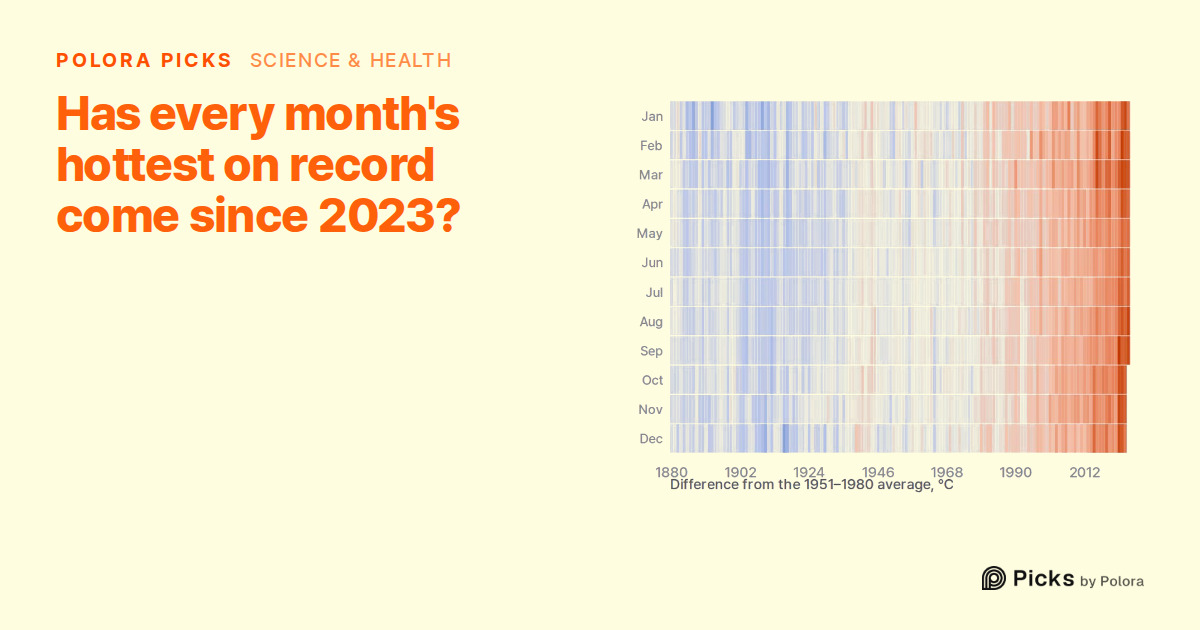
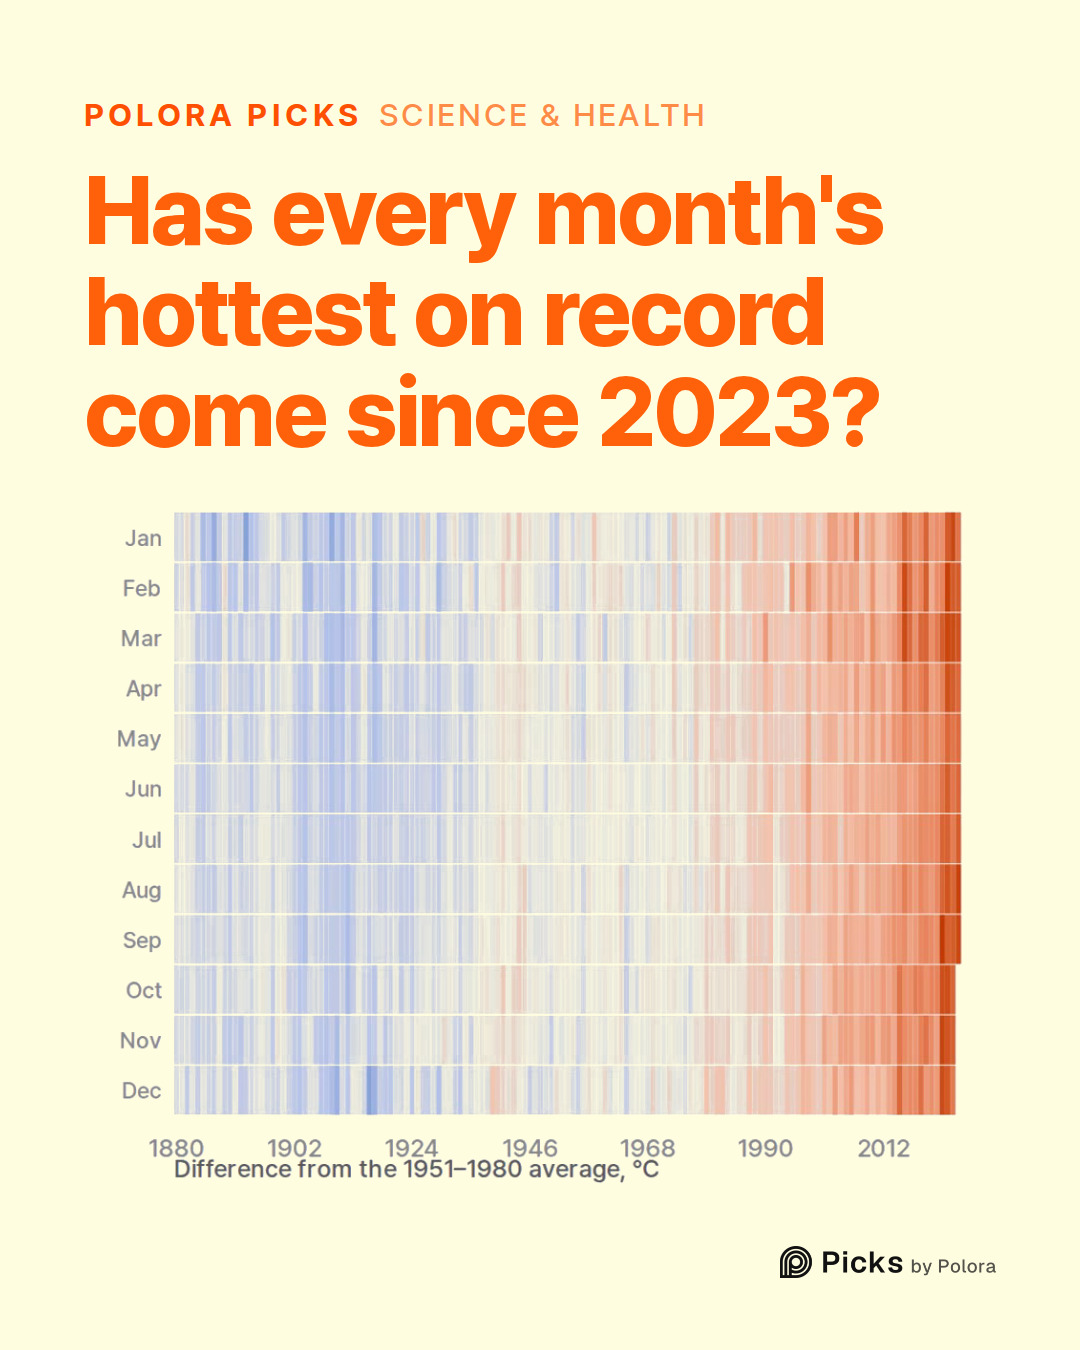
The numbers come from GISTEMP, NASA's estimate of Earth's average surface temperature. It combines readings from tens of thousands of weather stations on land with sea-surface temperatures measured by ships and buoys. It does not give the temperature itself. It gives an anomaly, in degrees : how much warmer or cooler a month was than the 1951–1980 average for that same calendar month.
That is why the months can be compared fairly. Worldwide, July and August are on average about 3.6°C (6.5°F) warmer than December and January, NASA's FAQ says. So a record January means a January far warmer than past Januaries, not a January warmer than July. Every monthly record in this piece compares a month only with the same month in other years.
Warm months without a break
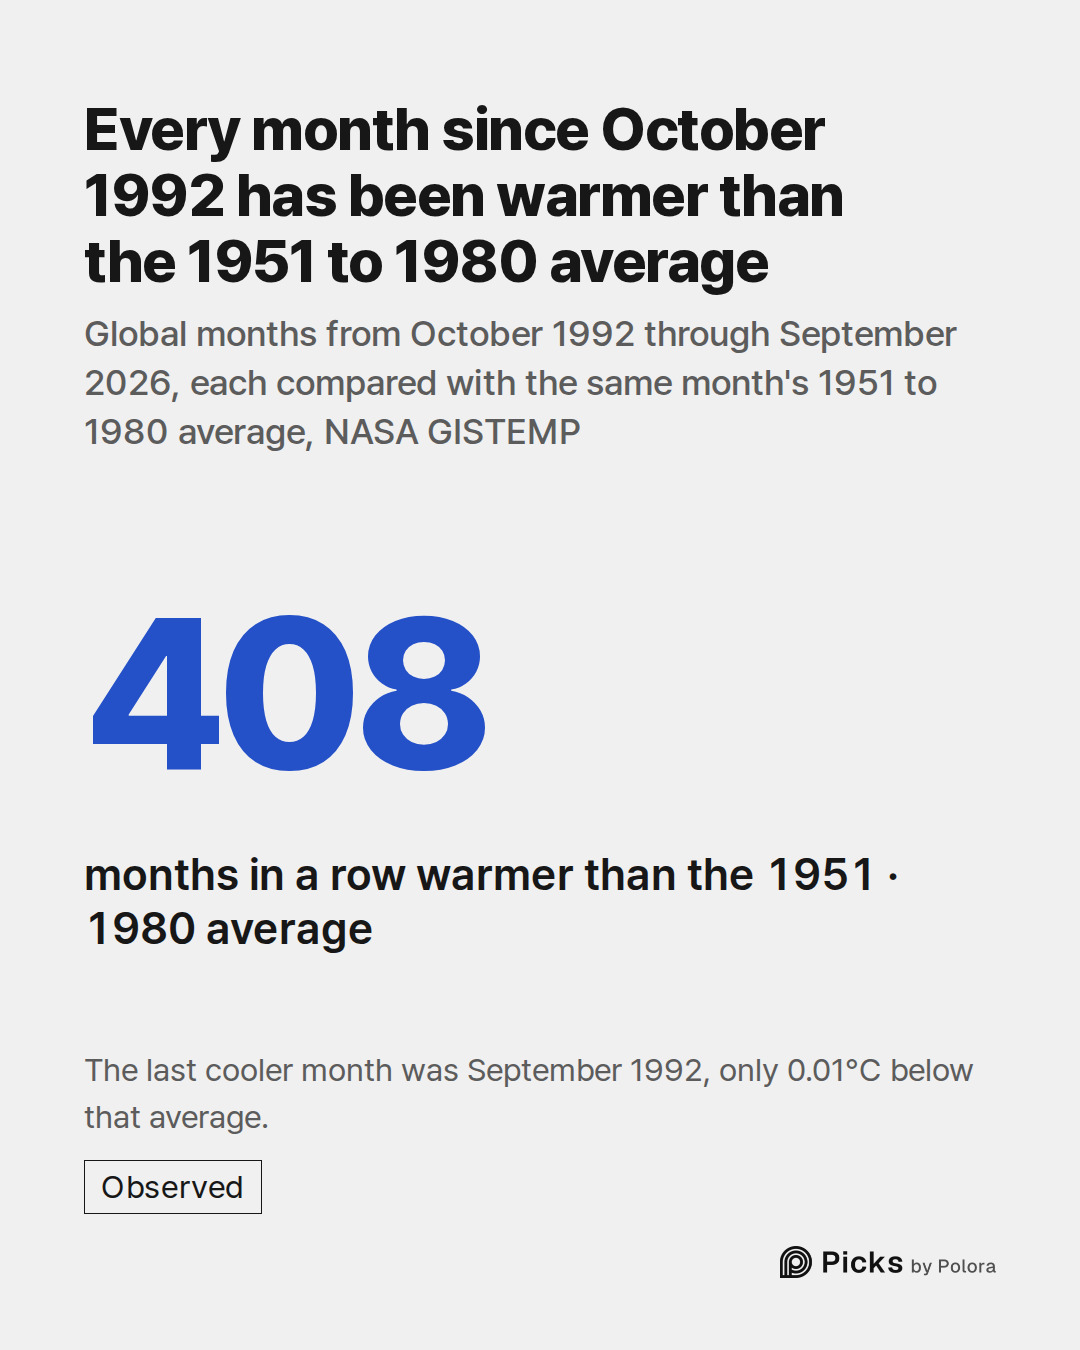
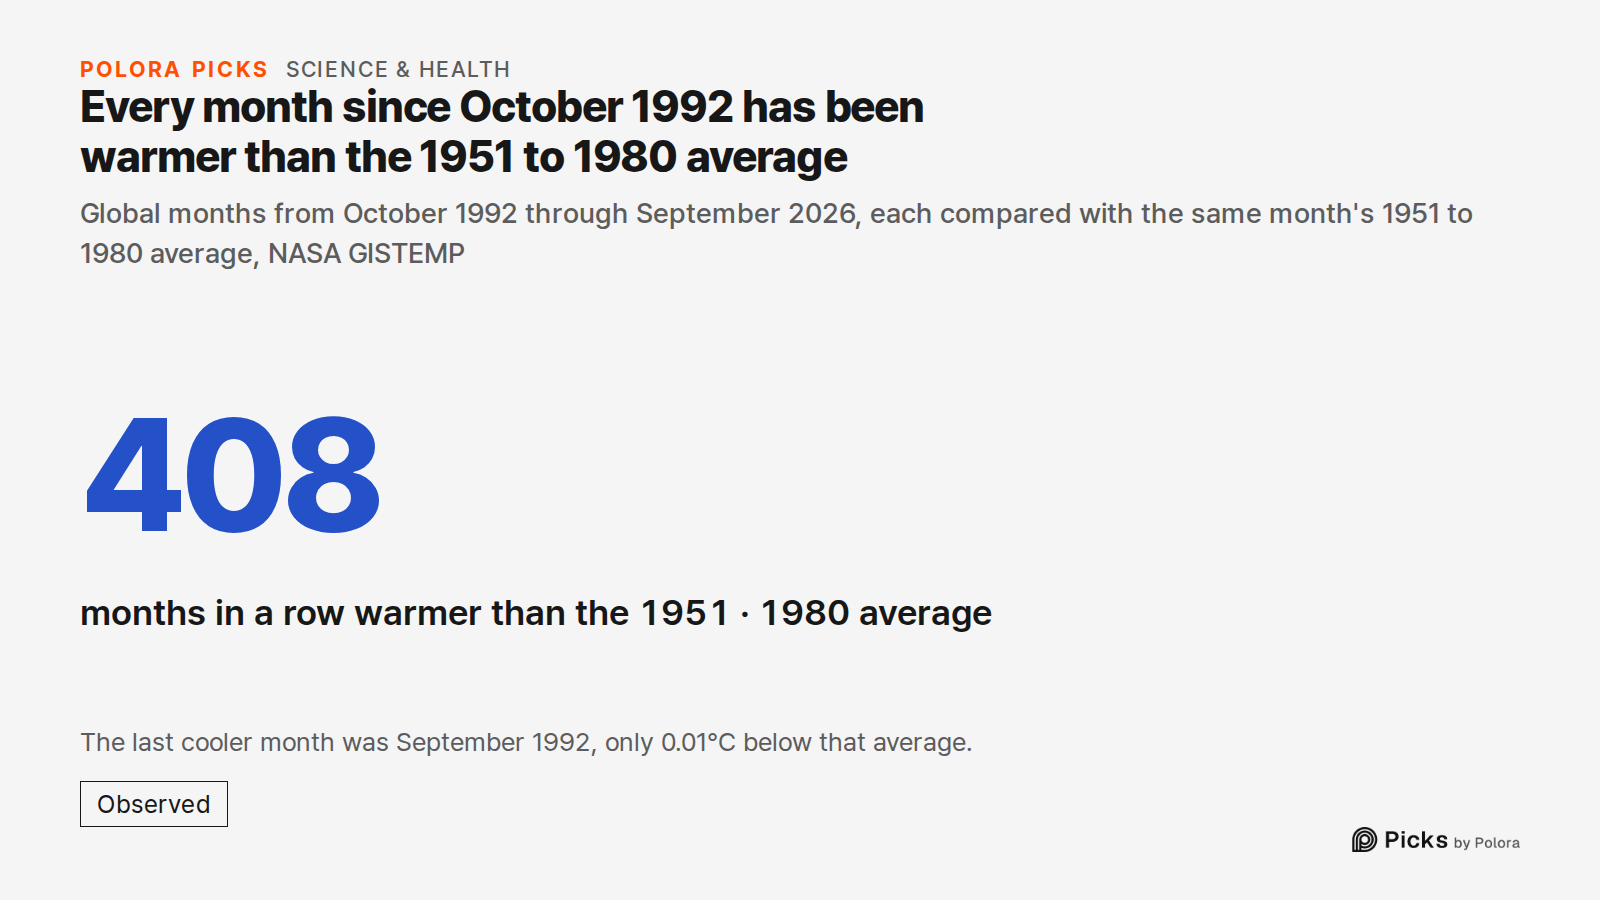
The last full year cooler than the 1951–1980 average was 1976. The last cooler month was September 1992, and only barely, at 0.01°C below. From October 1992 through September 2026, the latest month in the data, all 408 months came in above that average.
2023 : the jump
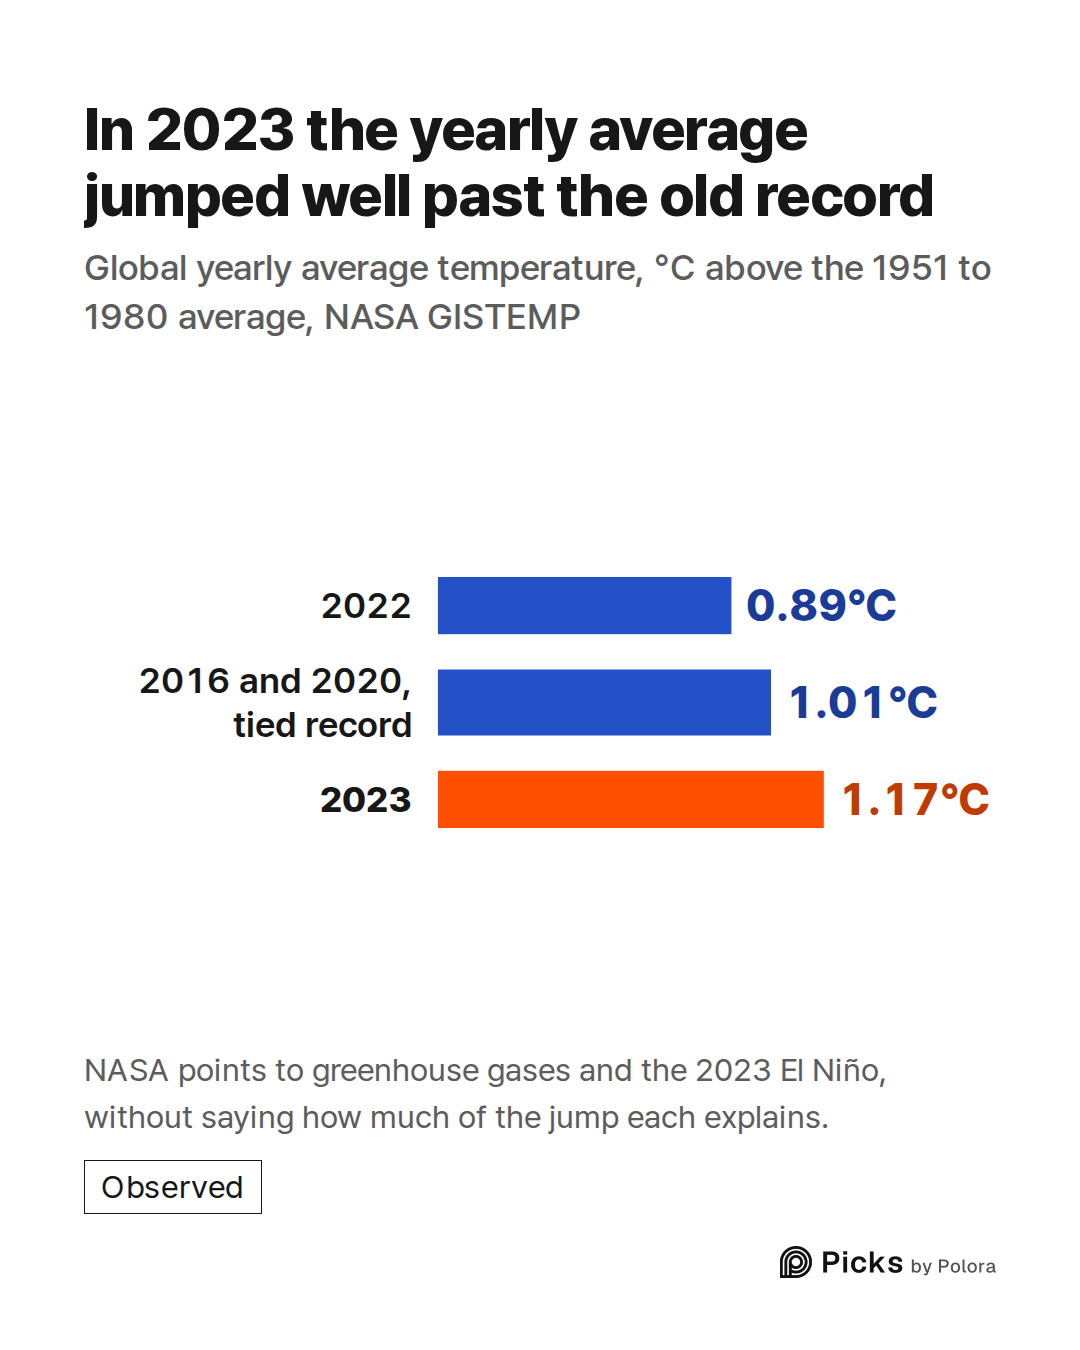
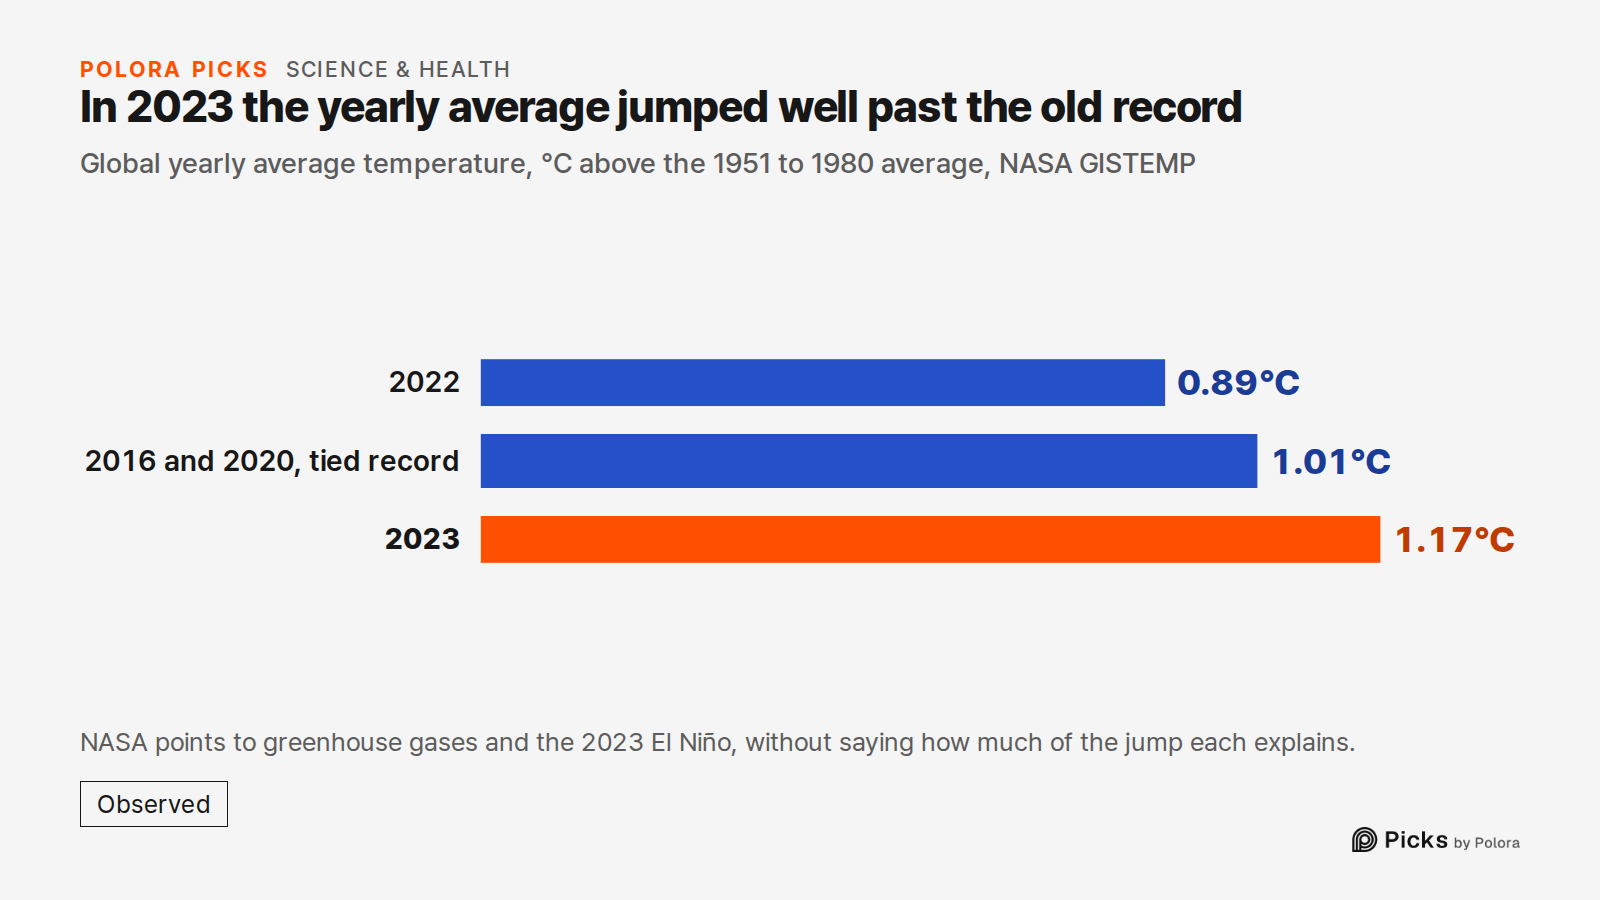
The record had been rising, unevenly, for decades. Then in 2023 it jumped. The yearly average went from 0.89°C above the baseline in 2022 to 1.17°C in 2023. The rise of 0.28°C in one year took 2023 well past the previous warmest years, 2016 and 2020, tied at 1.01°C.
Some months jumped even further. September 2023 was 1.48°C above its baseline, beating the old September record, set in 2020, by 0.52°C. That is the biggest margin of any month.
NASA's January 2025 release on the record points to two factors, without saying how much of the jump each one explains. Scientists have concluded that greenhouse gases, mainly carbon dioxide and methane, drive the long-term warming. And the strong El Niño that began in fall 2023, a natural warming of the tropical Pacific, "helped nudge global temperatures above previous records." The same release adds that the heat went on exceeding expectations in 2024 even after El Niño faded. It says researchers are still looking at other possible factors, including the 2022 Tonga volcanic eruption and cuts in air pollution, which can change cloud cover and how much sunlight is reflected back to space.
Twelve months, four record years
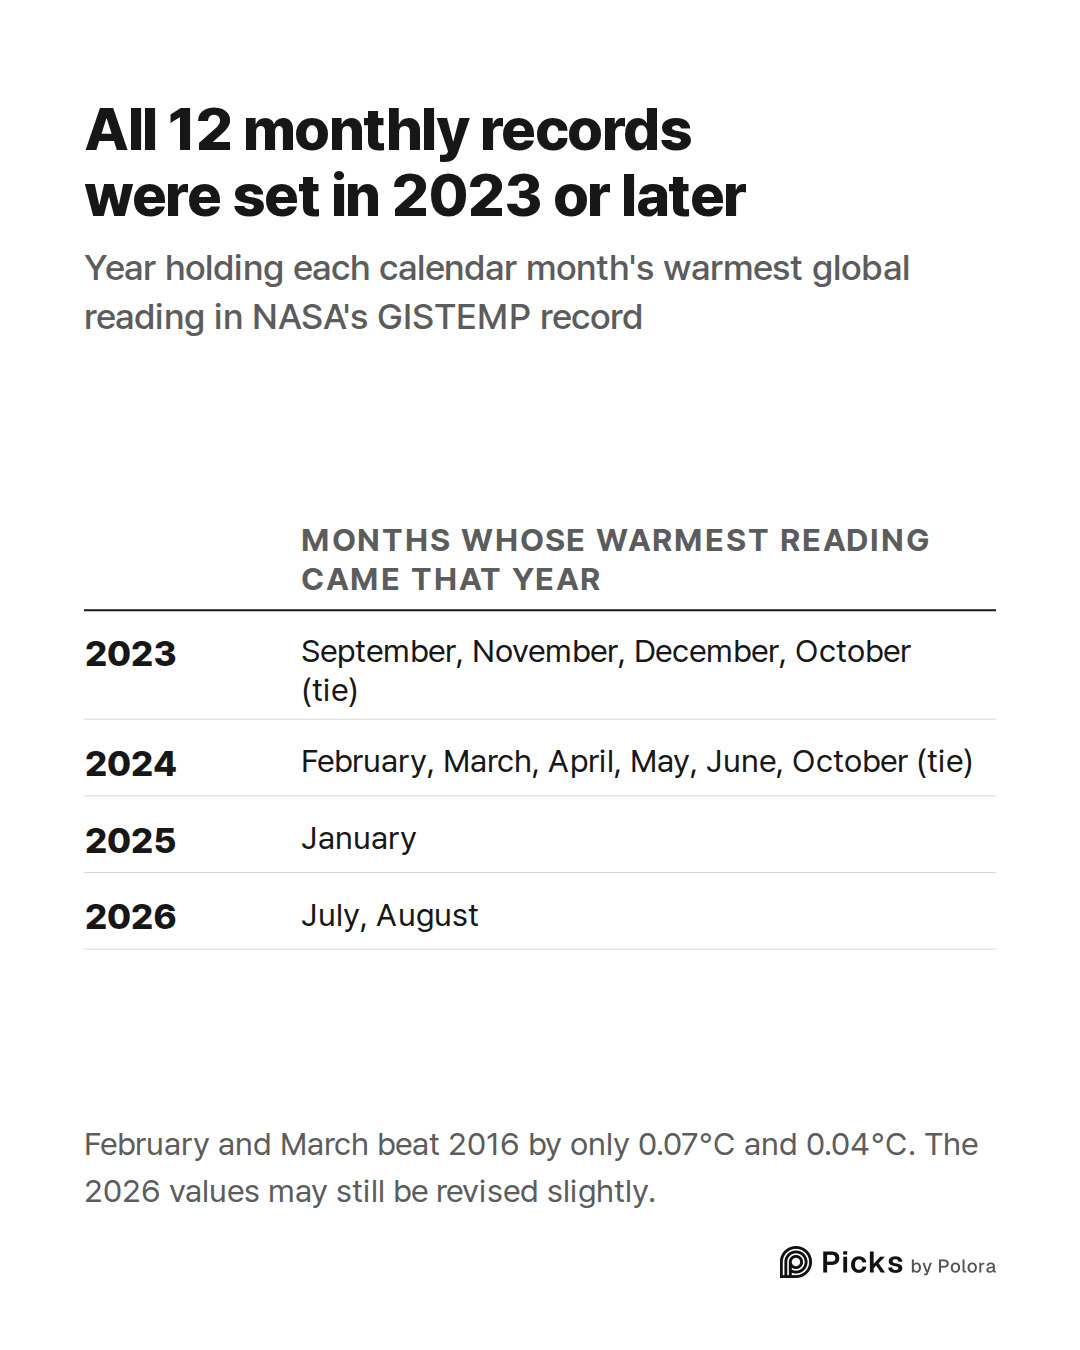
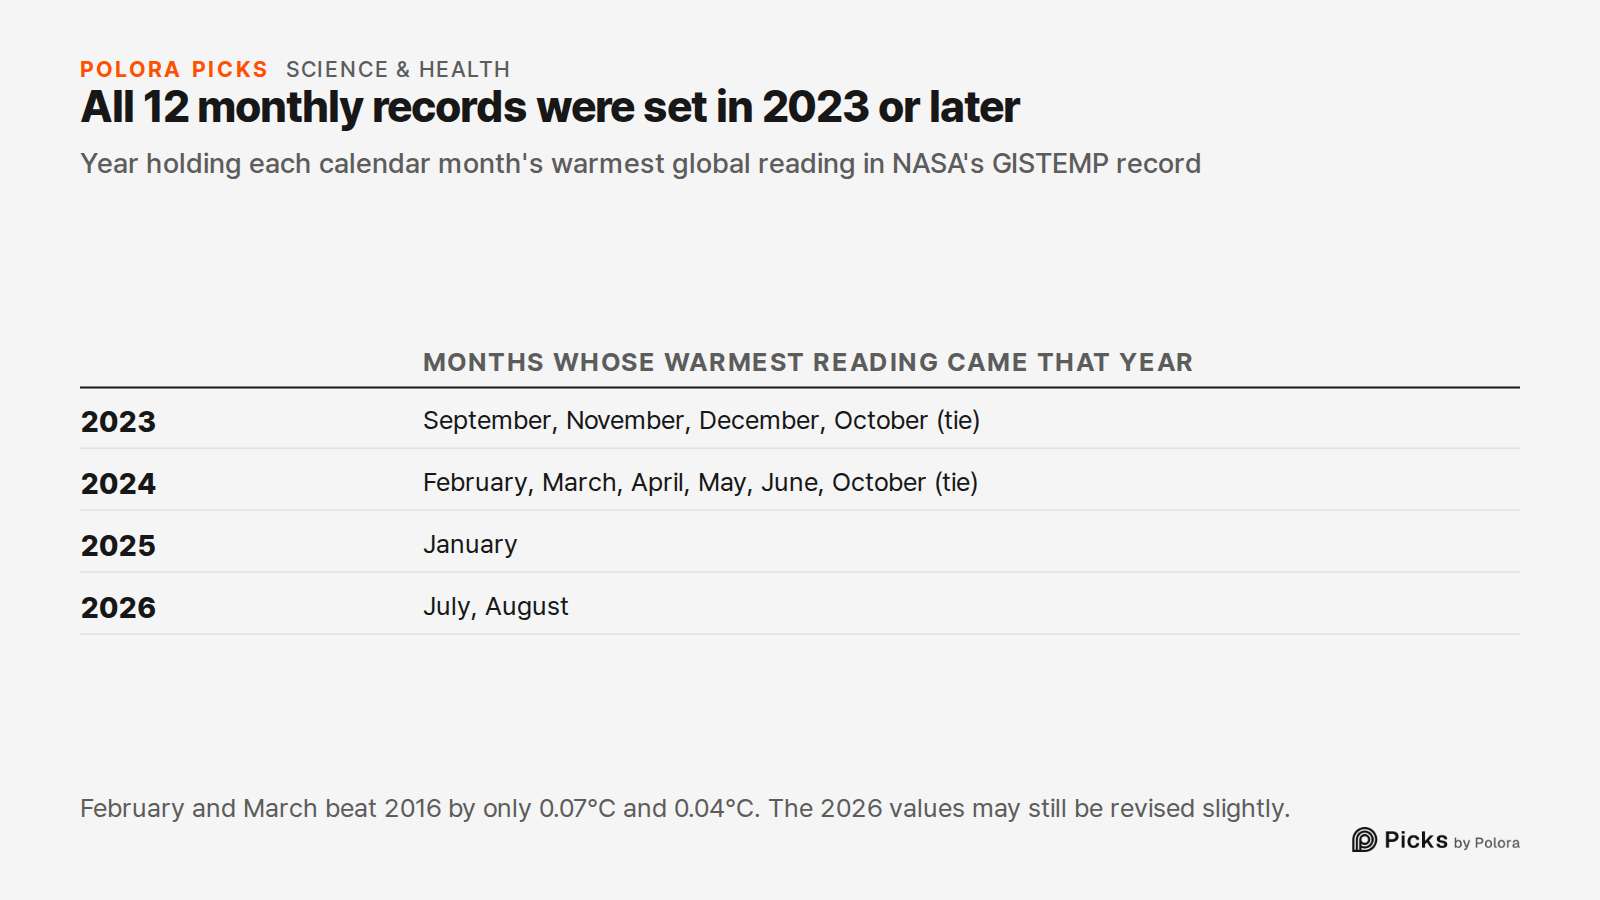
Here is where each month's record now sits. September, November and December set theirs in 2023. February, March, April, May and June set theirs in 2024. January's came in 2025, and July's and August's in 2026, at 1.24°C and 1.42°C. October is a tie : 2023 and 2024 both stand at 1.34°C, to the two decimal places the data gives.
How solid are these records? There are two different questions.
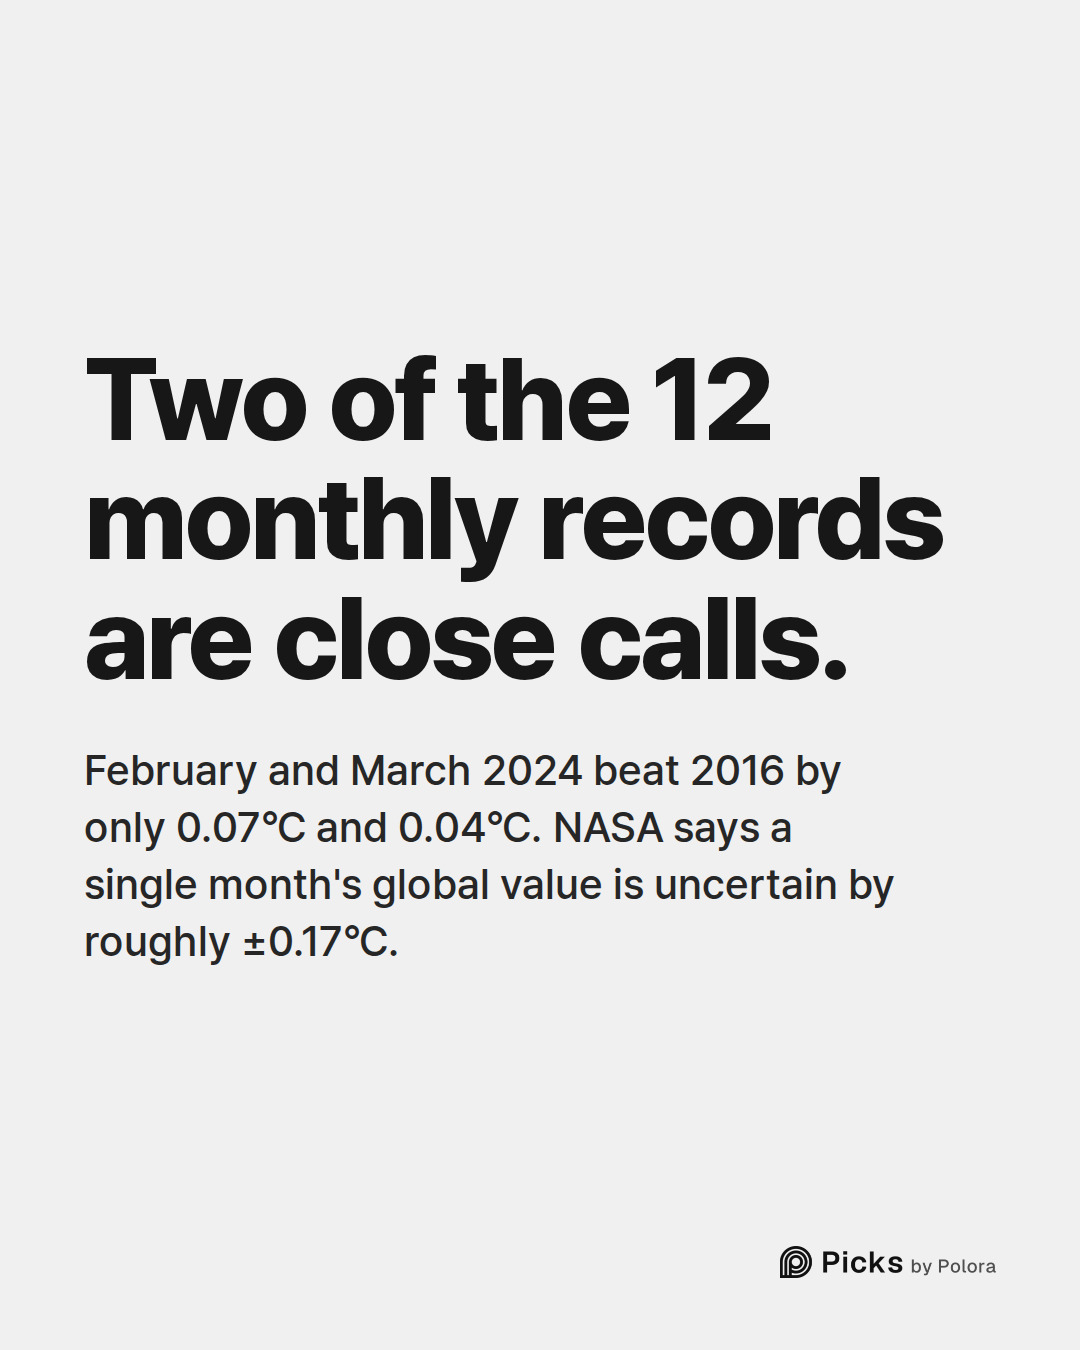
The first is whether each month's record really falls in 2023 or later. For ten of the 12 months, the best value from 2023 or later beats the best from any earlier year by 0.17°C to 0.52°C. February and March are the exceptions. Their 2024 records beat 2016 by only 0.07°C and 0.04°C. NASA's FAQ says a single month's global value is uncertain by roughly ±0.17°C. That figure is for one value on its own, not for the gap between two, but it is a reason to treat those two as close calls.
The second is which recent year holds each record, and there the margins are much smaller. Look at each month's runner-up, the next-highest value below its record (for October, below the 2023–2024 tie). For 11 of the 12 months, that runner-up is another year from 2023 on, and no record leads it by more than 0.16°C. July 2026, for example, beat July 2024 by 0.04°C, and May 2024 beat May 2026 by 0.03°C.
The warmest years
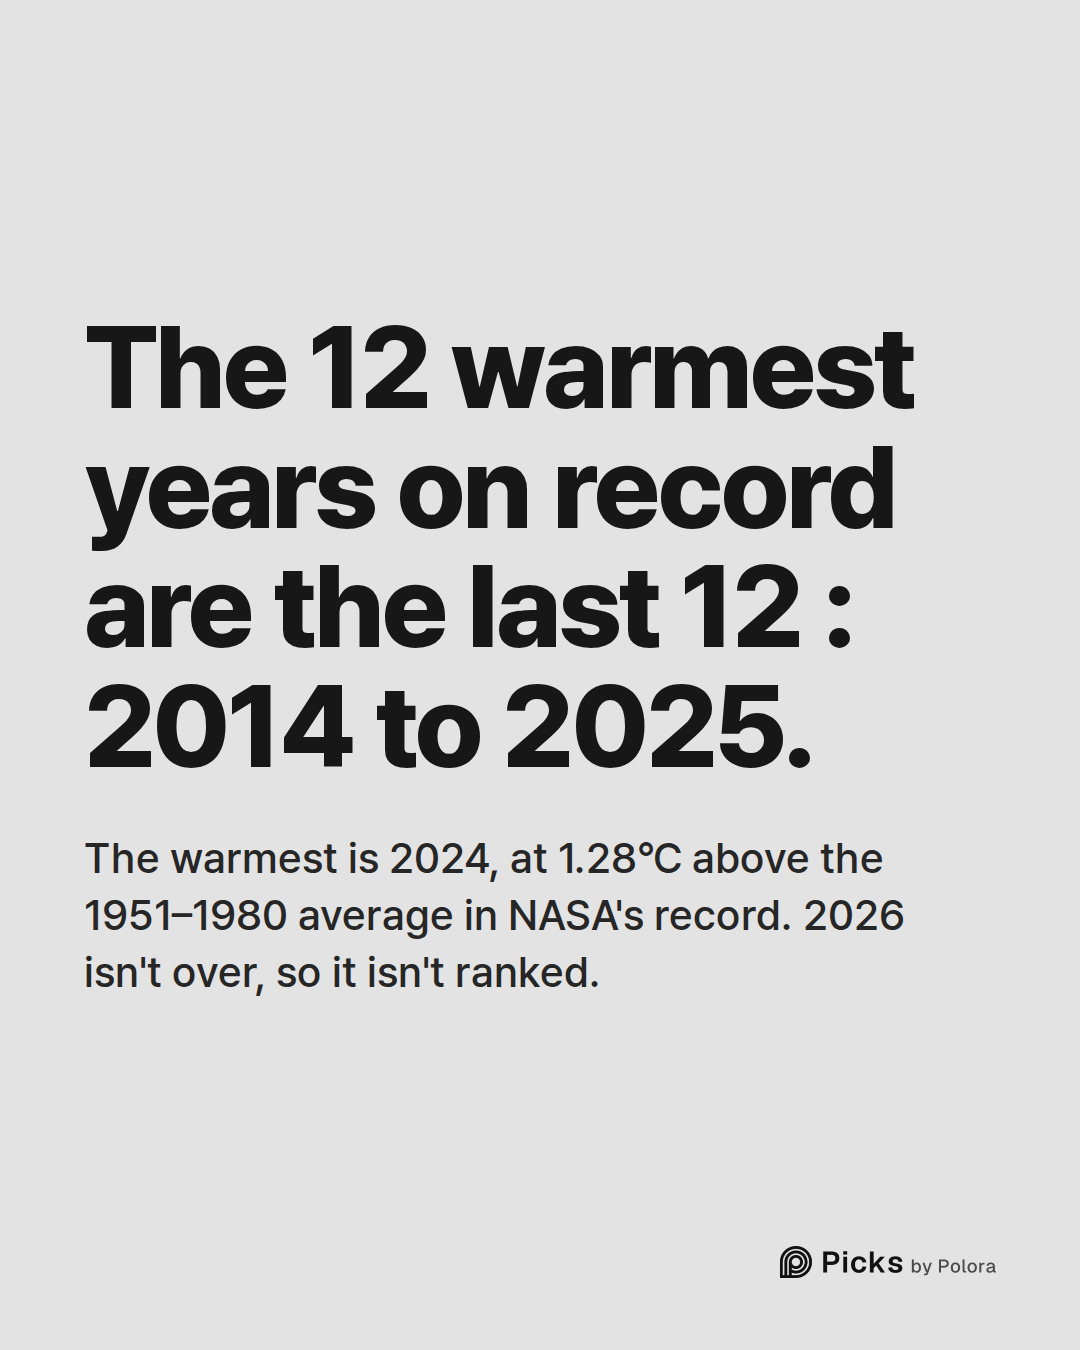
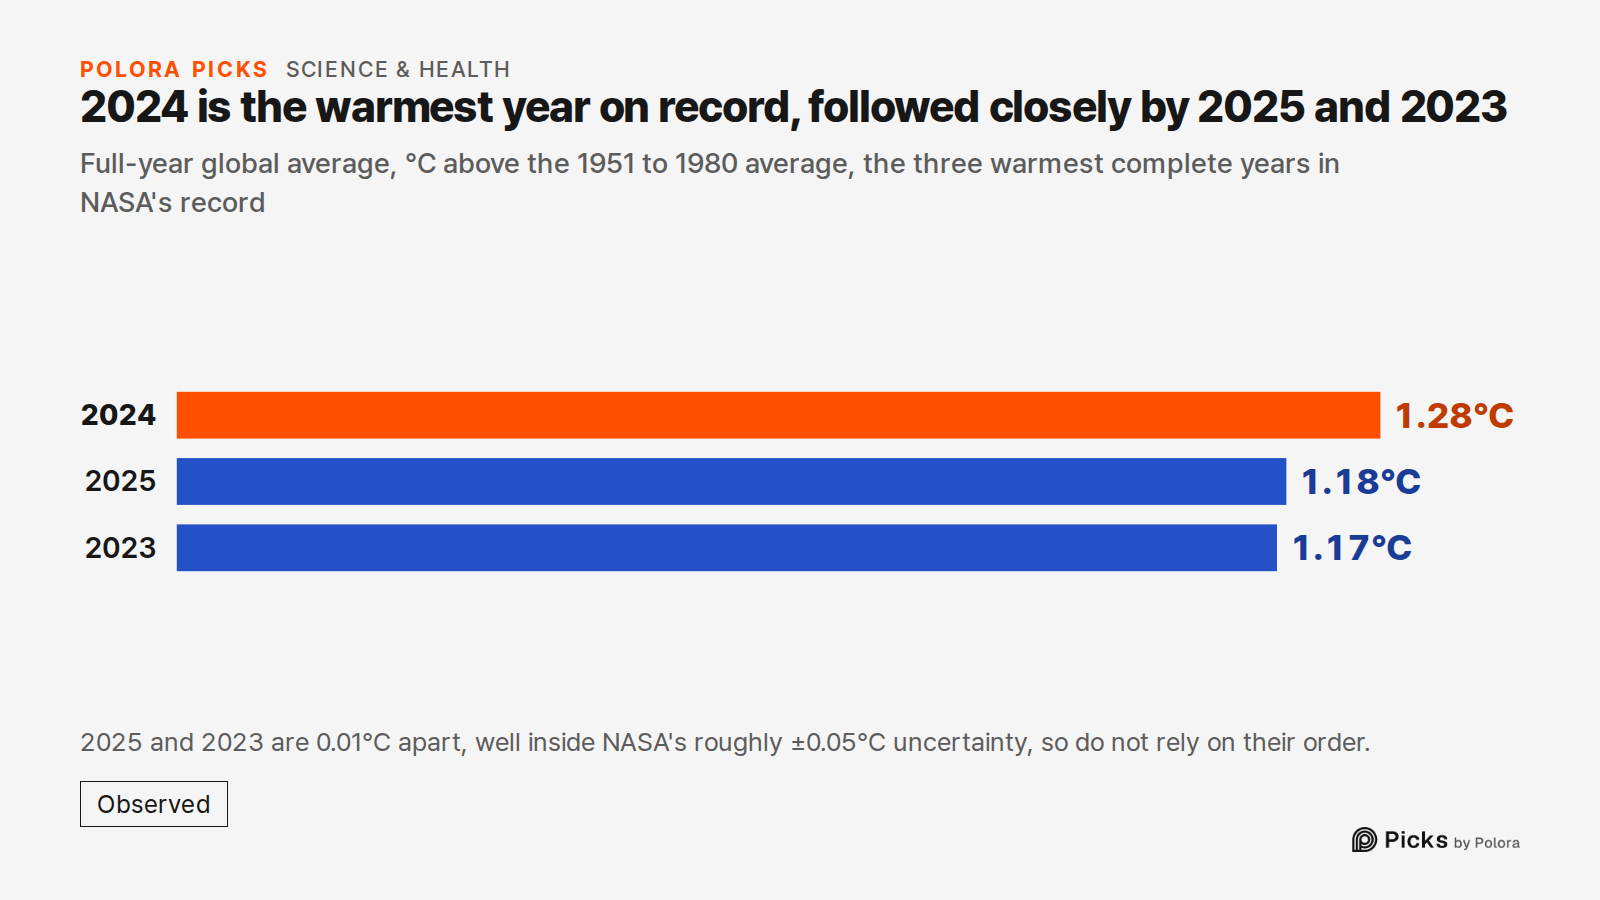
Ranked by full-year average, the 12 warmest years are exactly the last 12 complete ones, 2014 to 2025. The hottest is 2024, at 1.28°C (2.3°F) above the 1951–1980 average. Next come 2025 at 1.18°C and 2023 at 1.17°C. That 0.01°C gap is far smaller than the roughly ±0.05°C uncertainty NASA's FAQ gives for a single year's value after 1960, so their order should not be leaned on.
2026 isn't over, so it isn't ranked. To compare like with like, take January to September only. 2026 averaged 1.23°C over those nine months, below 2024's 1.28°C and above 2025's 1.20°C.
The 1951–1980 baseline is not "pre-industrial." In the same January 2025 release, NASA estimated that 2024 was about 1.47°C warmer than the 1850–1900 average, the baseline usually meant when people talk about the Paris Agreement's long-term 1.5°C goal. NASA labels that figure an estimate. It is less certain than the numbers measured against 1951–1980.
How firm this is
These are estimates, not single readings from one thermometer. NASA updates the series every month. Late reports and corrections can shift earlier months slightly, so the 2026 values, and with them the July and August records, could still change a little. Other groups that track global temperature, including NOAA, Berkeley Earth, the UK Met Office's Hadley Centre and Copernicus in Europe, use much of the same raw data but different methods. They all agreed 2024 was the warmest year. This piece did not compare their month-by-month rankings with NASA's.
The values come from NASA's published series. The comparisons, rankings and margins were calculated by Polora from those values.
- [NASA GISS, GISS Surface Temperature Analysis (GISTEMP v4), global land-ocean monthly means, accessed 2026-10-21; Lenssen et al. 2024, J. Geophys. Res. Atmos., doi:10.1029/2023JD040179]
- [NASA GISS, GISTEMP v4 overview and citation page]
- [NASA GISS, GISTEMP frequently asked questions]
- [NASA, "Temperatures Rising: NASA Confirms 2024 Warmest Year on Record," January 10, 2025]