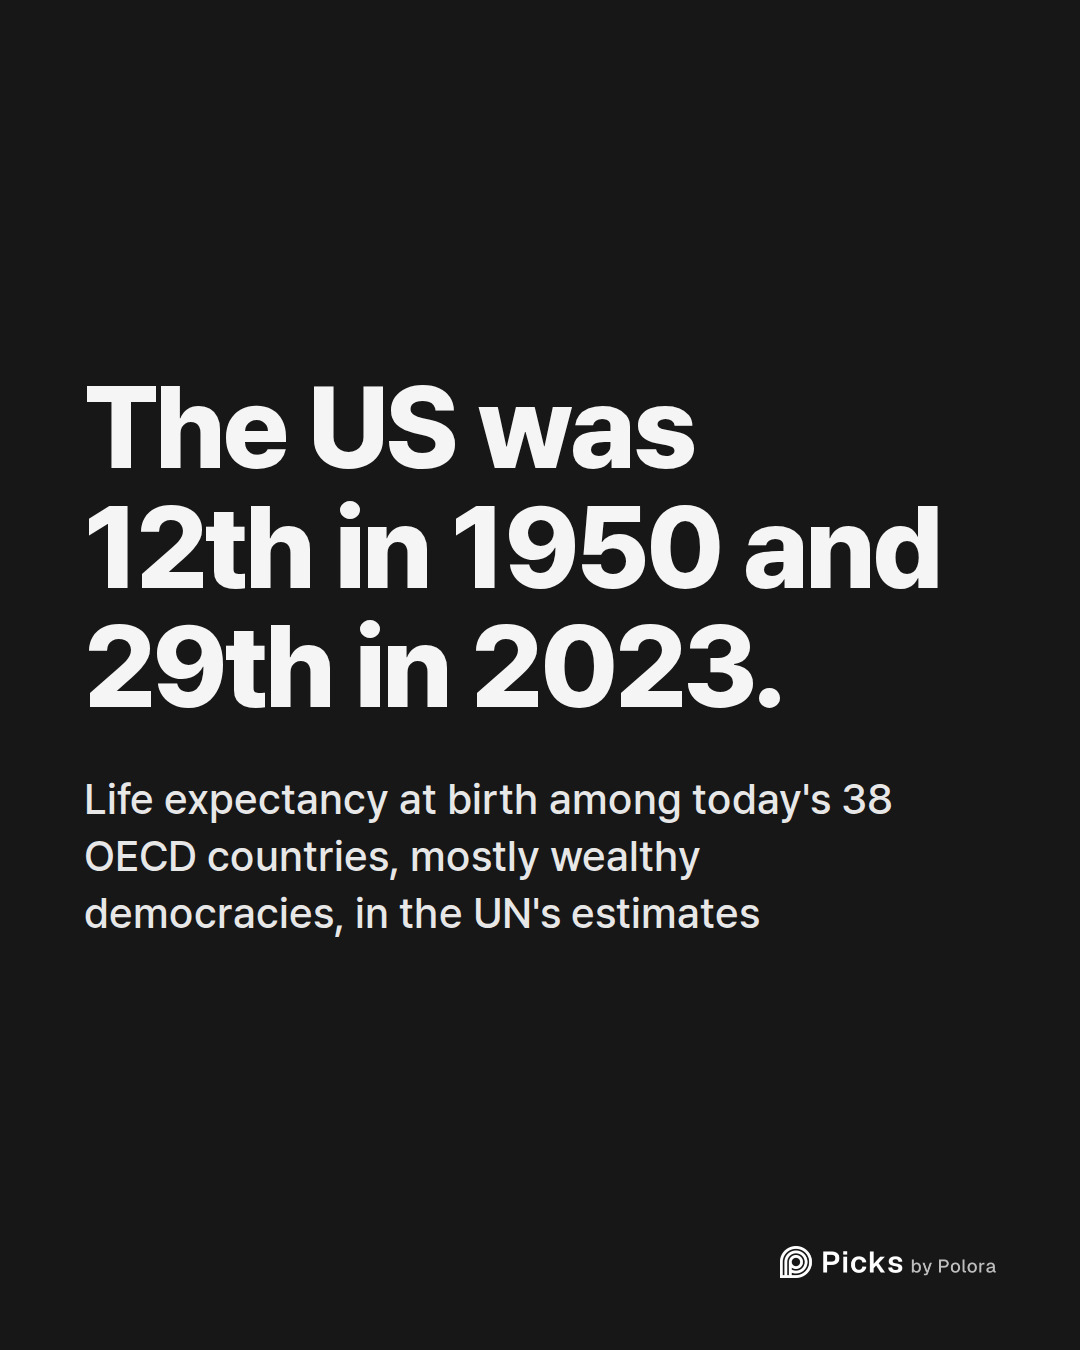
The US was 12th in 1950 and 29th in 2023
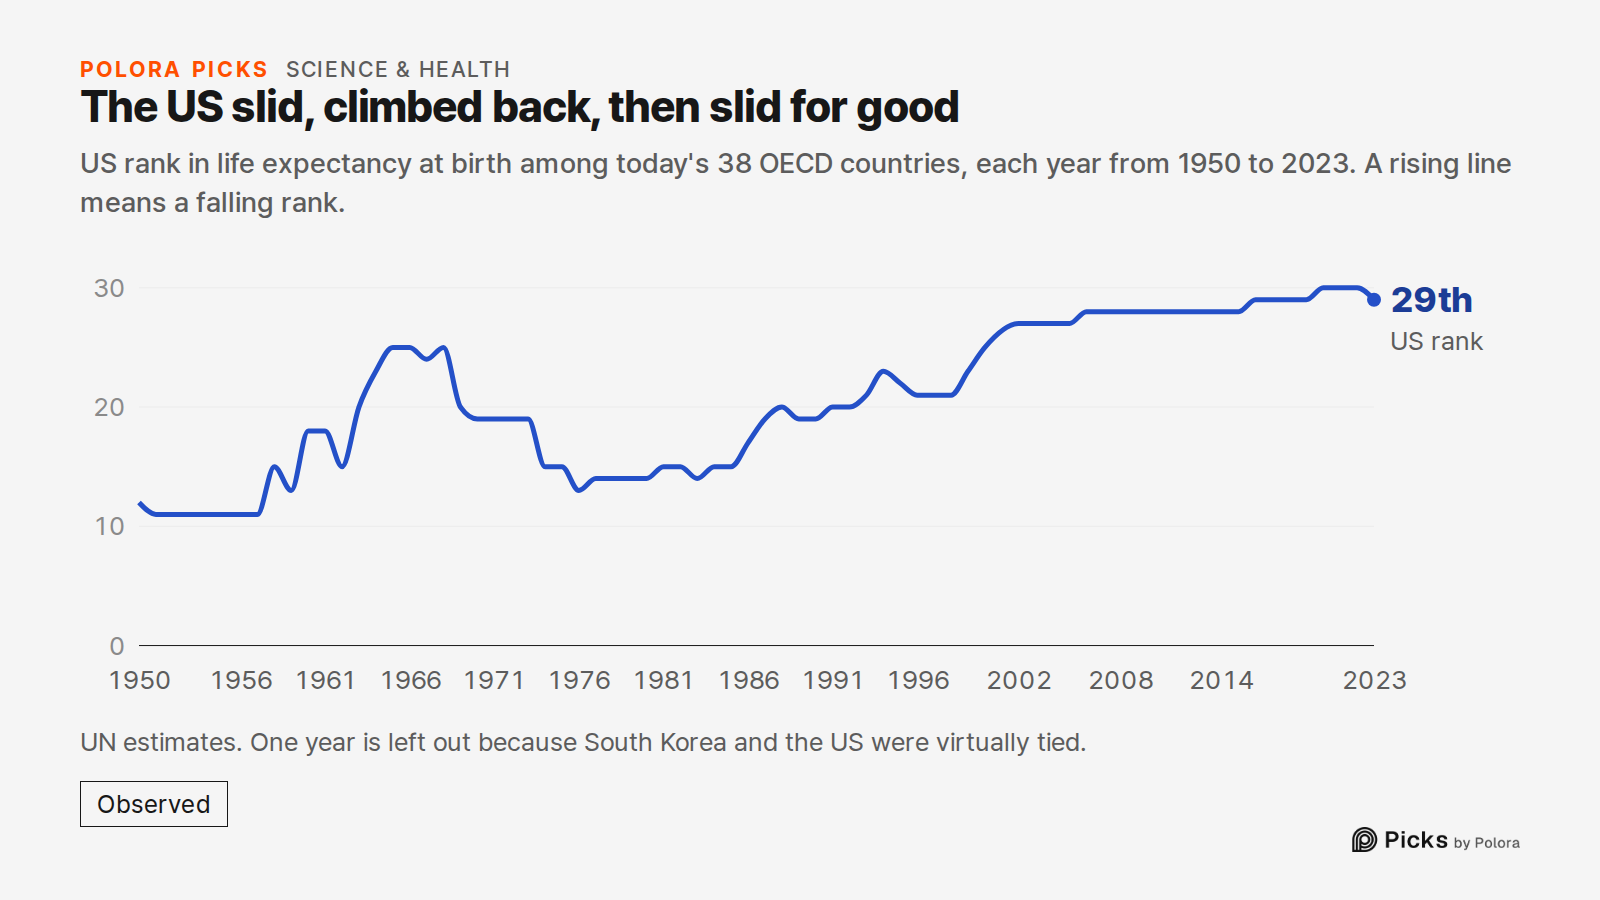
The OECD is a club of 38 mostly wealthy democracies, from Japan and Germany to Chile and Mexico. Take today's members, line them up by life expectancy at birth each year since 1950, and follow the US.
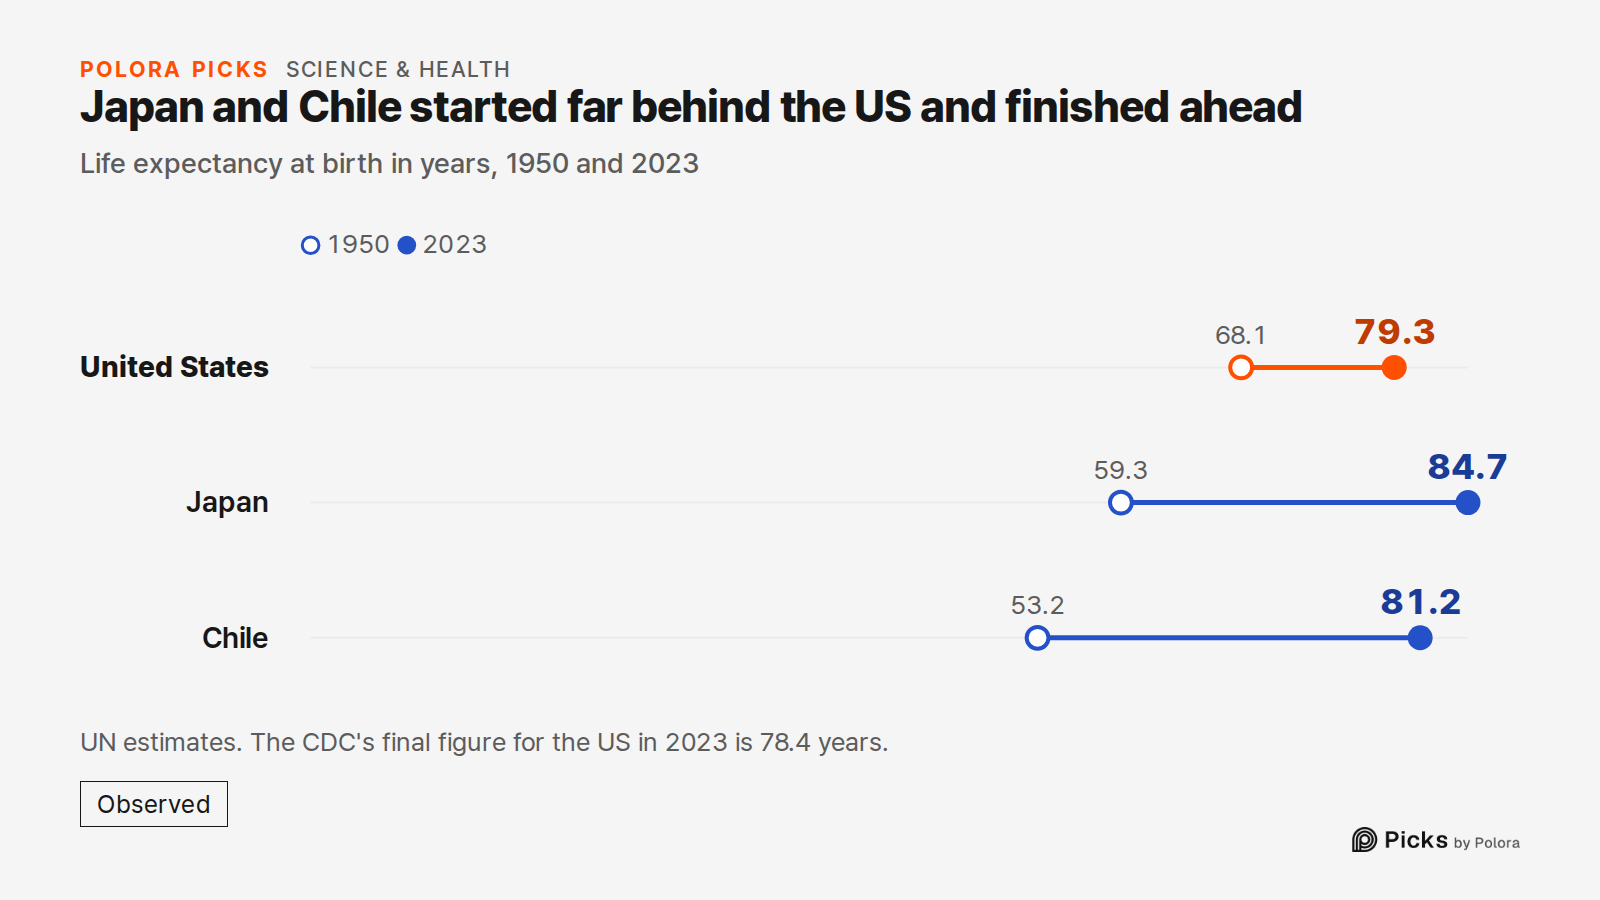
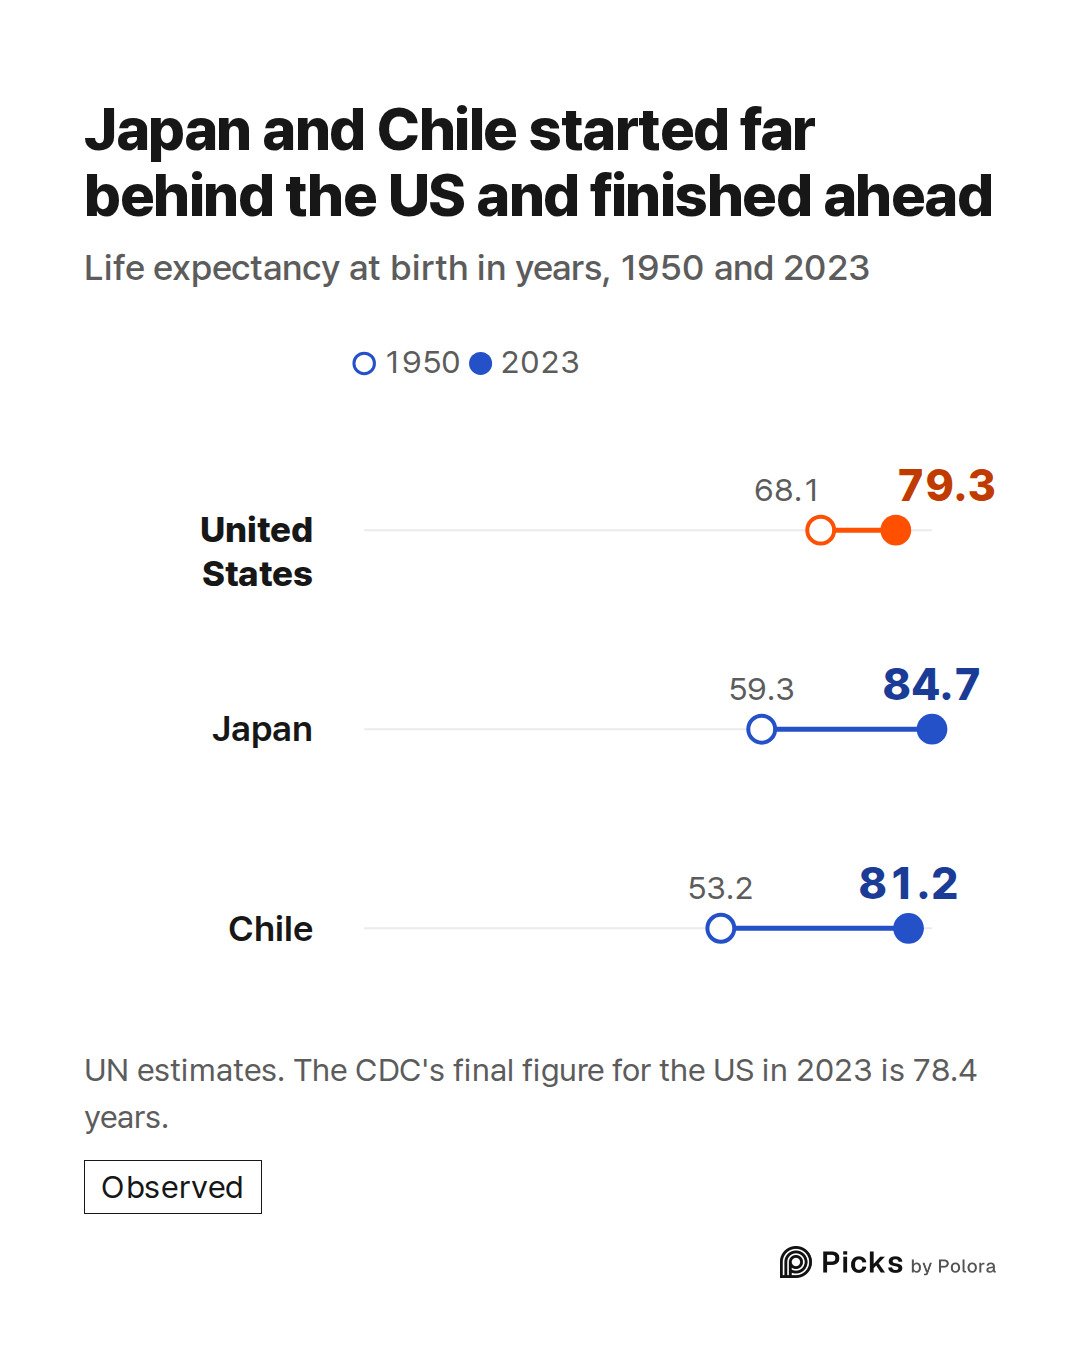
In 1950 the US stood 12th, at 68.1 years. Only 11 countries were ahead of it : Australia, Canada, Denmark, Iceland, Israel, the Netherlands, New Zealand, Norway, Sweden, Switzerland and the UK. Japan was 8.8 years behind. Chile was 14.9 years behind.
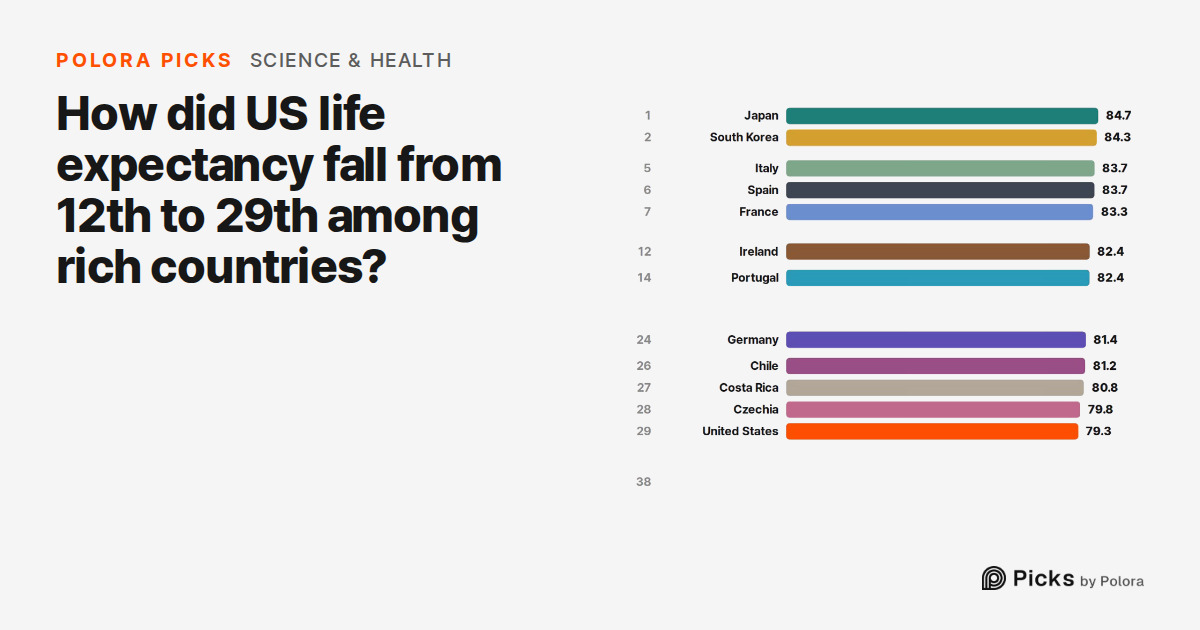
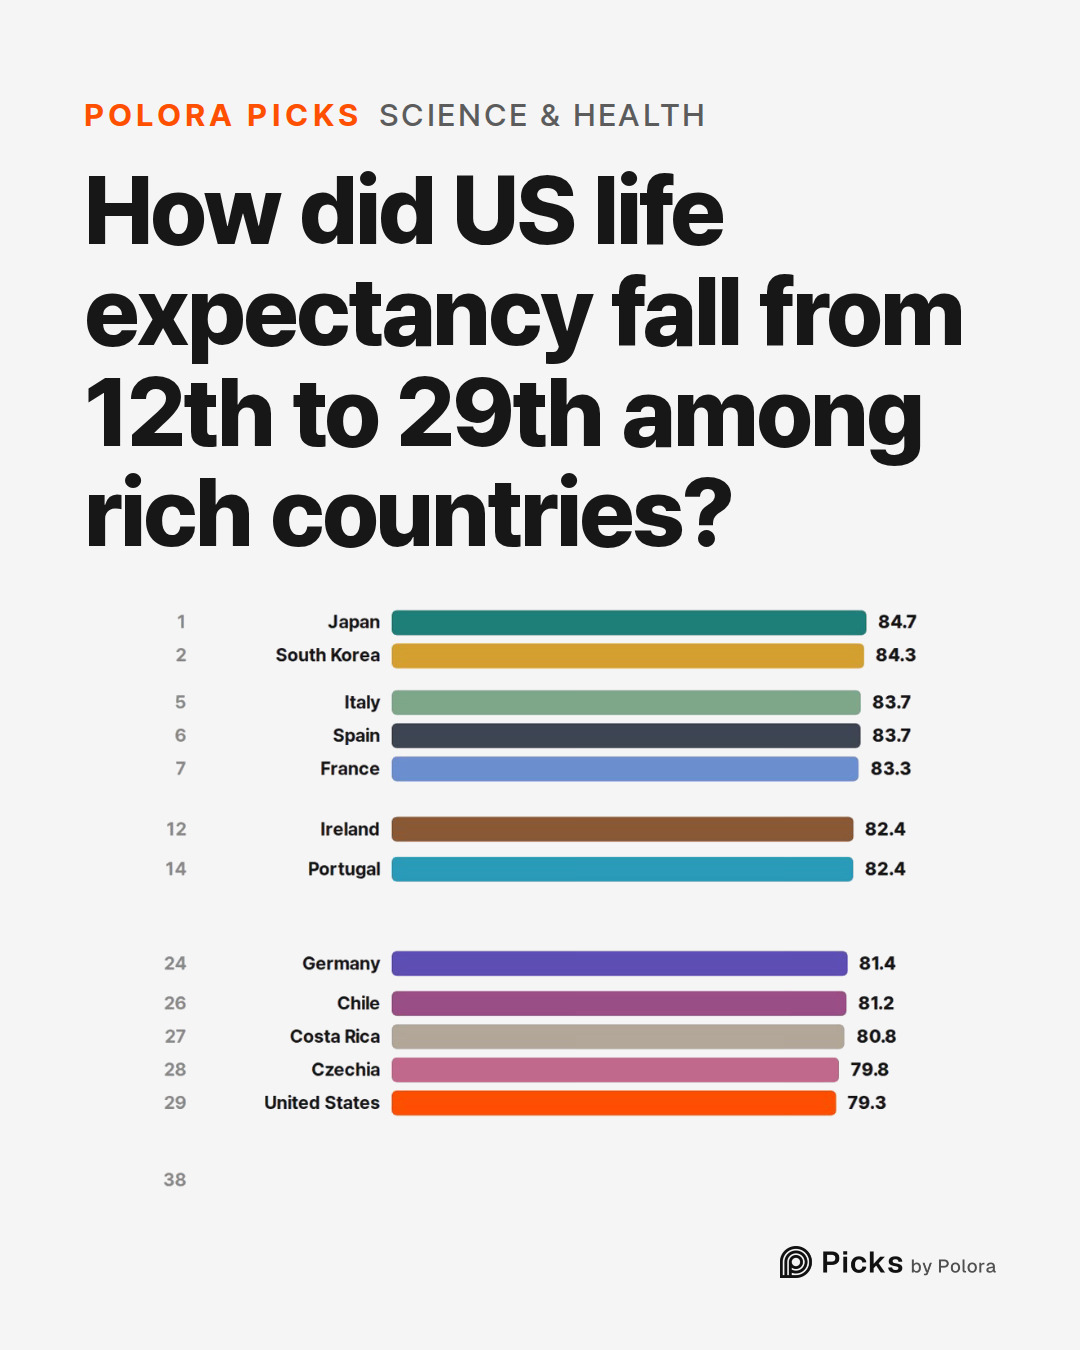
In 2023 the US stood 29th, at 79.3 years. All 11 countries that led it in 1950 were still ahead, and 17 more had joined them. Japan was now first and South Korea second. Only 9 countries were still behind the US : Colombia, Estonia, Hungary, Latvia, Lithuania, Mexico, Poland, Slovakia and Turkey.
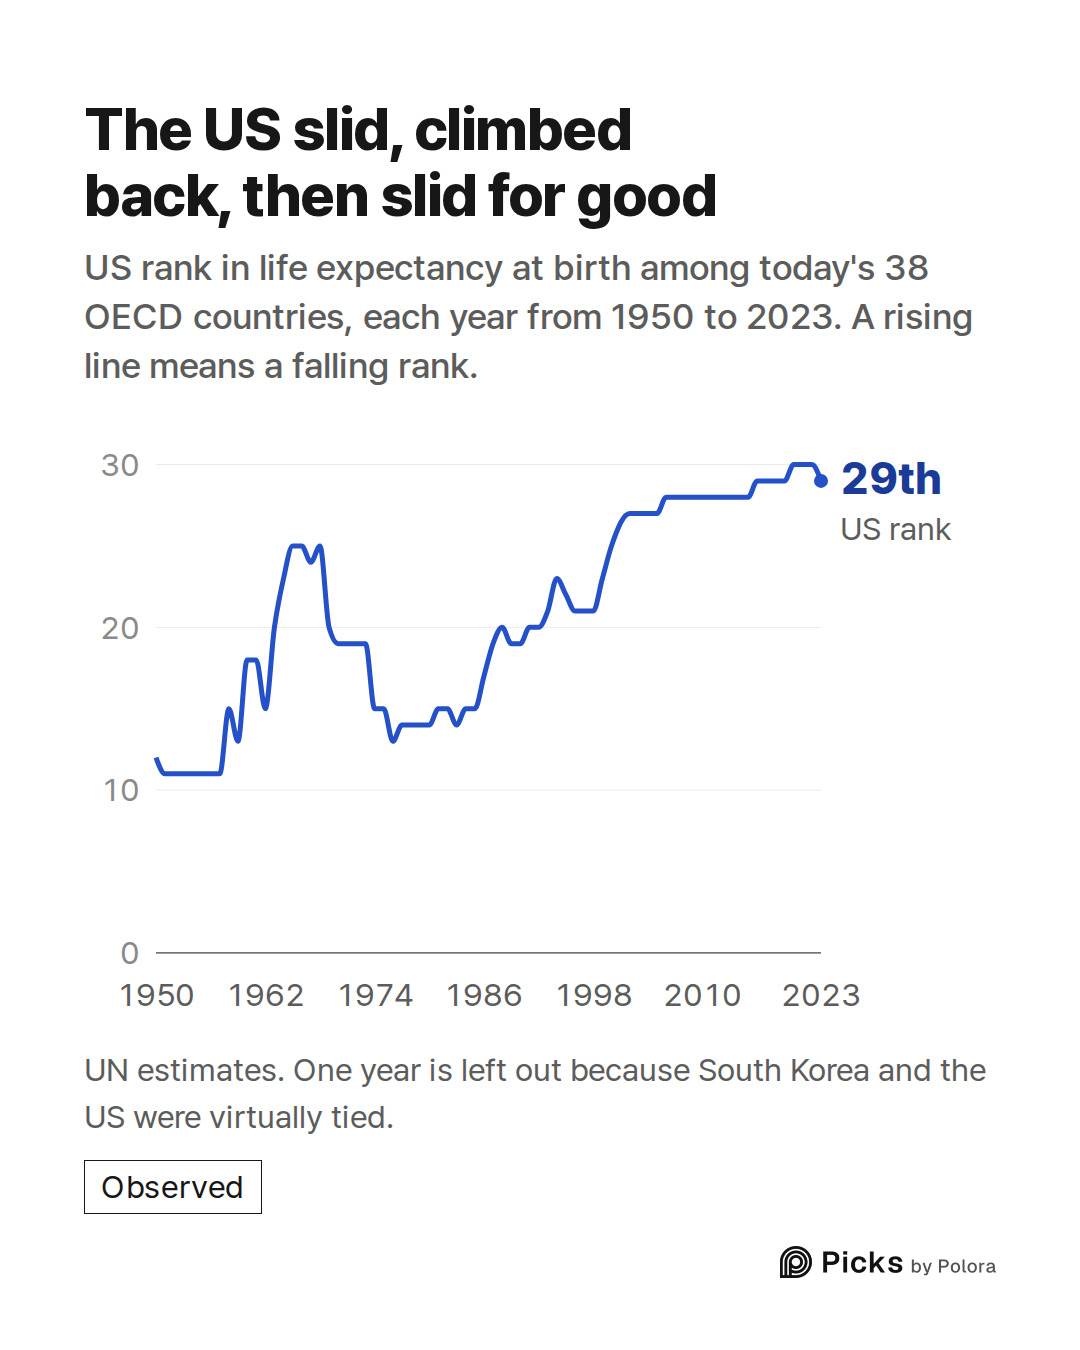
The US did not fall in a straight line
The slide came in stages.
From the late 1950s to the mid-1960s, American life expectancy stalled near 70 years. France moved ahead in 1958, then Italy and Spain in 1964 and Japan in 1965. By 1966 the US was 25th.
Then it recovered. Between 1966 and 1976 US life expectancy rose 2.6 years, faster than in 27 of the 37 other countries, and the US climbed back to 13th.
From the late 1970s the slide in rank resumed, and this time no recovery lasted. Costa Rica passed the US in 1985, Germany in 1991, Chile in 1999. Portugal, Ireland and South Korea had passed by 2002, and Czechia in 2016. For Germany and Czechia it was not the first time. Czechia had first edged past the US in 1958 and Germany in 1963, and both had fallen back, more than once, before the passing that has held through 2023. By 2018 the US was 29th.
The film that accompanies this piece names the countries above, but they were not the only ones to pass the US. Greece, Austria, Belgium, Finland, Luxembourg and Slovenia also moved ahead and were still ahead in 2023.
Then came COVID. Between 2019 and 2021 US life expectancy fell 2.5 years, from 78.9 to 76.4, and the US dropped to 30th. By 2023, in the UN's estimates, it had recovered to 79.3 years and 29th place.
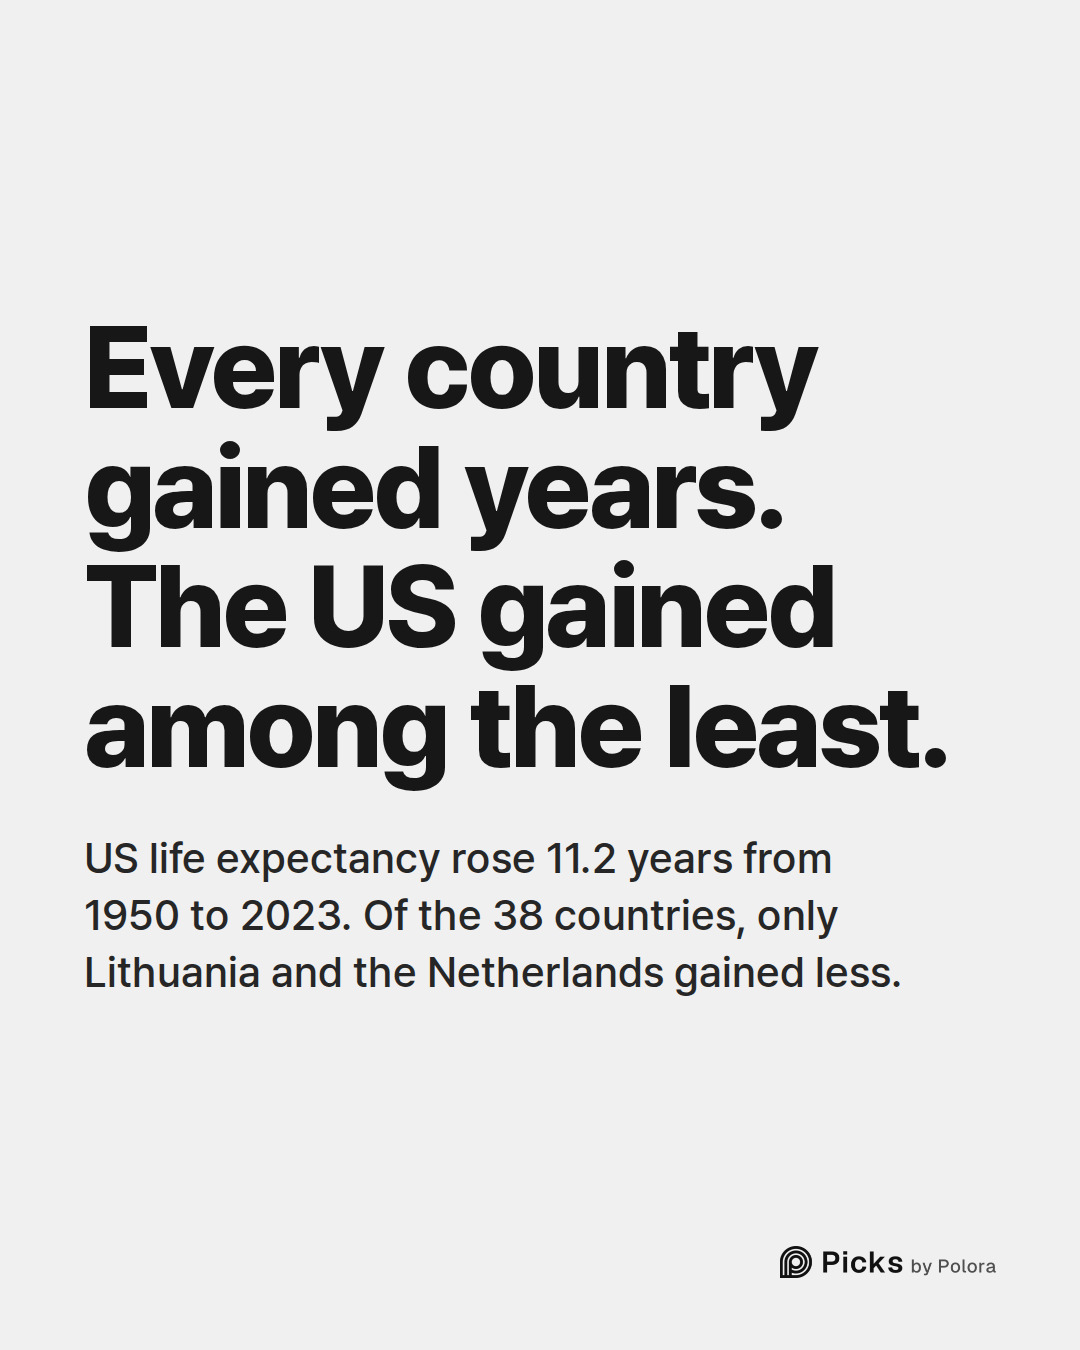
Every country gained years. The US gained among the least
Over the whole span the US did not go backwards. Between 1950 and 2023 its life expectancy rose by 11.2 years. But of the 38 countries, only Lithuania and the Netherlands gained less, and the Netherlands started out ahead of the US. Japan gained 25.5 years, rising from 59.3 to 84.7. Chile rose from 53.2 to 81.2.
So the fall in rank is a story of others catching up and moving past, while American gains came more slowly.
Why the US fell behind
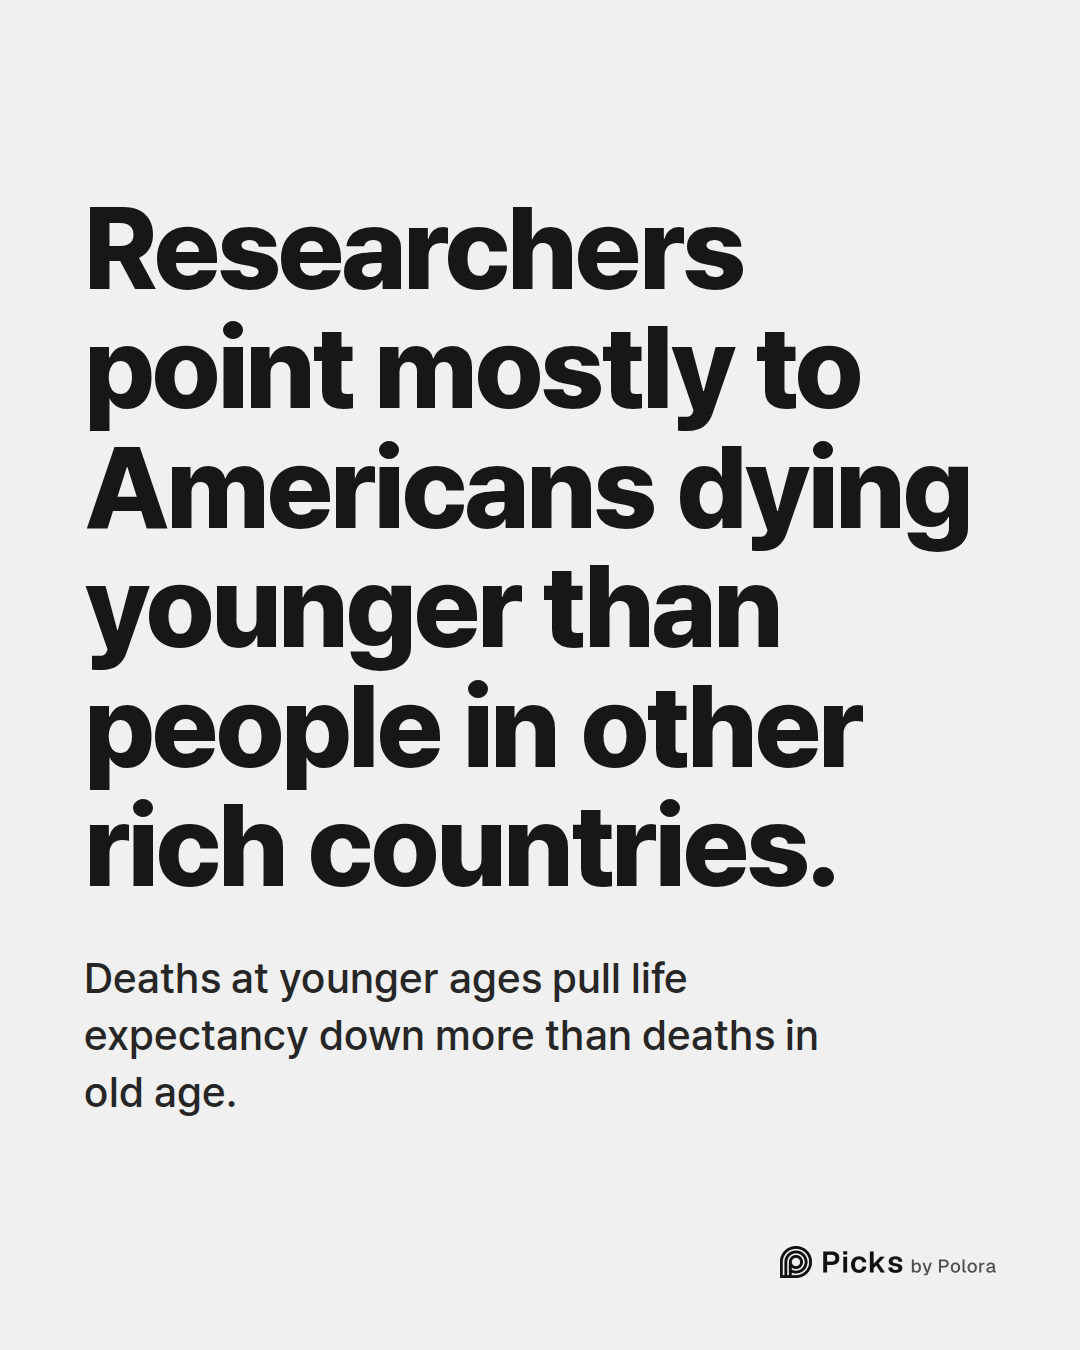
The data in the film shows when countries passed the US, not why. For the why, researchers point mostly to Americans dying younger than people in other rich countries.
A 2025 analysis by KFF and the Peterson Center on Healthcare compared the US with a group of large, wealthy countries, among them Japan, Germany, France, Canada and the UK. It found that life expectancy in the US was similar to theirs in 1980, then rose more slowly through the following decades. Deaths at younger ages pull life expectancy down more than deaths in old age, and that is where the US stands out. Death rates for younger American adults stayed close to their 1980 level while they fell steeply in the comparison countries.
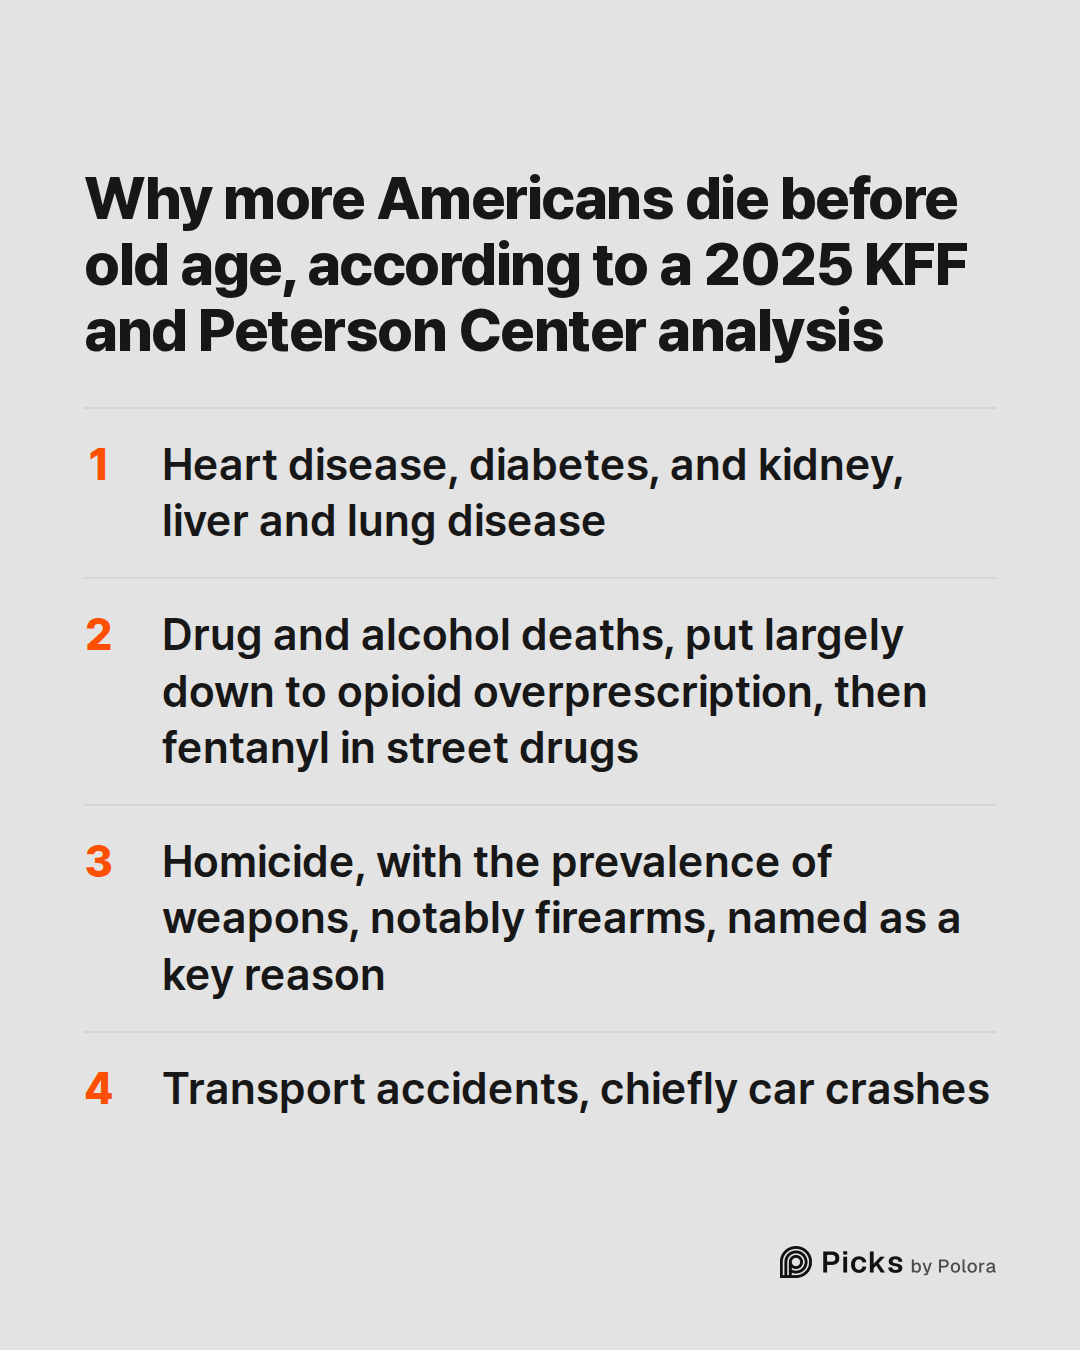
The analysts name several causes. Americans more often die before old age from heart disease, diabetes, and kidney, liver and lung disease. Deaths from drugs and alcohol have soared, which they put largely down to the overprescription of opioids and then fentanyl in street drugs. Homicide and transport accidents, chiefly car crashes, also kill young Americans at far higher rates than young people in peer countries. For homicide, the analysts name the prevalence of weapons, notably firearms, as a key reason.
For the COVID years, the CDC's National Center for Health Statistics gives its own accounting. It says US life expectancy fell in 2020 largely because death rates rose from COVID, unintentional injuries, heart disease, homicide and diabetes. From 2022 to 2023 it rose, largely because death rates fell from COVID, heart disease, unintentional injuries, cancer and diabetes.
What the numbers measure
The figures are period life expectancy at birth. That is not how long anyone actually lives. It is how long a newborn would live if the death rates of that one year stayed the same all their life, so it is a snapshot of a year's health, not a forecast.
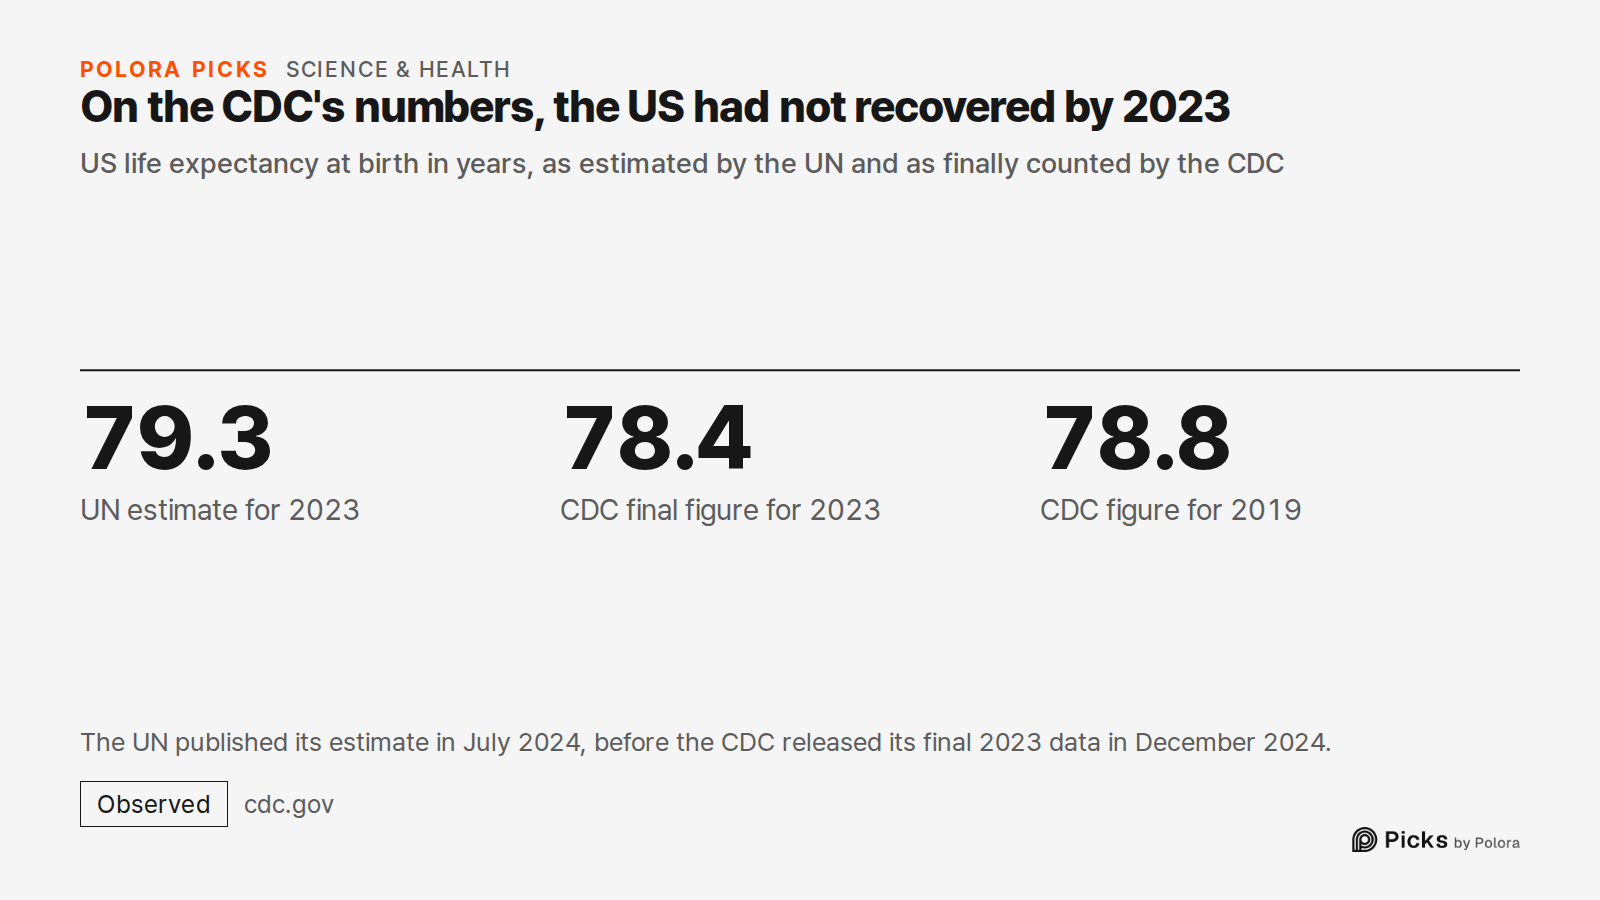
They are the UN Population Division's estimates, from World Population Prospects 2024. They come from one UN compilation that covers every country, which is what makes a ranking possible. But they are estimates, and for the latest years they can differ from a country's own final figures. The CDC's final figure for the US in 2023 is 78.4 years, lower than the UN's 79.3. The UN released this edition in July 2024, months before the CDC published its final 2023 data in December 2024. On the CDC's numbers, US life expectancy in 2023 was still below its 2019 level of 78.8.
The exact ranks depend on the source too. The World Bank, which uses national statistics offices' figures for many rich countries, puts the US 30th in 2023 rather than 29th, and 15th in 1976 rather than 13th. The shape is the same in both : a short recovery, then a long slide.
The comparison uses today's 38 OECD members for every year, including countries that joined the OECD decades later. The UN's series cover each of them from 1950. For South Korea, the film measures the gap from 1956, when it was 19.4 years behind the US, after the Korean War, which broke out in June 1950 and ended in an armistice in July 1953.
- UN DESA Population Division, World Population Prospects 2024]
- UN Population Division, wpp2024 data package and release notes]
- Our World in Data, Life expectancy at birth (UN WPP 2024)]
- Our World in Data, Life expectancy]
- World Bank, Life expectancy at birth, total (years)]
- CDC National Center for Health Statistics, Mortality in the United States, 2020]
- CDC National Center for Health Statistics, Mortality in the United States, 2023]
- KFF and Peterson Center on Healthcare, What drives differences in life expectancy between the U.S. and comparable countries?]
![Sources 8 : population.un.org · UN DESA Population Division, World Population Prospects 2024], github.com · UN Population Division, wpp2024 data package and release notes], ourworldindata.org · Our World in Data, Life expectancy at birth (UN WPP 2024)] + 5](https://media.cdn.polora.ai/picks/2026/10/pickrun_2f22a1e0aea94109/FiJ9ify-CT1zYK89-slide-08--how-did-us-life.jpg)