What is being counted
The rate is the World Bank's total fertility rate : how many children a woman would have if she went through her childbearing years at that year's birth rates for each age. It describes one year, not how many children families end up with.
The UN calls 2.1 an approximate "replacement level" for populations where few children die young. Where more children die before adulthood, replacement takes more births. So 2.1 is a reference line, not an exact threshold for every country.
The percentage, which this piece calls the counter, is Polora's own calculation, not a World Bank or UN figure. For each year, we took every country or economy with both a fertility rate and a population figure, added up the people in those below 2.1, and divided by the people in all of them. In 2023 that was 217 countries and economies, holding 99.7% of the World Bank's world population.
Why the share below 2.1 jumps in single years
The counter weighs countries by people, not land. The US went below 2.1 in 1972, and the UK, France, Italy and Spain followed between 1973 and 1981. By 1990, 54 countries and economies were below, including Canada, Japan and Russia. That was a lot of the map, but only 23.4% of the people counted.
Then China's rate went from 2.51 in 1990 to 1.93 in 1991. China held 21.4% of the people counted, so the counter went from 23.4% to 44.7% in one year. The world did not suddenly have far fewer children : the World Bank's world rate went only from 3.31 to 3.13. One country holding a fifth of the people had moved to the other side of the line.
Brazil crossed in 2002 and Mexico in 2016, but by 2019 the 110 countries and economies below 2.1 still held under half the people counted (48.6%). In 2020 India's rate fell from 2.12 to 2.05. It held 17.9% of the people counted, and the Philippines, Tunisia and Belize crossed the same year. Mostly because of India, the counter went from 48.6% to 67.7%.
By 2023 the two giants had moved apart. China was at 1.00; among countries of more than 50 million people, only South Korea (0.72) was lower. India was at 1.98, still close to the line.

Why the share below 2.1 sometimes falls
Countries near the line can cross back, and when a big one does, the counter drops.
Japan, 1960s : it hovered around 2.1, going above in 1965 (the counter fell from 5.6% to 2.8%) and again from 1967 to 1973. From 1974 through 2023 it stayed below.
Russia, 1980s : it went back above in 1983 and from 1986 to 1988. In 1986 Ukraine, Latvia and Lithuania went back above as well, and together they account for most of the counter's fall from 22.6% to 18.2%.
The US, 2006–07 : back at 2.1 or more (2.12 in 2007). Its return in 2006 accounts for most of the counter's fall from 46.9% in 2005 to 42.2% in 2006. From 2008 through 2023 it stayed below, reaching 1.62.

Two-thirds below, yet the world is at 2.2
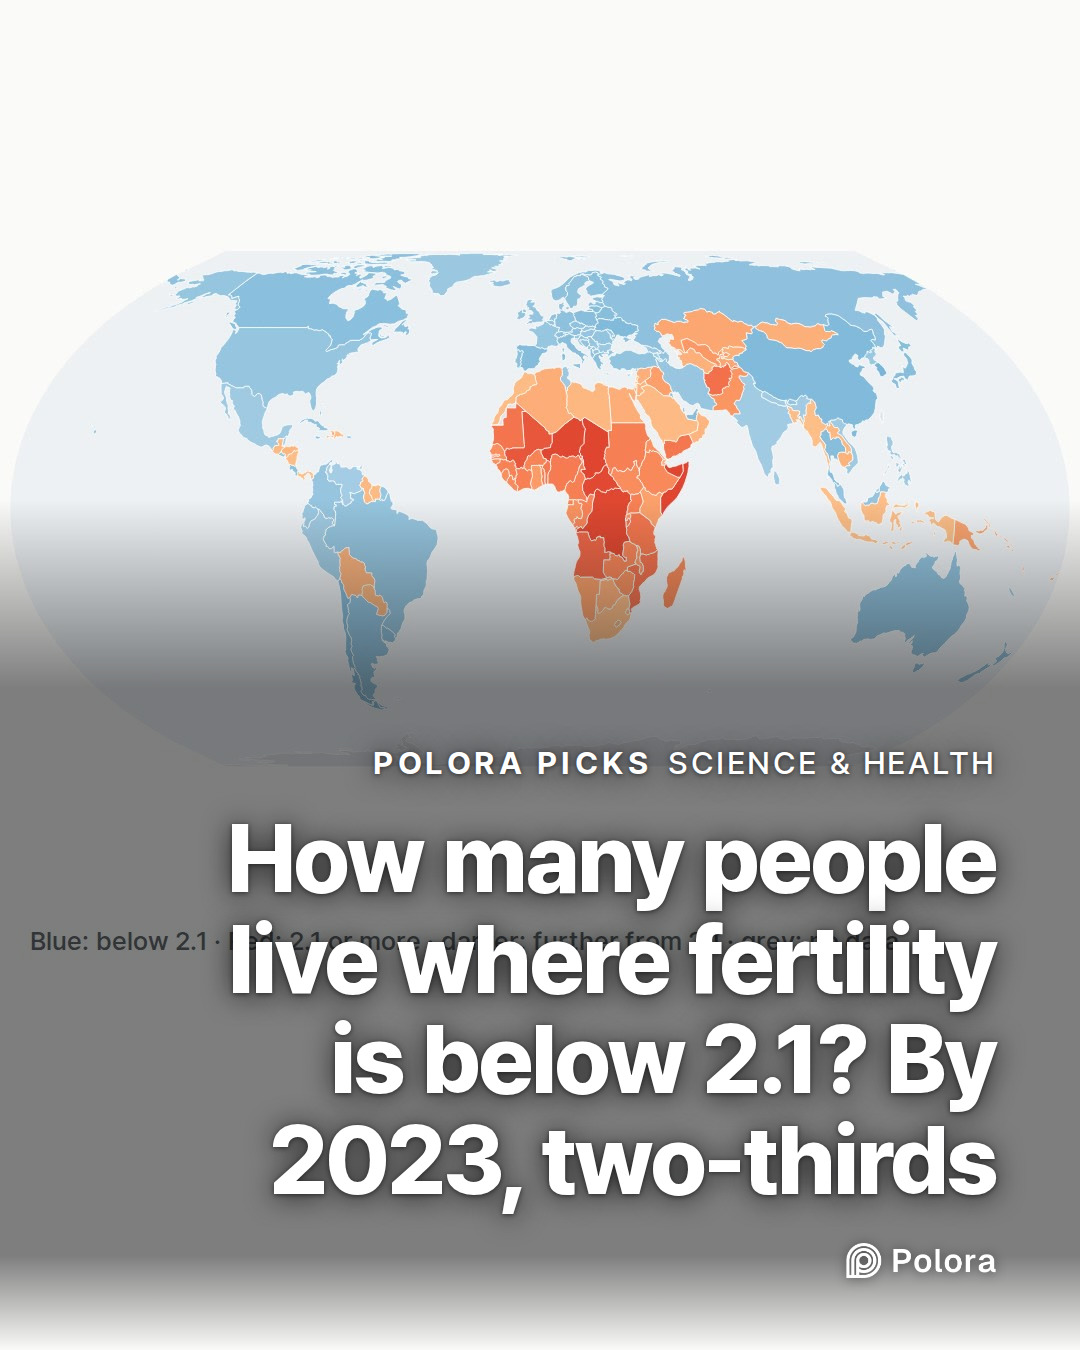
The World Bank's rate for the world fell from 4.7 in 1960 to 2.2 in 2023 : still above 2.1, though two-thirds of people live in countries below it.
The two numbers measure different things. The counter only records which side of the line each country is on : 1.0 counts the same as 2.0, and 6 the same as 2.2. The world rate depends on how high or low each rate is.
In 2023, 100 of the 217 countries and economies were still at 2.1 or more, 46 of them in sub-Saharan Africa, where only 2 of 48 were below. Nigeria was at 4.48 and Pakistan at about 3.6. The 26 countries at 4 or more held 11.3% of the people counted.

Below 2.1 does not mean shrinking yet
A population doesn't necessarily start shrinking when its rate drops below 2.1. The UN calls the reason momentum : where past growth left many young people, the number of women of childbearing age keeps rising for years. Longer lives and immigration can also keep numbers up. But, the UN says, if fertility stays below replacement and there is no migration, each generation ends up smaller. Its 2024 report names China, Germany, Japan and Russia among the countries whose populations have already peaked.
Where the numbers stop
Estimates. The World Bank draws these rates from the UN's World Population Prospects, national statistical offices and Eurostat. Some are modelled estimates, and they get revised; a crossing as close to the line as India's could move. The piece stops at 2023 because the UN's 2024 edition treats later years as projections.
One year's rates. When women have children later in life, the yearly rate can drop further than the number of children they eventually have. Demographers call this the tempo effect.
A sharp line. A country at 2.09 and one at 2.11 sit on opposite sides, and each country's whole population moves with it. The counter shows where people live, not how fast fertility is falling.
The map uses modern borders for every year. Places with no World Bank figure, such as Taiwan, are grey.
- World Bank, Fertility rate, total (births per woman), SP.DYN.TFRT.IN (CC BY 4.0)
- World Bank, Population, total, SP.POP.TOTL (CC BY 4.0)
- World Bank country list, used to leave out regional totals
- UN DESA Population Division, World Population Prospects 2024: Summary of Results (replacement level, momentum, countries already peaked)
- Wikipedia, Total fertility rate (tempo effect, replacement where child mortality is higher)
- Natural Earth, map boundaries (public domain)