What actually happens to the plastic you put in the recycling bin?

Most of it does not become new plastic. The bin sends it to be sorted, and only plastic that someone will buy, mostly clear drink bottles and milk jugs, gets made into something new. Worldwide, about 9 percent of all plastic waste was recycled in 2019.

Science & Health · 2026-10-03

The recycling bin sends plastic to be sorted, not to be recycled

Ask most people what happens to a yogurt tub after it goes into the recycling bin, and they will say it gets recycled. In most cases that is not what happens. The bin is only the first step. A truck takes everything to a sorting plant, where the plastic is separated by type and pressed into large bales. A bale becomes new material only if a recycler can use it and wants to buy it. Plastic rejected during sorting or processing ends up burned, buried or otherwise thrown away. Some is shipped abroad, which changes where it goes but does not show that it was recycled.

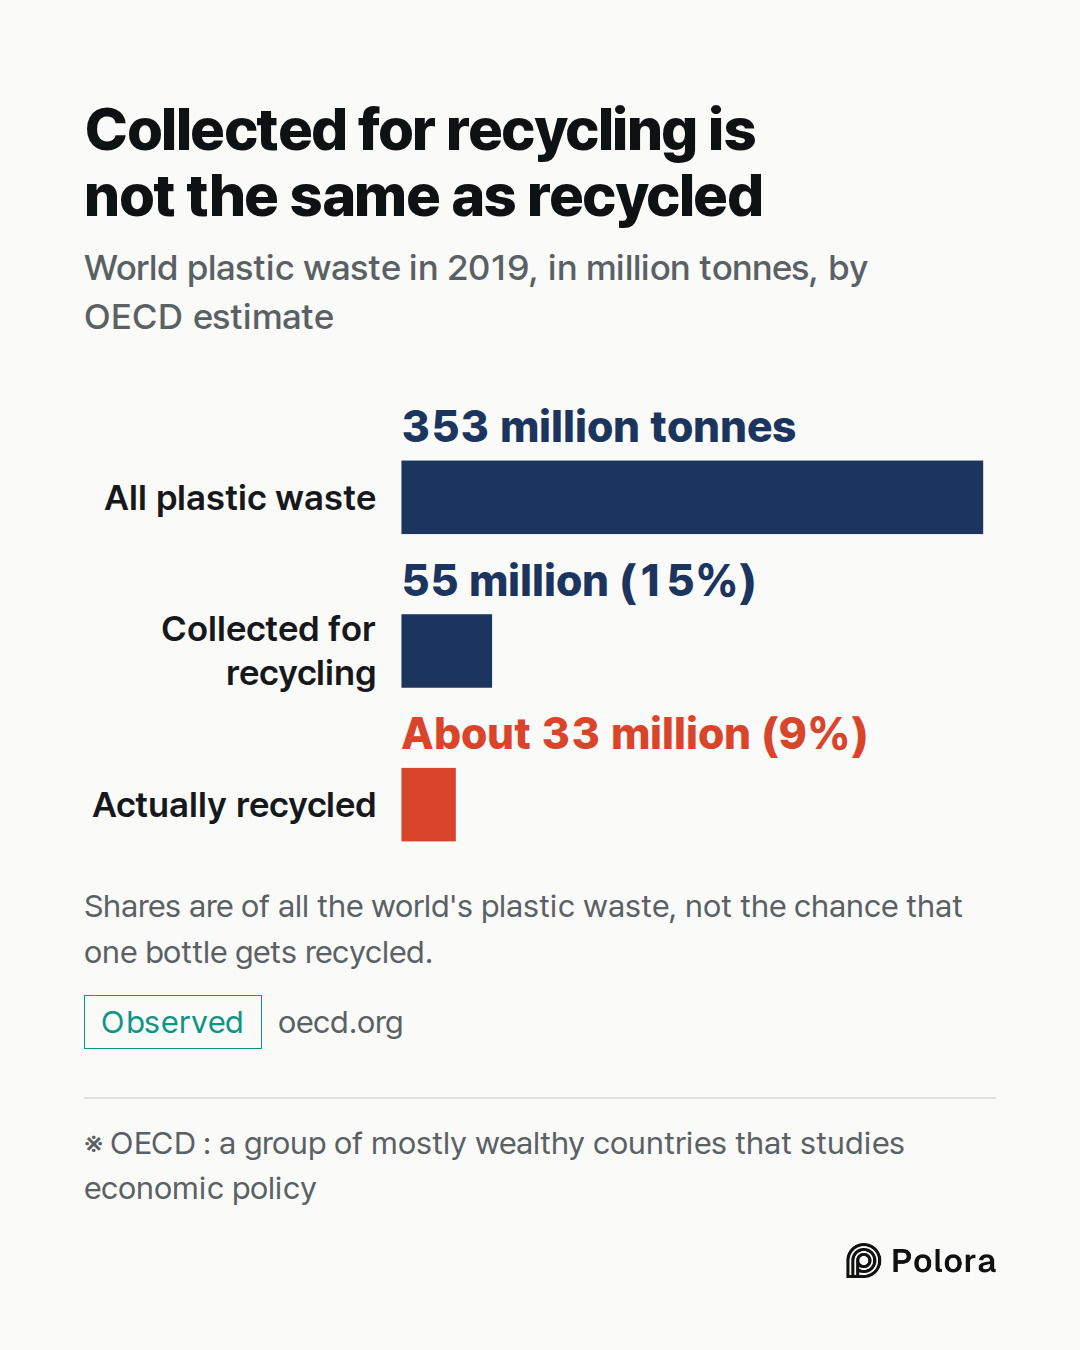
This is why the amount collected and the amount recycled are two different numbers. The OECD, a group of mostly wealthy countries that studies economic policy, looked at the world's plastic waste for 2019. Of 353 million tonnes, 55 million, or 15 percent, were collected for recycling. Of those, 22 million were thrown out again during processing because they could not be used. In the end about 33 million tonnes, or 9 percent of the world's plastic waste, was recycled. About 19 percent was burned, nearly half went to landfill, and 22 percent ended up in open dumps, was burned in the open or leaked into the environment.

That 9 percent is a share of all the plastic waste in the world. It is not the chance that one bottle in one bin gets recycled, but it shows how wide the gap between collecting and recycling can be.
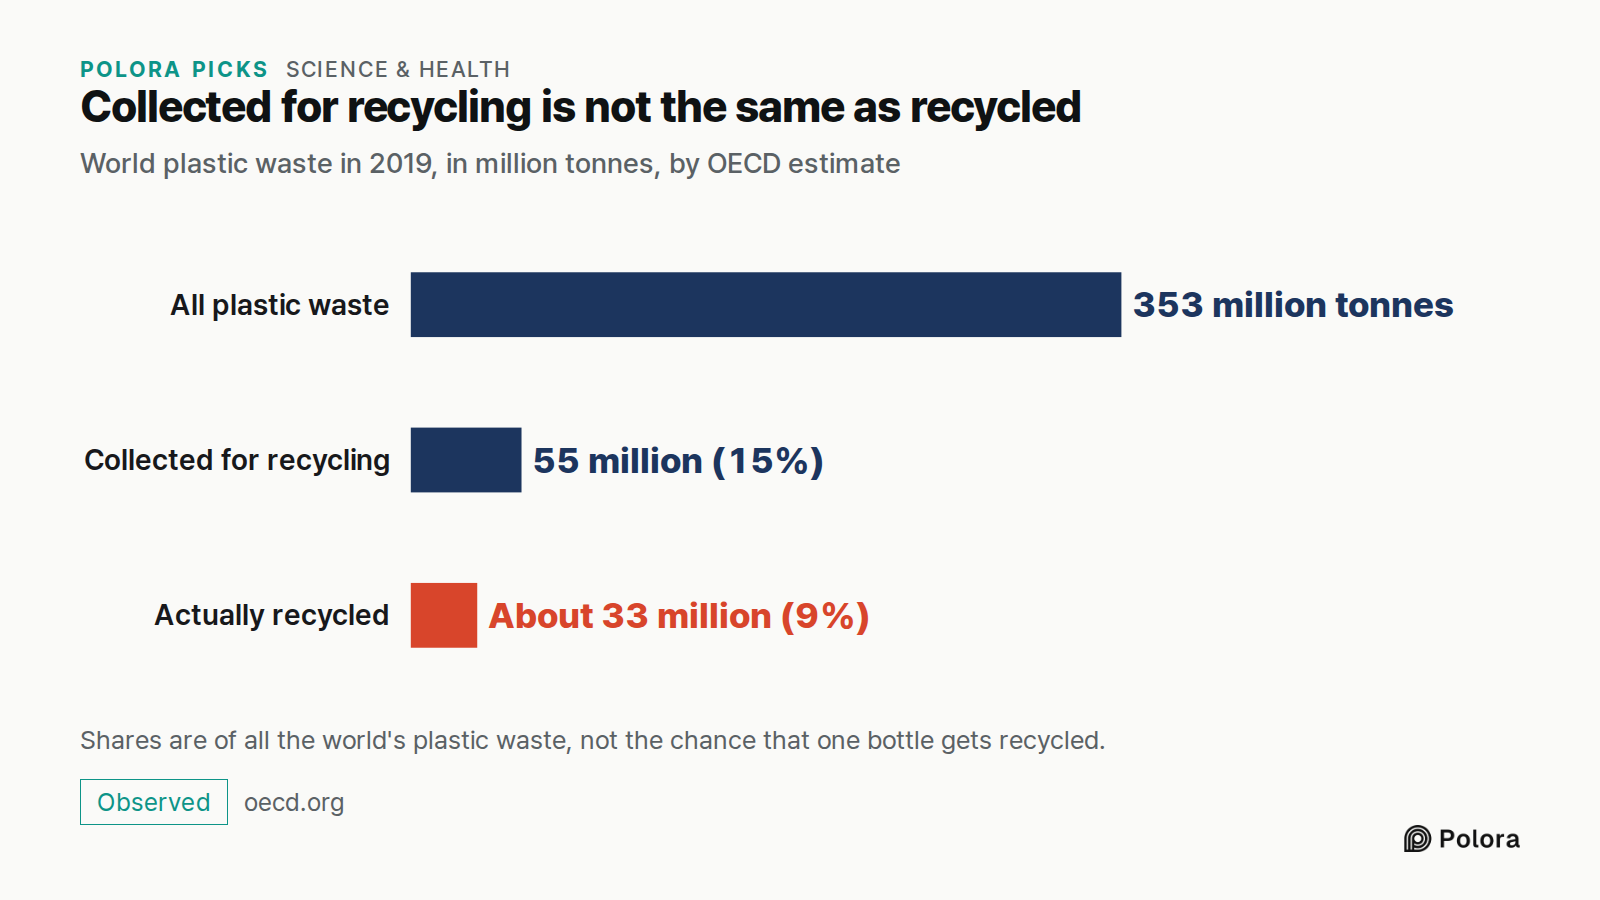
Collected for recycling is not the same as recycled · World plastic waste in 2019, in million tonnes, by OECD estimate · All plastic waste · Collected for recycling · Actually recycled · 353 million tonnes · 55 million (15%) · About 33 million (9%) · Shares are of all the world's plastic waste, not
World plastic waste in 2019, in million tonnes, by OECD estimate

Which plastic actually comes back as new plastic?

It depends on what the item is made of. Clear drink bottles (a plastic called PET) and milk jugs (a plastic called HDPE) are simple, and there are buyers for them. Tubs, trays, plastic film and packaging made of several plastics stuck together are accepted in some places and not in others. Whether they are recycled depends on the plastic, the shape, how clean the item is and where it was collected.

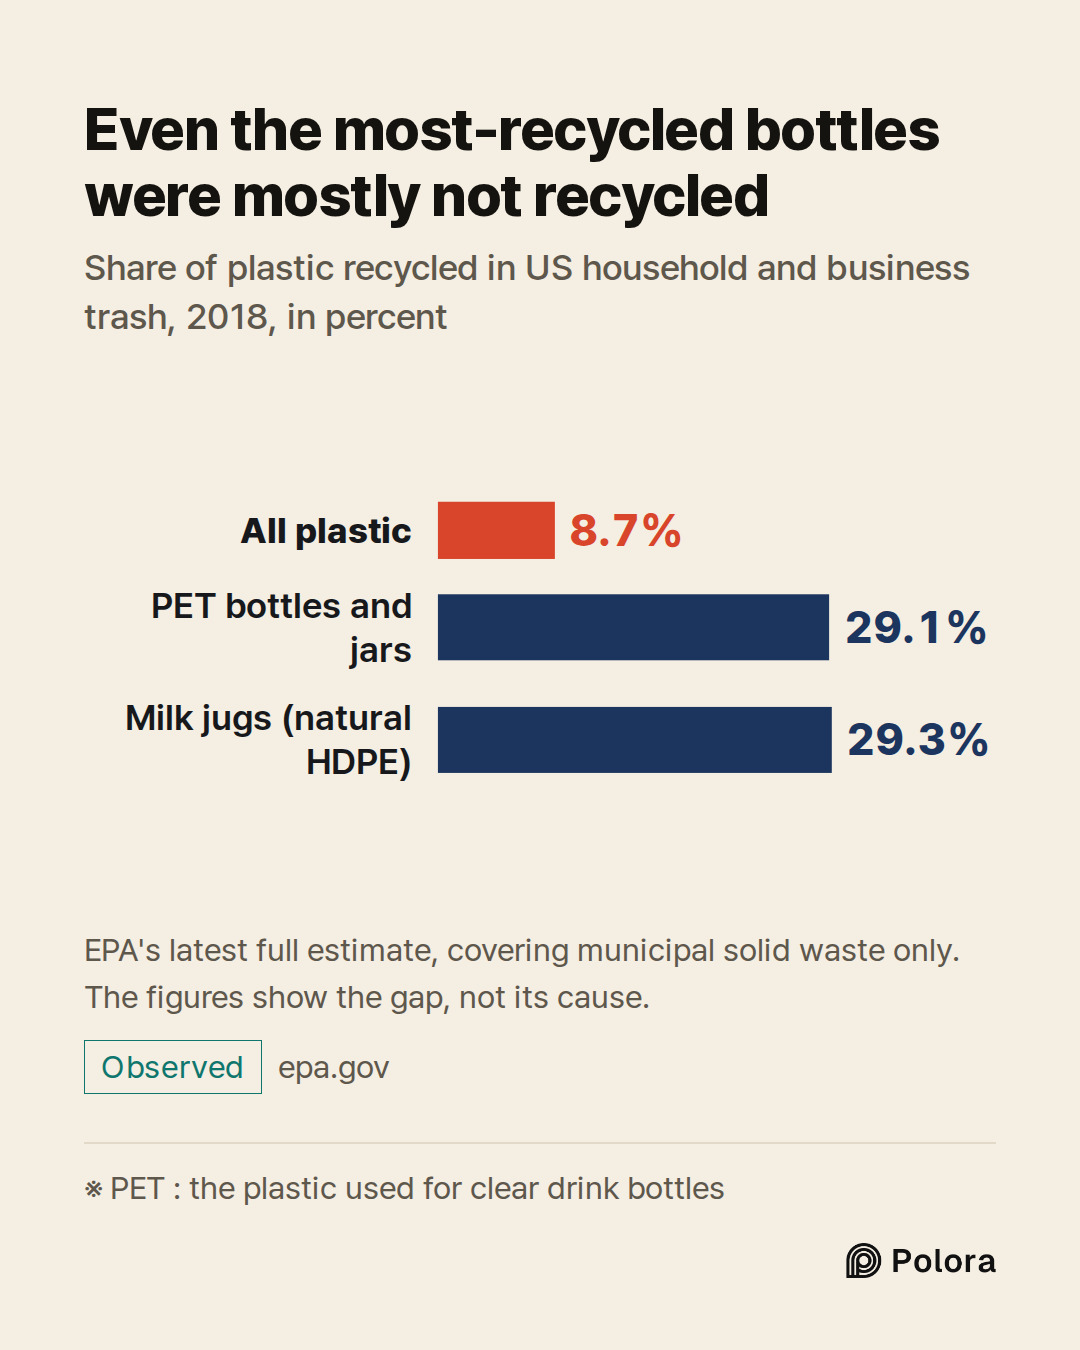
The United States shows the gap clearly. The latest full estimate from the US Environmental Protection Agency (EPA) is still for 2018, even though its web pages have been updated since. It covers plastic in household and business trash, which the EPA calls municipal solid waste, not every kind of plastic waste in the country. In 2018 that trash held about 35.7 million tons of plastic, and about 3 million tons, or 8.7 percent, was recycled. About 5.6 million tons were burned to produce energy, and about 27 million went to landfill. PET bottles and jars were recycled at 29.1 percent, and natural HDPE bottles such as milk jugs at 29.3 percent. That is more than three times the rate for plastic overall, and it still means most bottles were not recycled. The figures show the gap. They do not by themselves show what causes it.
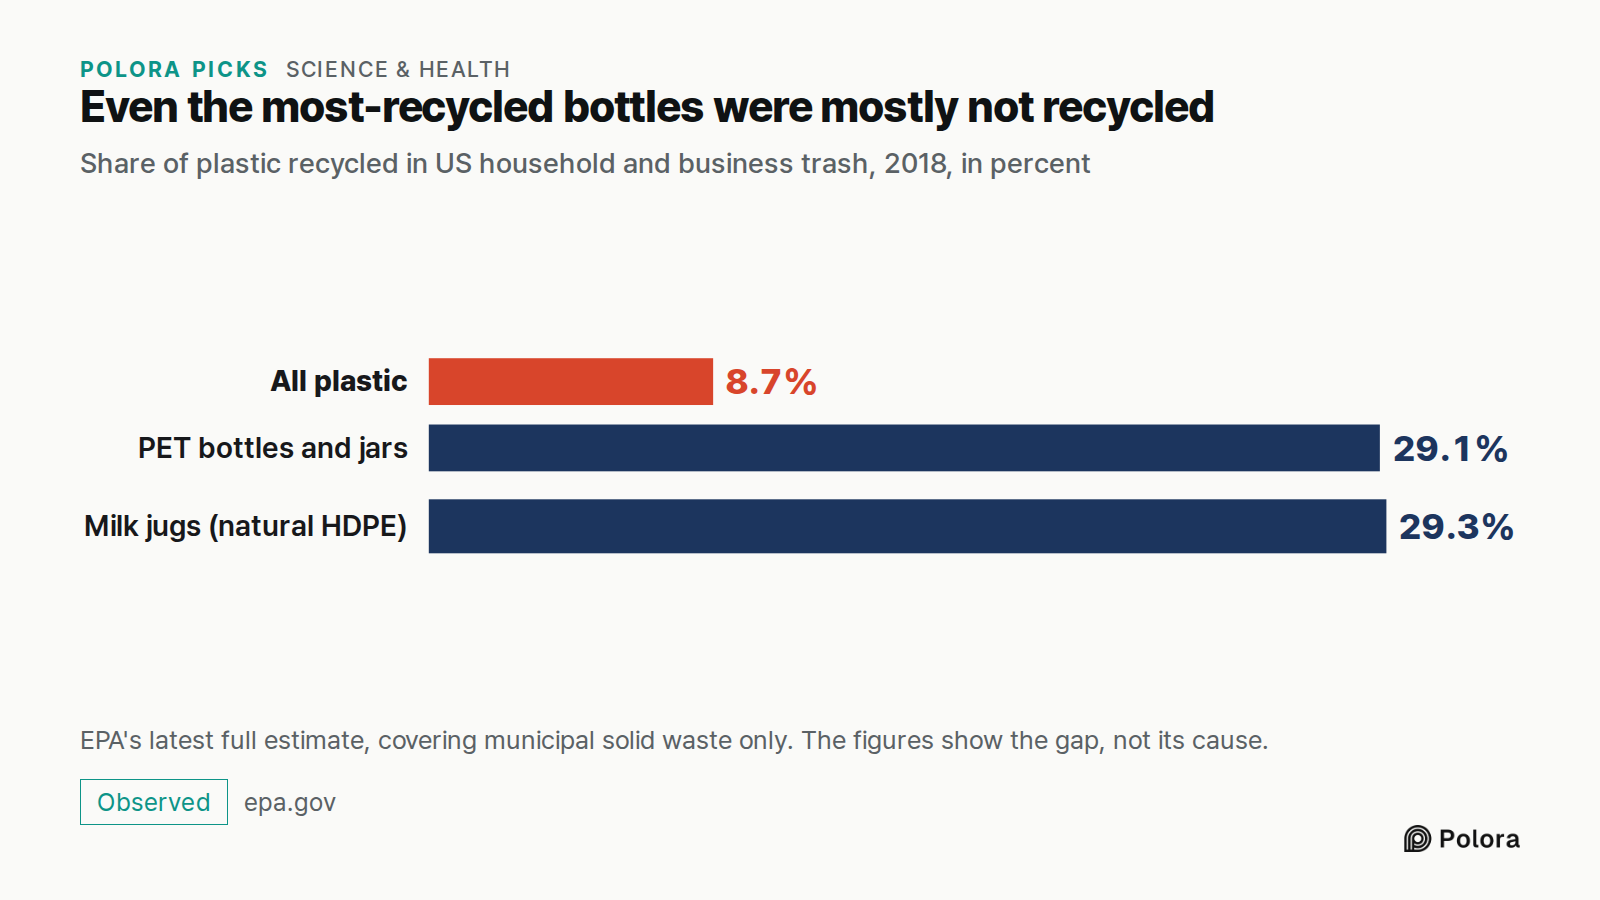
Even the most-recycled bottles were mostly not recycled · Share of plastic recycled in US household and business trash, 2018, in percent · All plastic · PET bottles and jars · Milk jugs (natural HDPE) · 8.7% · 29.1% · 29.3% · EPA's latest full estimate, covering municipal solid waste only. The figur
Share of plastic recycled in US household and business trash, 2018, in percent

The number inside the arrows tells you the type of plastic, not whether it gets recycled

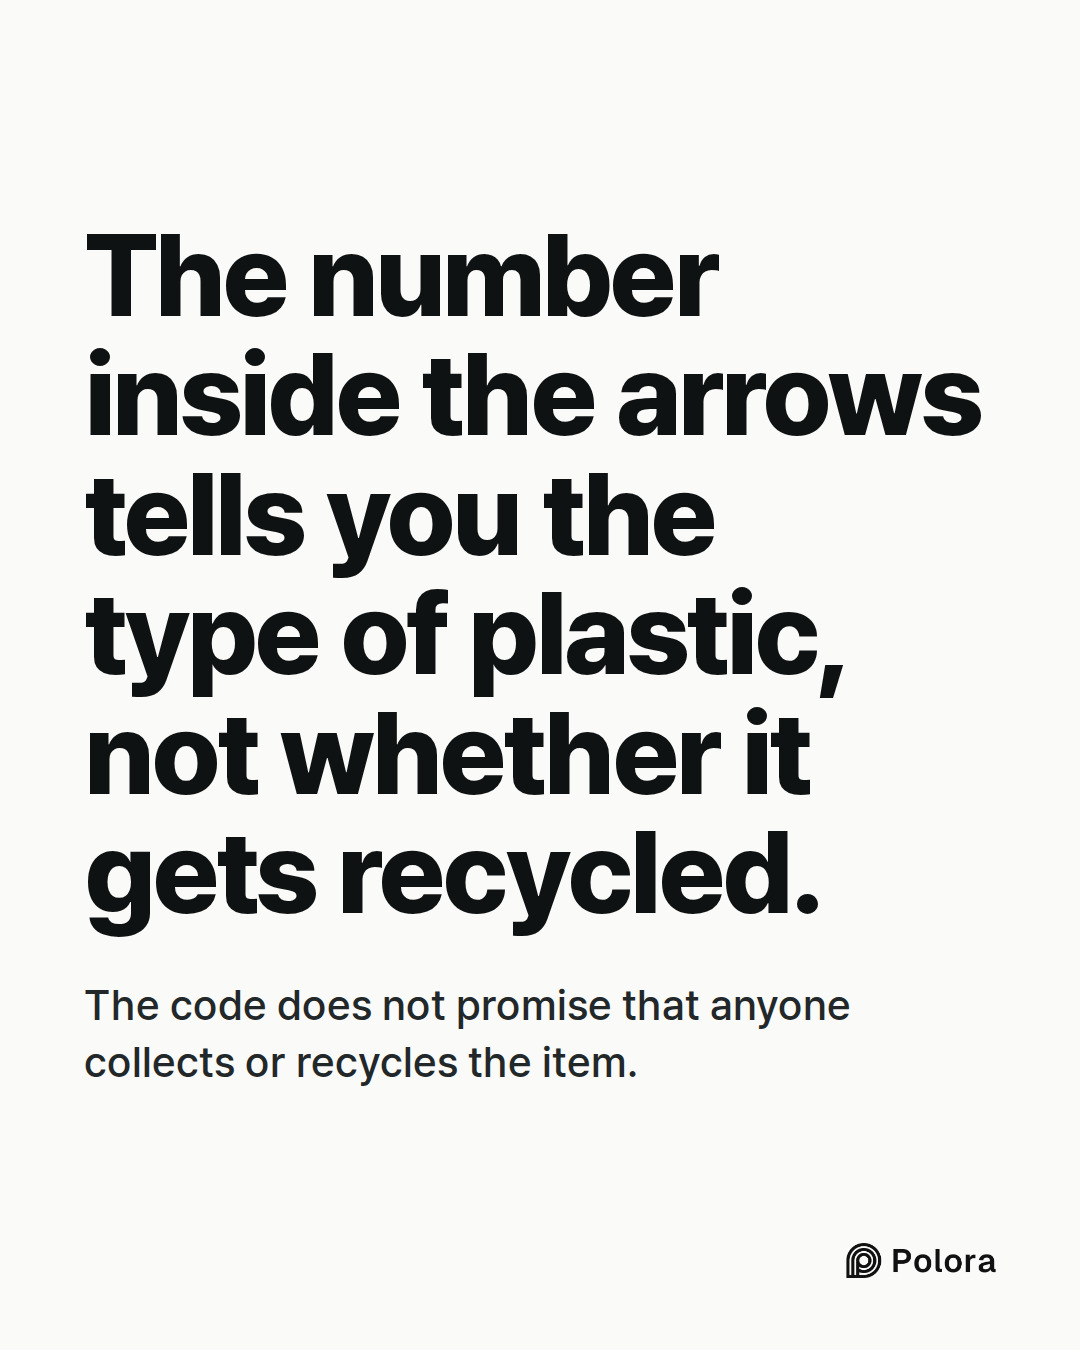
Many plastic items carry a small number from 1 to 7 inside a triangle of arrows. Most people take it as a sign the item can be recycled. In fact it is a resin identification code : it only says which kind of plastic the item is made of. Number 1 is PET and number 2 is HDPE. Numbers 3 to 7 cover the other plastics, which are the ones that seldom find a buyer.

The code does not promise that anyone collects or recycles the item, and the standard itself says so. Because the arrows confused people, the group that writes the standard, ASTM International, replaced them with a plain solid triangle in a 2013 revision of its standard, D7611. The rule applies to new molds, and older molds do not have to be changed, so the old arrows are still printed on many products.

Where did the plastic nobody wanted end up?

For years, wealthy countries sent a large share of their sorted plastic abroad, mostly to China. According to a study in the journal Science Advances by researchers at the University of Georgia, China took in about 106 million metric tons of plastic waste after 1992. That was nearly half of all the plastic waste imported anywhere in the world.

In January 2018, under a policy called National Sword, China stopped accepting plastic waste from households. Strict limits on contamination followed in March 2018, and more kinds of waste were banned in stages through 2019. Mixed plastic from bins in other countries lost its largest destination. The same study projected that about 111 million metric tons of plastic waste would need a new destination by 2030. The bins stayed the same afterwards. Where the plastic went did not.

Why does Japan say 89 percent when the world average is 9?

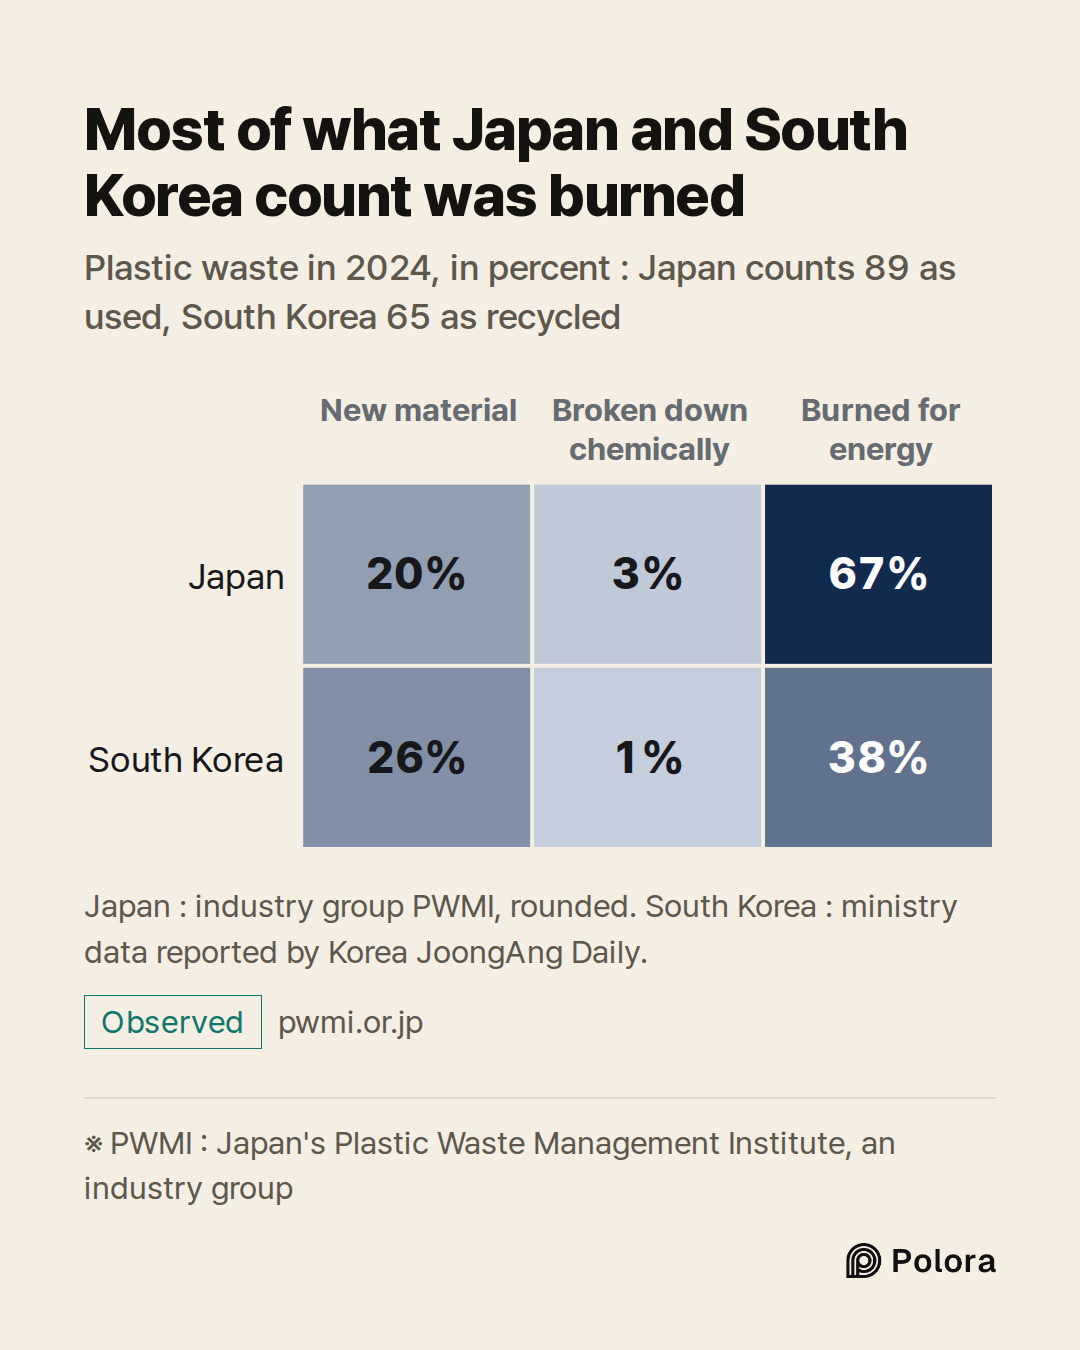
Some countries report much higher numbers. Japan's Plastic Waste Management Institute, an industry group that publishes the country's main figures, says 89 percent of Japan's plastic waste was put to effective use in 2024. In rounded figures, that 89 percent breaks down as 20 percent made into new material, 3 percent broken down chemically and 67 percent burned to produce heat or power. Only about a fifth became new material. The institute also estimates that around 60 percent of the plastic counted as material recycling was exported, a figure it now calculates with a revised method and gives as a range.

South Korea counts in a similar way. According to ministry data submitted to the National Assembly and reported in September 2026 by the Korea JoongAng Daily, 65 percent of South Korea's plastic waste was counted as recycled in 2024. But only 26 percent was made into new material, 38 percent was burned for energy and 1 percent was broken down chemically. The government is reviewing whether to stop counting burning as recycling, which would bring its figures closer to how Europe and the United States count.

The United States counts burning for energy separately from recycling, and the European Union's figure leaves it out. Burning plastic for energy recovers some of its value as heat or power. But the plastic is gone afterwards. It is not what people expect when they put a bottle in the bin.
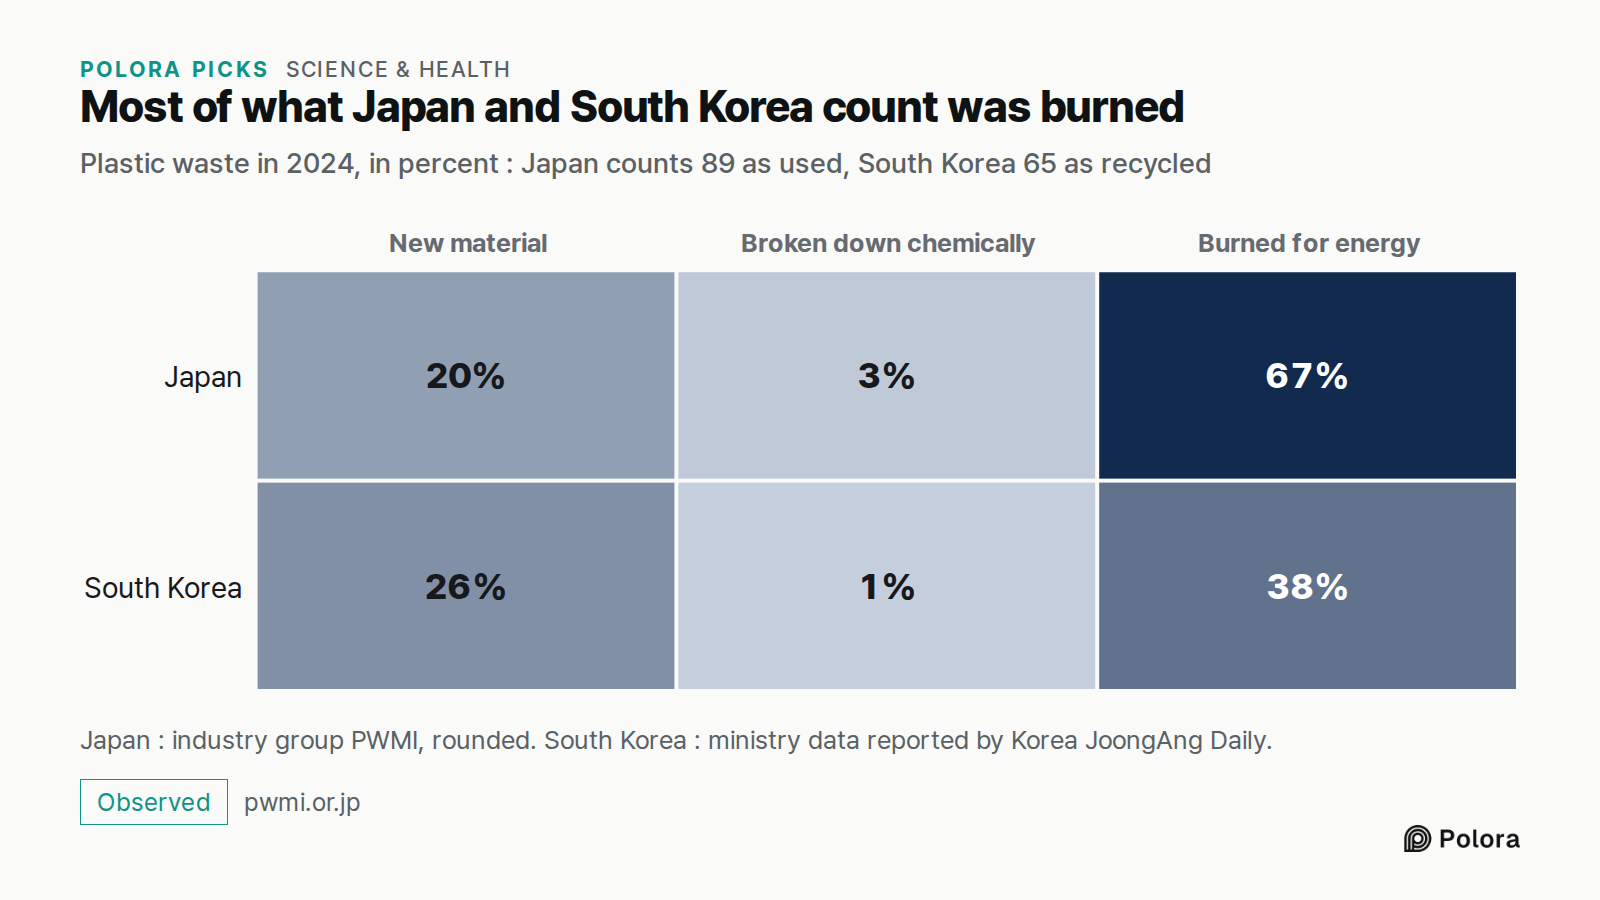
Most of what Japan and South Korea count was burned · Plastic waste in 2024, in percent : Japan counts 89 as used, South Korea 65 as recycled · New material · Broken down chemically · Burned for energy · Japan · South Korea · 20% · 3% · 67% · 26% · 1% · 38% · Japan : industry group PWMI, rounded. So
Plastic waste in 2024, in percent : Japan counts 89 as used, South Korea 65 as recycled

What does Europe's 42 percent measure?

In 2023 the European Union recycled 42.1 percent of its plastic packaging waste, according to Eurostat, the EU's statistics office. This figure covers packaging only, from businesses and government as well as households, not all plastic, and burning is not counted. Since 2020 the EU has measured recycling at the point where material enters the recycling process, rather than where it leaves a sorting plant. Eurostat says that change caused a decrease of 3.4 percent in recycling.

The way of counting matters. If you count at the bin, the number is high. If you count what goes into the recycler, it is lower. If you count only what becomes new material, it is lower still.
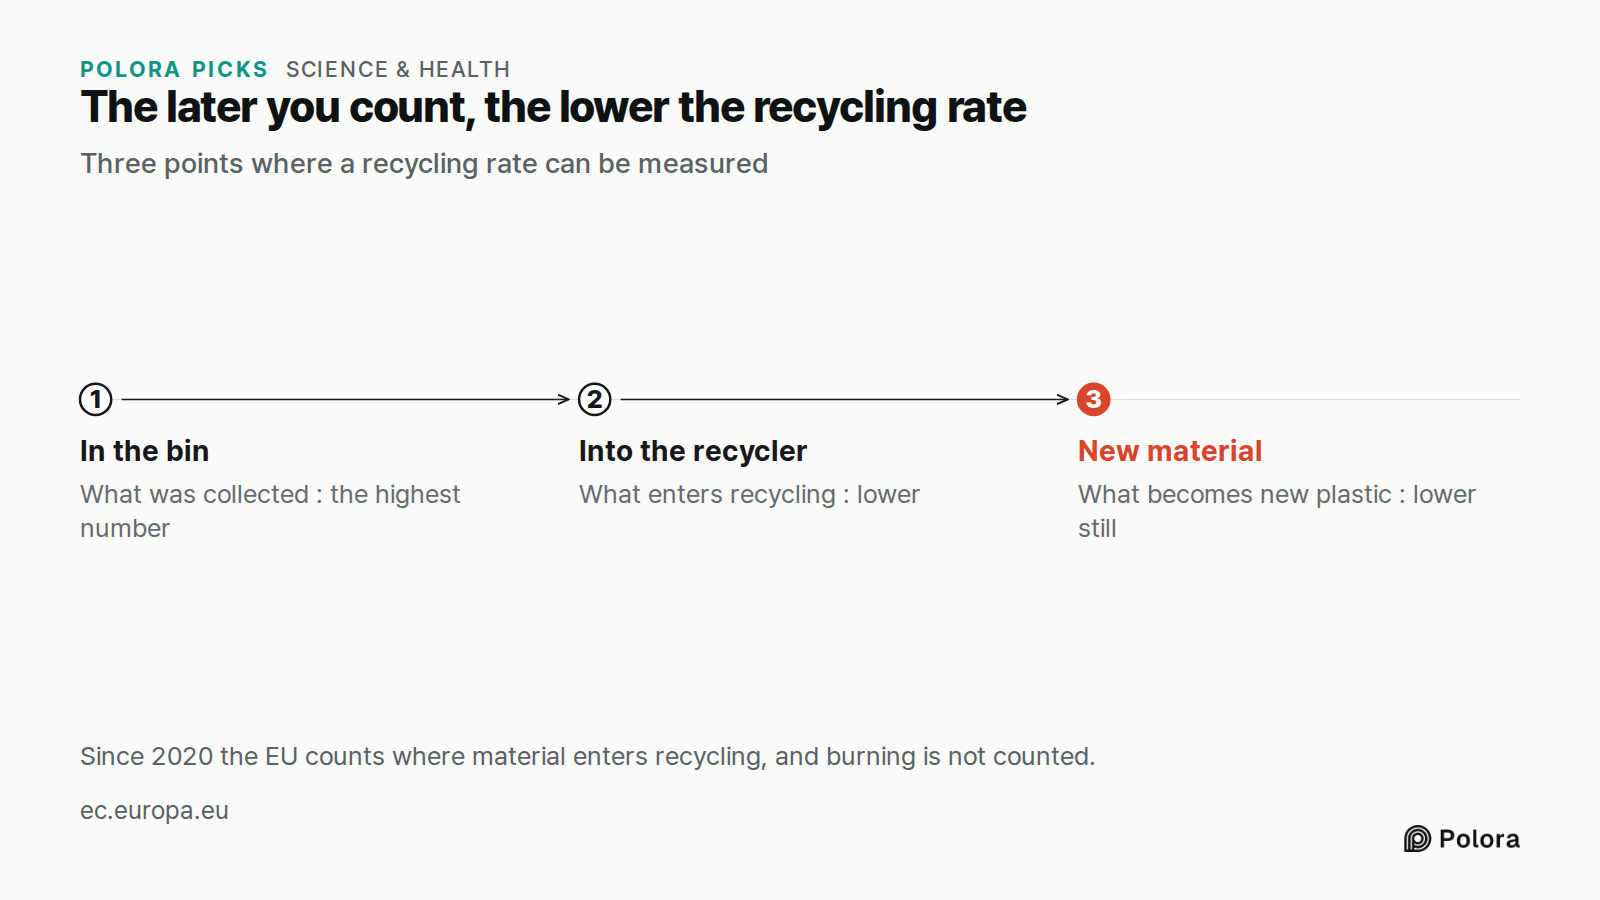
The later you count, the lower the recycling rate · Three points where a recycling rate can be measured · In the bin · Into the recycler · New material · What was collected : the highest number · What enters recycling : lower · What becomes new plastic : lower still · Since 2020 the EU counts where
Three points where a recycling rate can be measured

So what happens to the bottle you just threw in?

No national average can say what happens to one particular bottle. That depends on the local sorting plant and on whether anyone is buying that material at the time. What the numbers do show is a pattern that holds from year to year : plastic comes back as new plastic when someone will buy it, which mostly means clear bottles and milk jugs, and a high recycling rate can include plastic that was burned.

The rules are being argued over right now. California passed a law, SB 343, to keep the recycling symbol off packaging that is not actually recycled. On July 14, 2026, before it took effect, a federal judge issued a preliminary injunction stopping the state from enforcing it while the case continues. That is not a final ruling on the law. South Korea is reviewing how it counts. Countries negotiating a global treaty on plastics have not reached an agreement yet, and the next round of talks is proposed for March 2027.

Something you could tell a colleague : the recycling bin sends plastic to be sorted, and it becomes new plastic only if someone will buy it. When you hear a recycling rate, ask what was counted.
What actually happens to the plastic you put in the recycling bin?What actually happens to the plastic you put in the recycling bin?The recycling bin sends plastic to be sorted, not to be recycled. · It becomes new plastic only if someone will buy it.※ OECD : a group of mostly wealthy countries that studies economic policy · All plastic waste · Collected for recycling · Actually recycled · 353 million tonnes · 55 million (15%) · About 33 million (9%) · Collected for recycling is not the same as recycled · World plastic waste in 2019, in million※ PET : the plastic used for clear drink bottles · All plastic · PET bottles and jars · Milk jugs (natural HDPE) · 8.7% · 29.1% · 29.3% · Even the most-recycled bottles were mostly not recycled · Share of plastic recycled in US household and business trash, 2018, in percent · EPA's latest full estimThe number inside the arrows tells you the type of plastic, not whether it gets recycled. · The code does not promise that anyone collects or recycles the item.※ PWMI : Japan's Plastic Waste Management Institute, an industry group · New material · Broken down chemically · Burned for energy · Japan · South Korea · 20% · 3% · 67% · 26% · 1% · 38% · Most of what Japan and South Korea count was burned · Plastic waste in 2024, in percent : Japan counts 89 as usWhen you hear a recycling rate, ask what was counted. · A high recycling rate can include plastic that was burned.Sources 19 : voanews.com · VOA : 9 percent of plastic worldwide is recycled, OECD says, oecd.org · OECD Global Plastics Outlook (2022), policy highlights, oecd.org · OECD Global Plastics Outlook (2022), full report + 16Read the full story at · polora.ai
What actually happens to the plastic you put in the recycling bin?

Alpha · claude-sonnet-5

I'll weigh in as Alpha with two verification points I just confirmed, then address the piece's framing. The OECD 55 Mt / 22 Mt figures check out — with one correction. I pulled the actual OECD policy-highlights PDF. It confirms: "Only 55 Mt or 15% of this waste was collected for recycling, but 22 Mt ended up as a recycling residue" and "Globally, only 33 million tonnes (Mt), or 9% of the 353 Mt of plastic waste, were recycled in 2019." So the manuscript's chain of numbers (353 Mt total, 55 Mt collected, 22 Mt residue, 9% final) is accurate and now has a primary-source anchor: https://rds.org.co/apc-aa-files/205ec78c9cca6d1850bdca24e20e50bf/document.pdf (a mirror of the OECD policy highlights PDF, since oecd.org itself 403s for me too). Good catch by the researcher flagging this as unconfirmed — it's now confirmed. The China ban date needs a small fix. Sources diverge on a detail the manuscript states too simply. Most trackers agree the headline import ban on 24 waste categories "officially began on January 1, 2018", which supports the manuscript's "January 2018" framing. But the Wikipedia timeline and others note a second wave: "Strict contamination limits of 0.5 percent…

Beta · gpt-6-sol

The manuscript’s central point stands, but “becomes new plastic” is more definite than several of its measures allow. A recycling rate may measure material entering a recycling process, not the amount of finished plastic that emerges. And figures for *all plastic waste* cannot tell a reader the odds for a bottle placed in a particular curbside bin. | Manuscript claim | What the sources establish—and what needs changing | |---|---| | Worldwide, 9% was recycled in 2019; collection is not recycling. | Confirmed directly by the OECD: of 353 million metric tonnes of plastic waste, 55 million were collected for recycling and 22 million became residue requiring disposal. The OECD reports 9% recycled, 19% incinerated, almost 50% landfilled, with the remainder mismanaged. Use the OECD itself rather than VOA or a mirror: https://www.oecd.org/en/publications/global-plastics-outlook_de747aef-en/full-report/component-6.html (oecd.org) | | U.S. overall and bottle rates differ sharply. | Confirmed, with an important denominator: EPA’s 2018 munic…

Gamma · gemini-3.1-pro

Alpha and Beta have laid a solid foundation by confirming the OECD, EPA, PWMI, and Eurostat figures. I will step in to close the remaining verification gaps Beta left open and provide the final checks the editor needs before publication. Here is what the record shows on the remaining claims: 1. The China Import Ban (Brooks et al., 2018) The manuscript’s numbers are exactly correct. The study in *Science Advances* by Brooks, Wang, and Jambeck explicitly states that since reporting began in 1992, China had accepted a cumulative total of approximately 106 million metric tons of plastic waste (nearly half of global imports). It also explicitly calculates that 111 million metric tons of plastic waste will be displaced globally by 2030 due to the ban. *Source:* Brooks, A.L., Wang, S., & Jambeck, J.R. (2018). "The Chinese import ban and its impact on global plastic waste trade." *Science Advances*, 4(6). 2. The ASTM Triangle Redesign (Correction Needed) The manuscript claims that ASTM replaced the chasing arrows with a solid triangle in its "2010 standard, D7611." This is a slight historical error. While ASTM International took over the administration of the Resin Ide…

Researcher · gemini-3-7-flash

Factual Verification & Source Grounding Every verifiable claim in the editor's manuscript and the verification brief has been checked against live primary records: --- 1. OECD Global Figures (2019 Waste Fate) * Manuscript Claim: Of 353 Mt of plastic waste in 2019, 55 Mt was collected for recycling, 22 Mt became residue/losses, leaving ~9% (33 Mt) recycled; ~19% was incinerated, nearly 50% landfilled, and 22% mismanaged/uncollected. * Finding: Verified. The primary source confirms these exact figures: 353 Mt generated, 55 Mt (15%) collected, 22 Mt discarded as recycling residue, yielding 33 Mt (9%) recycled. * Source: OECD Global Plastics Outlook: Economic Drivers, Environmental Impacts and Policy Options (2022) --- 2. US EPA Estimates & Material Disparities * Manuscript Claim: Latest full EPA dataset remains 2018; 35.7M tons generated, 8.7% recycled, 5.6M tons combusted with energy recovery, ~27M tons landfilled; PET bottles/jars recycled at 29.1%, natural HDPE bottles at 29.3%. * Finding: Verified. The EPA’s Municipal Solid Waste (MS…

The Arbiter · gpt-6-sol

Round record for the publication check The manuscript’s premise stands, but its central distinction needs to stay precise: putting plastic in a recycling bin starts a collection and sorting process; it does not guarantee that the item becomes a new plastic product. Beta’s strongest caution is that *collected*, *sent into recycling*, and *emerging as new material* are different measurements. The global rate also describes all plastic waste, not the fate of a particular curbside bottle. (oecd.org) - Global figures — confirmed. Alpha, Beta and the Researcher converged on the OECD’s primary report: in 2019, the world generated 353 million tonnes of plastic waste; 55 million were collected for recycling, 22 million were disposed of as recycling residue, and the OECD reports 9% ultimately recycled. It reports 19% incinerated, almost 50% landfilled, and 22% mismanaged. The manuscript should cite the OECD directly rather than rely on VOA or Alpha’s mirror. OECD report: https://www.oecd.org/en/publicatio…

The Arbiter's Final Verdict · gpt-6-sol

The bin sends plastic to be sorted; it does not guarantee recycling. After collection, a sorting facility separates materials and prepares them for processors. Plastic that a processor can use may be cleaned, shredded and made into new material. Other plastic can be rejected during sorting or processing and ultimately landfilled, burned or otherwise disposed of. An export is a change of destination, not proof that recycling happened. The scale of that gap is well documented, though the figures measure different things: - Worldwide: Of 353 million tonnes of plastic waste generated in 2019, 55 million were collected for recycling. After 22 million tonnes of processing residue were discarded, the OECD estimated that 9% was ultimately recycled. That is a share of *all plastic waste worldwide*, not the odds for a bottle placed in your bin. - United States: The EPA’s latest full plastics estimate is for 2018. It puts recycling of plastics in municipal solid wa…