What the numbers measure
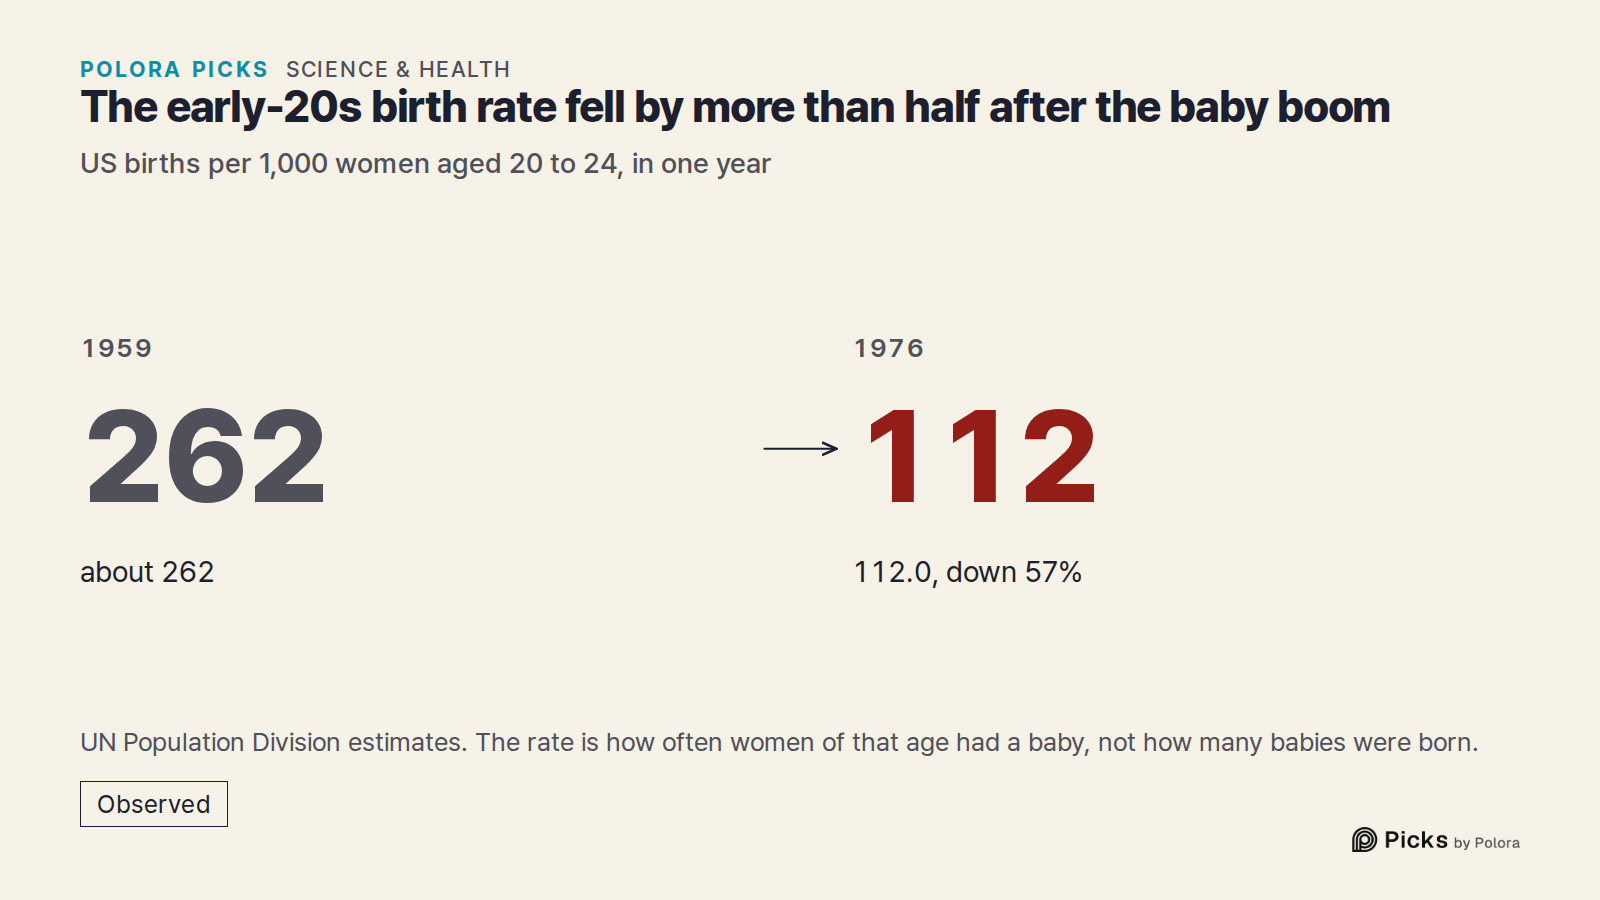
The film that comes with this article tracks one measure : births per 1,000 women in an age group, in a year. In 1959, near the height of the baby boom, the UN estimates that for every thousand American women aged 20 to 24, about 262 babies were born.
This is a rate, not a count. It says how often women of a given age had a baby, not how many babies that age group had in total. A larger age group with a lower rate can still have more births. It also counts every birth, not only first ones.
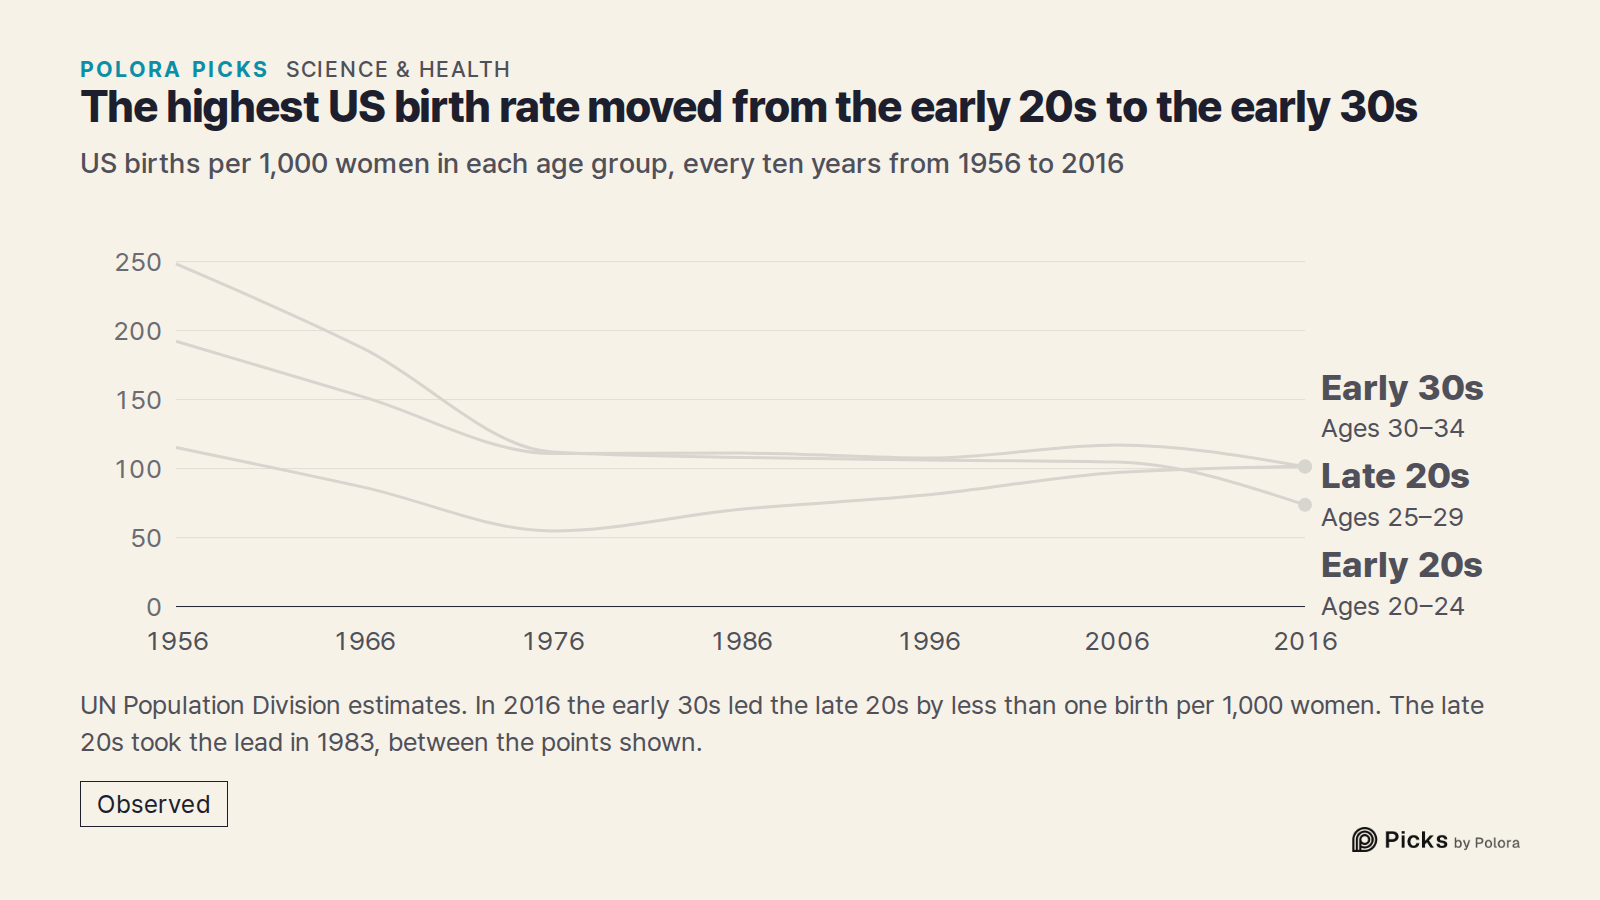
The lines in the film are estimates from the UN Population Division's World Population Prospects 2024, as published by Our World in Data. The CDC publishes its own rates, built from US birth certificates. The two are close but not identical. In 2016, for example, the UN puts women aged 30 to 34 at 101.6 births per 1,000 and women aged 25 to 29 at 101.4. The CDC's figures are 102.7 and 102.1. In both sources the early 30s pass the late 20s that year, and from 1950 on the CDC's table of rates gives the same turning points as the UN estimates : 1983 for the late 20s and 2003 for women in their late 30s passing teenagers.
After the boom, a long fall
The boom ended, and birth rates fell overall in all six age groups the film shows. By 1976 the early-20s rate was 112.0 per 1,000, down 57% from 1959 and nearly level with the late 20s at 111.0. The early 20s stayed just ahead through 1982. In 1983 the late 20s moved in front, 110.4 to 109.5, and the early 20s have not led since.
Teens fall, the 30s climb
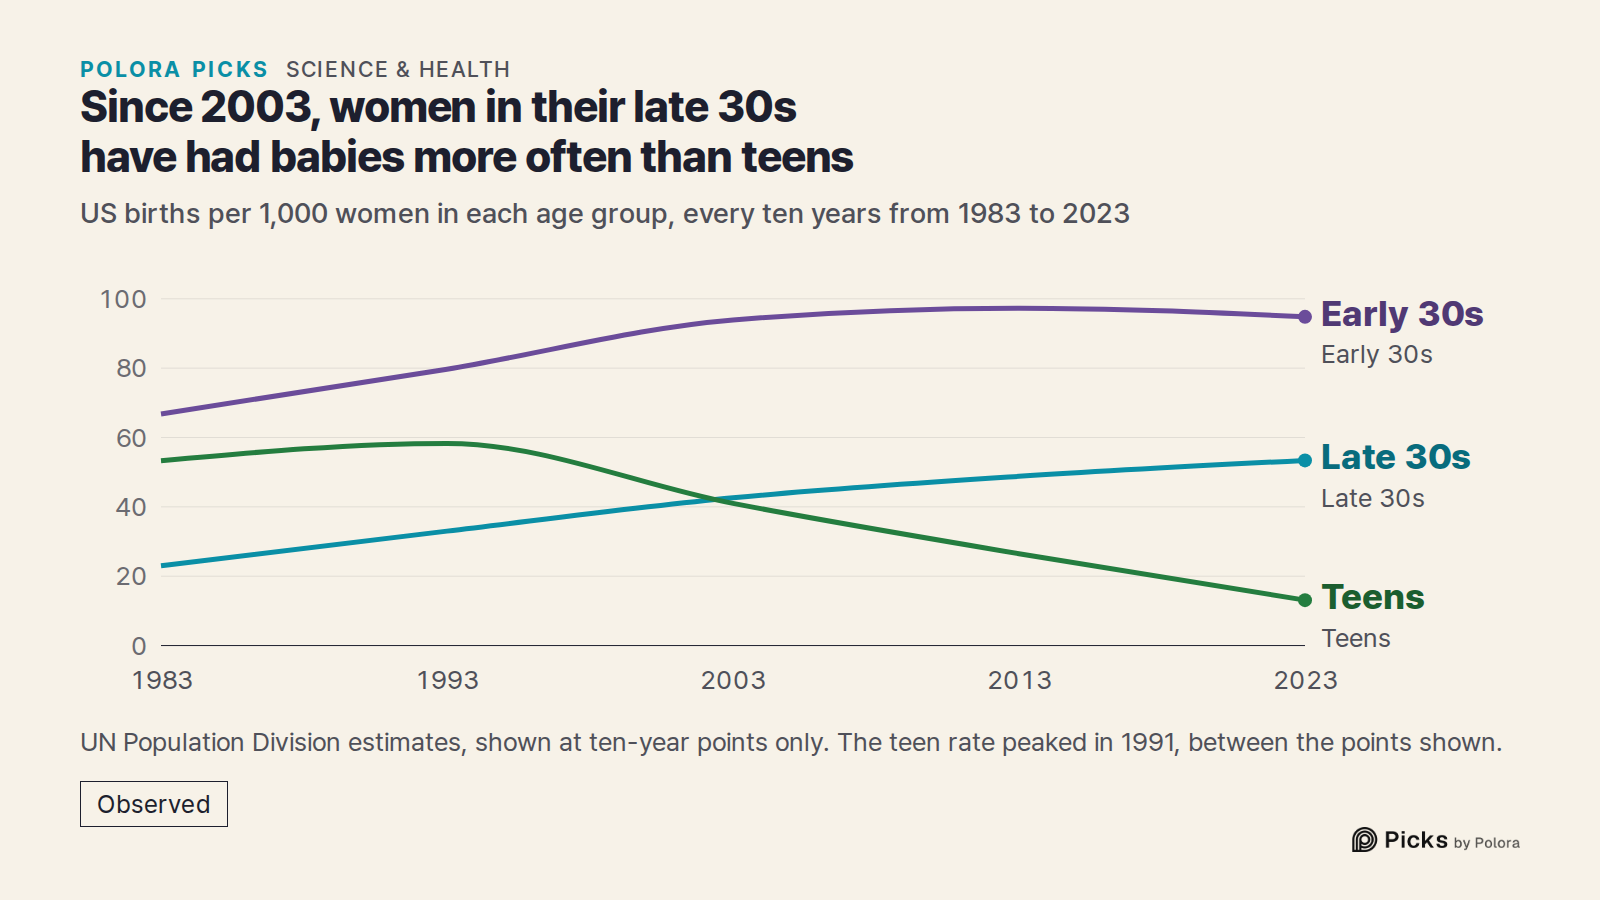
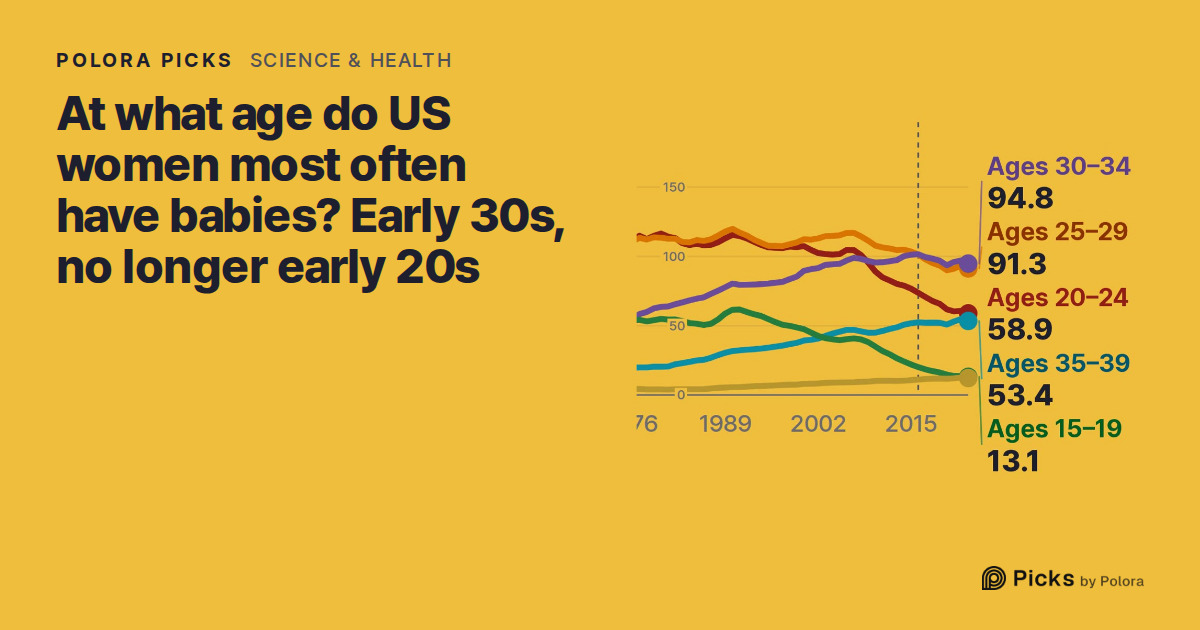
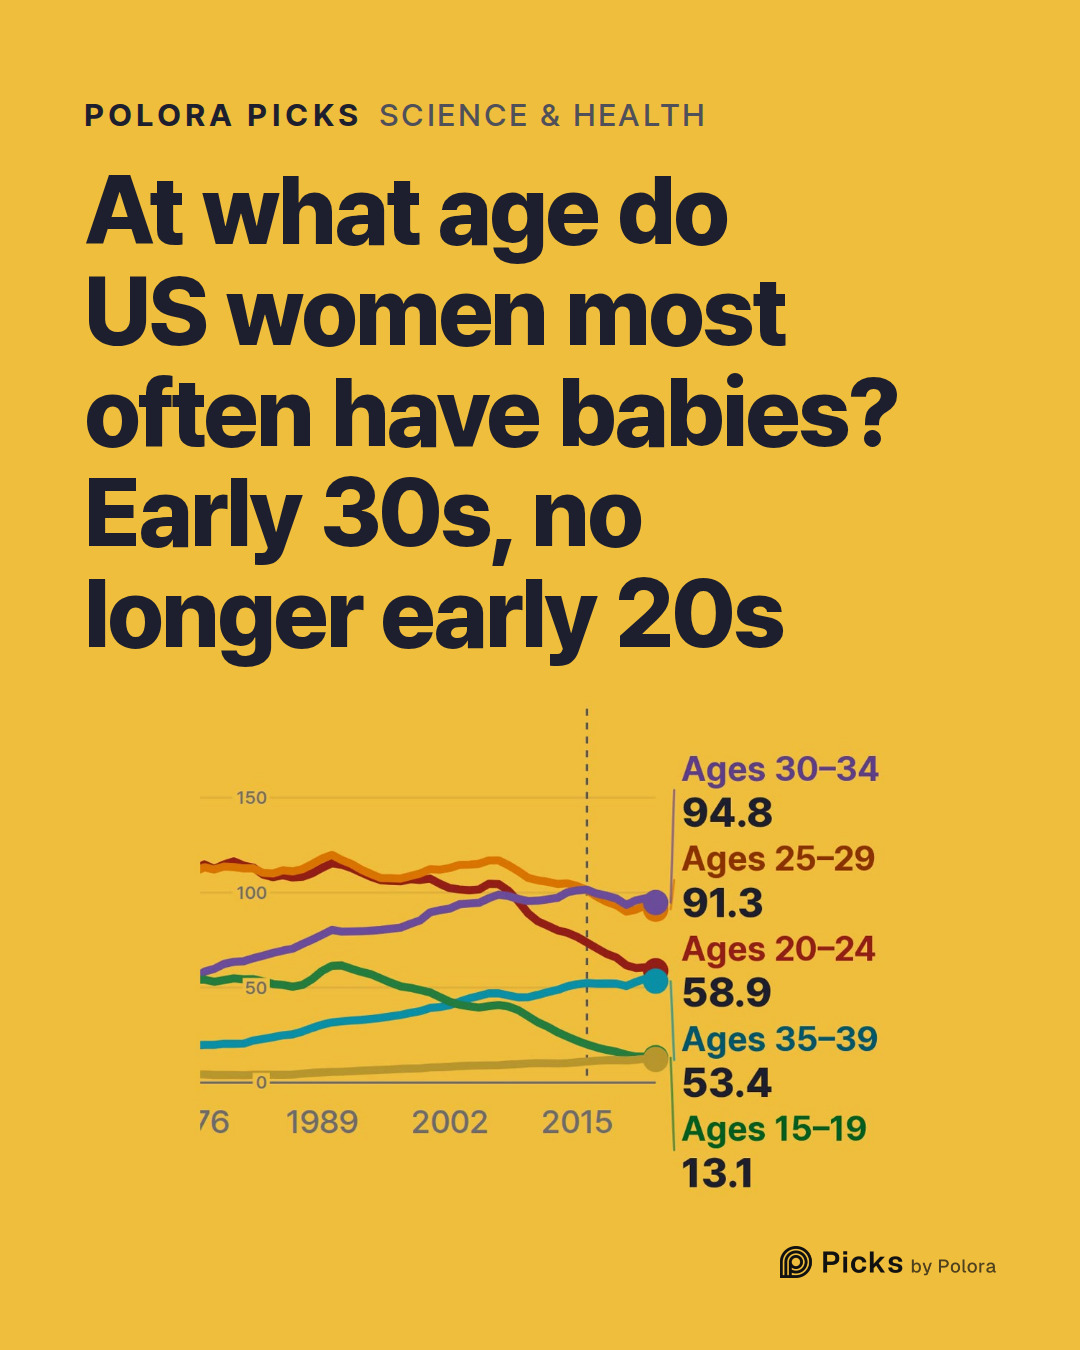
From the 1980s on, the rate for women in their early 30s climbed, not every year but overall : from 66.8 in 1983 to 96.7 in 2009 and 101.6 in 2016. Teen birth rates went the other way. They peaked at 61.7 per 1,000 in 1991, their highest after 1980, and then fell overall. In 2003, women aged 35 to 39 passed teenagers, 42.6 to 41.0. By 2023 the teen rate was 13.1, down 79% from 1991, and women aged 35 to 39, at 53.4, had 4.1 times the teen rate.
The CDC says the reasons for the teen decline "are not totally clear", but that evidence points to more teens not having sex and more sexually active teens using birth control.
2016 : the early 30s on top
The last change at the top was a close one. In 2016 the early-30s rate passed the late-20s rate by less than one birth per 1,000 women, in both the UN and the CDC figures. The CDC's report on that year says it came from both directions : rates fell for women under 30 and rose for women 30 and over.
Why have births moved later? The data show when, not why. A 2011 review of the research by Melinda Mills and colleagues, in the journal Human Reproduction Update, looked at why people in Western countries put off their first child. Among the central reasons it lists are effective birth control, more education and work for women, gender equity, changing values and partnerships, housing, economic uncertainty and a lack of family support policies. It covers those countries broadly; it does not explain the US crossing in particular.
Older mothers, measured two ways
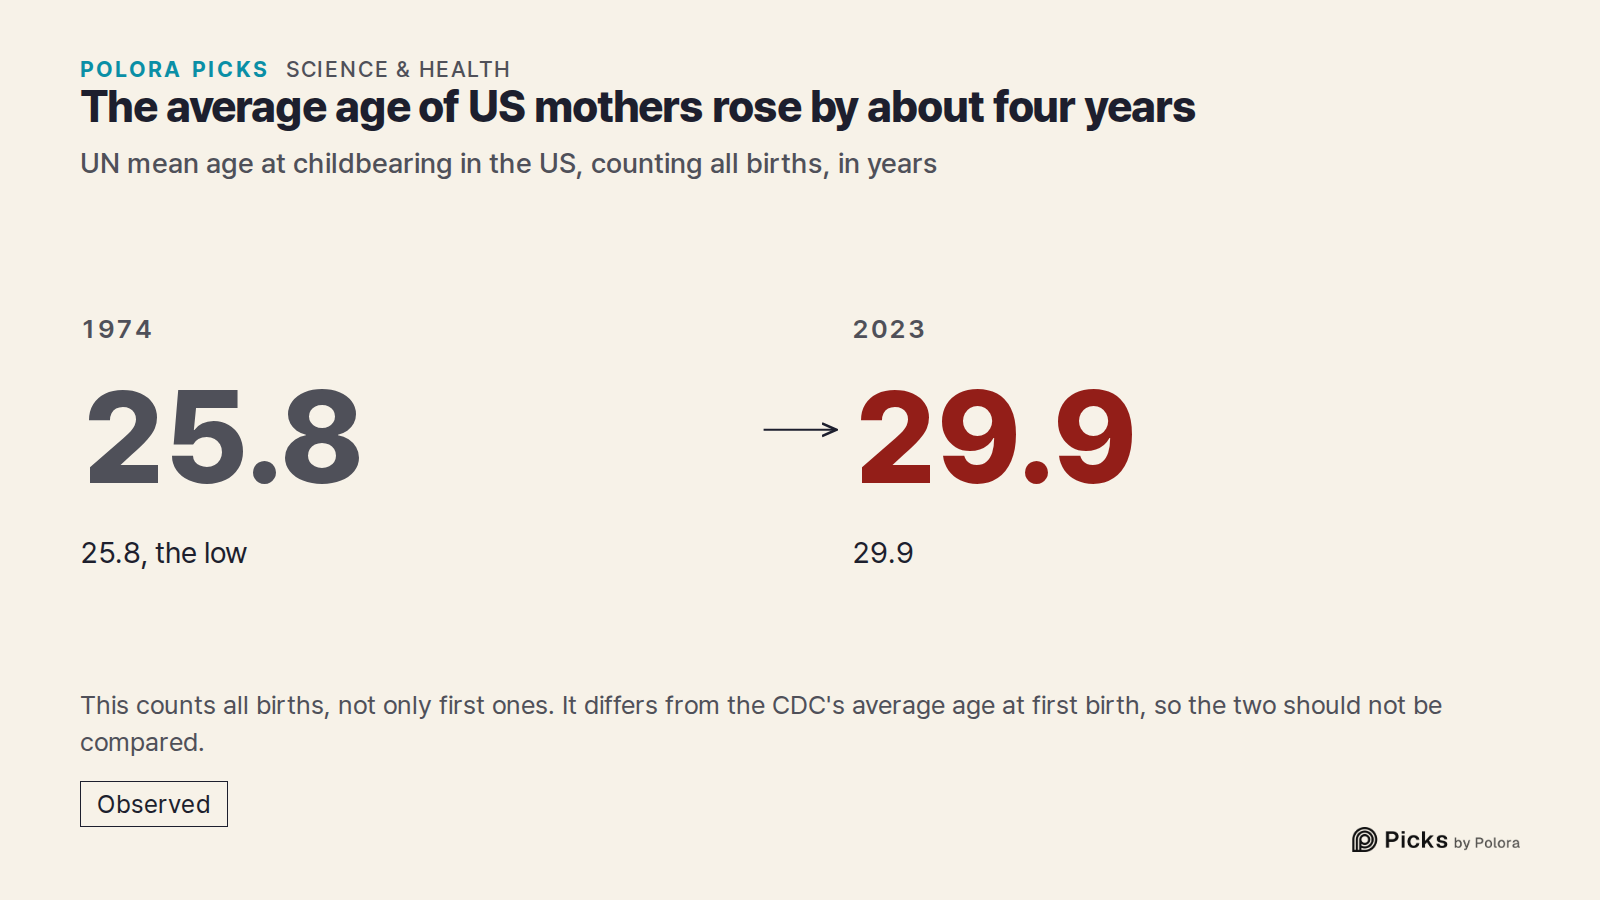
The number under the date in the film is the UN's mean age at childbearing. It is built from the rates at each age and covers all births, not just first ones. It rose from a low of 25.8 in 1974 to 29.9 in 2023.
The CDC also publishes something narrower : the plain average age of women having their first baby, taken from birth certificates. That rose from 26.6 in 2016 to 27.5 in 2023. These are different measures, so the two numbers should not be set against each other, but both have risen.
Since the film's last year
The film's UN data stop at 2023. That year the rate in each of the six age groups was below its 1959 level, the early 20s at 58.9, less than a quarter of their 1959 rate. The early 30s led at 94.8, ahead of the late 20s at 91.3.
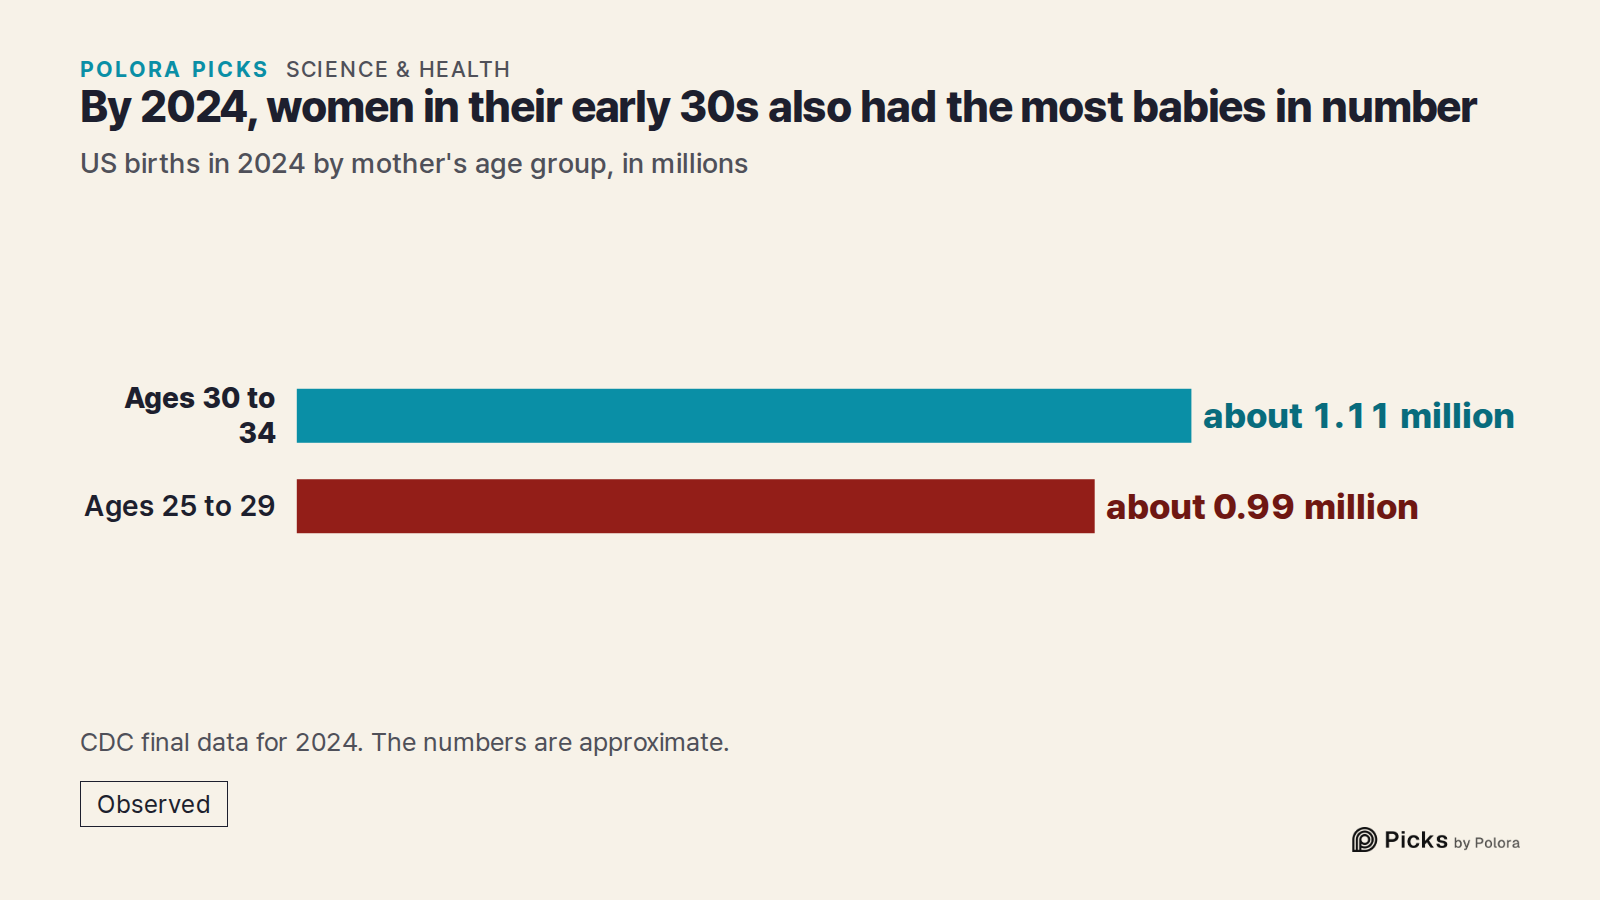
The CDC's final figures carry the story further. They are best read on their own rather than as the next points on the UN's lines : the two are built differently, and for women in their 20s and early 30s the CDC's own rates for 2023 are a little lower than the UN's. The CDC's final report for 2024 notes that the early-30s rate has been higher than the late-20s rate since 2016. In 2024, women aged 30 to 34 had 93.7 births per 1,000 and women aged 25 to 29 had 89.5. By then the early 30s also had the most babies in number : about 1.11 million births, against about 0.99 million for women in their late 20s. In 2025 the gap in rates widened : 96.3 against 85.7. The CDC notes that its 2025 rates rest on newer population estimates, so the change from 2024 reflects both births and those estimates.
About the data
The UN figures are the work of the UN Department of Economic and Social Affairs, Population Division, and are credited to it here; Our World in Data, which republishes them, puts its own work under a Creative Commons attribution licence. The CDC material used here is otherwise available on the CDC's website at no charge. Its use here does not imply endorsement of Polora or its work by the CDC, the Department of Health and Human Services or the US government.
- UN DESA Population Division, World Population Prospects 2024: fertility by age]
- UN DESA Population Division, World Population Prospects 2024: demographic indicators]
- Our World in Data, Fertility rate by age group]
- Our World in Data, Period average age of mothers]
- CDC/NCHS, Birth rates for females by age group: United States, 1940–2018]
- CDC/NCHS, Data Brief 287: Births in the United States, 2016]
- CDC/NCHS, Births: Final Data for 2024]
- CDC/NCHS, Data Brief 571: Births in the United States, 2025]
![Sources 7 : population.un.org · UN DESA Population Division, World Population Prospects 2024: fertility by age], ourworldindata.org · Our World in Data, Fertility rate by age group], ourworldindata.org · Our World in Data, Period average age of mothers] + 4](https://media.cdn.polora.ai/picks/2026/11/pickrun_104d8f273ded44fd/UhOKNDnHcgXafUmZ-slide-02--at-what-age-do.jpg)