What the record is
The figures are the US Bureau of Economic Analysis's corporate profits. BEA measures them in the national accounts, the same accounts that produce GDP. They cover all US corporations, listed or not, and they are not the same thing as the earnings that listed companies report to their shareholders. The version used here comes before BEA's adjustments for inventory values and depreciation. It is seasonally adjusted and stated at an annual rate.
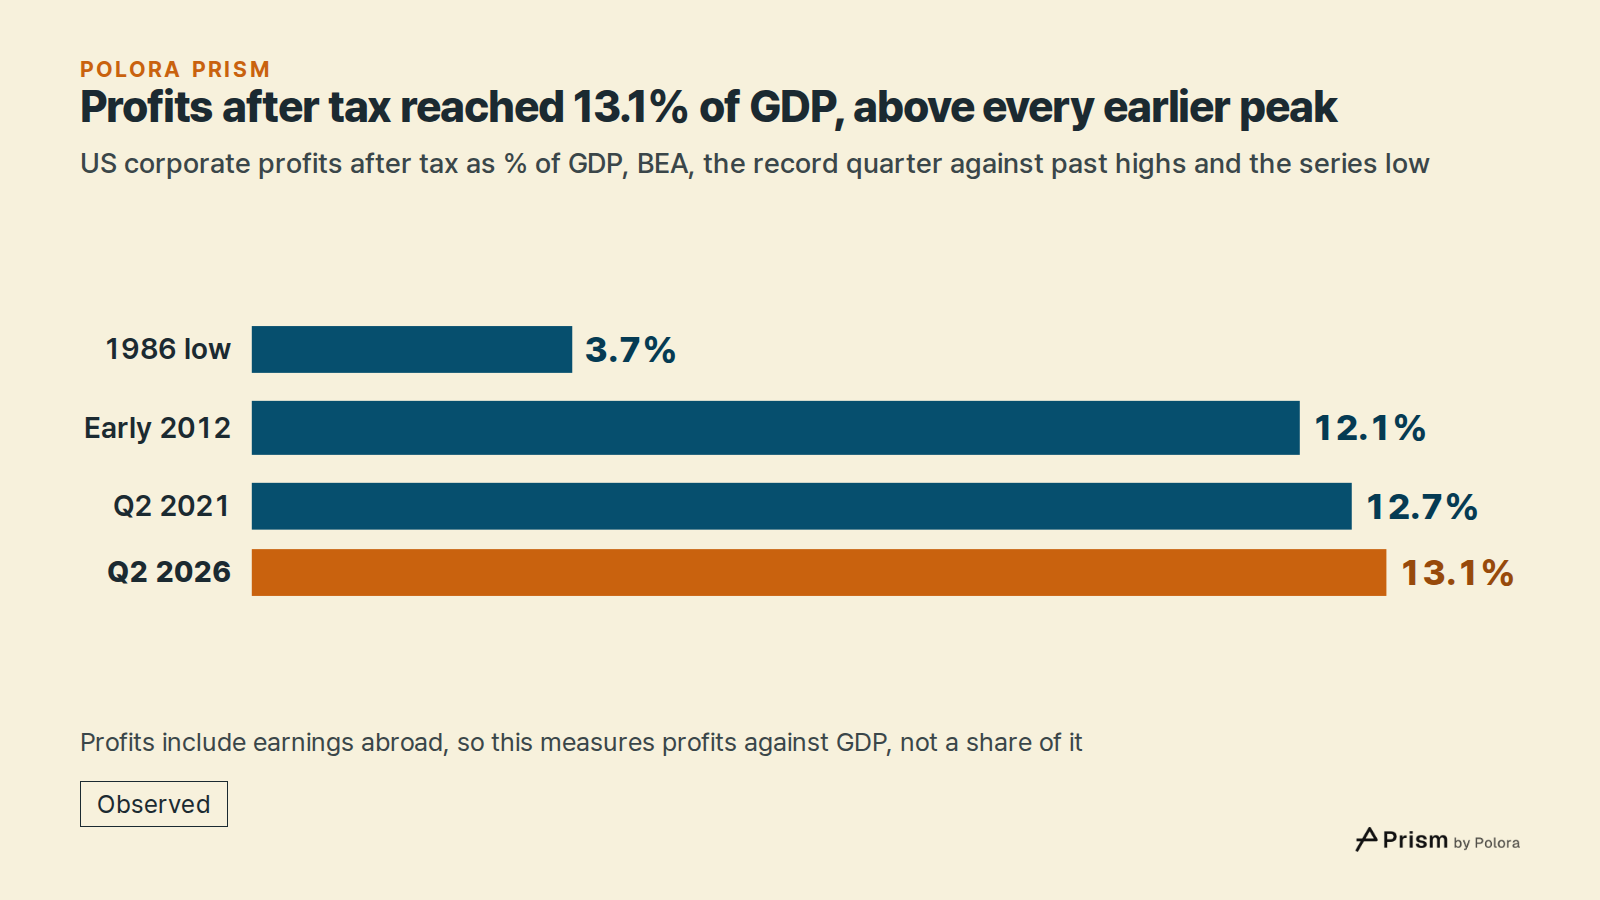
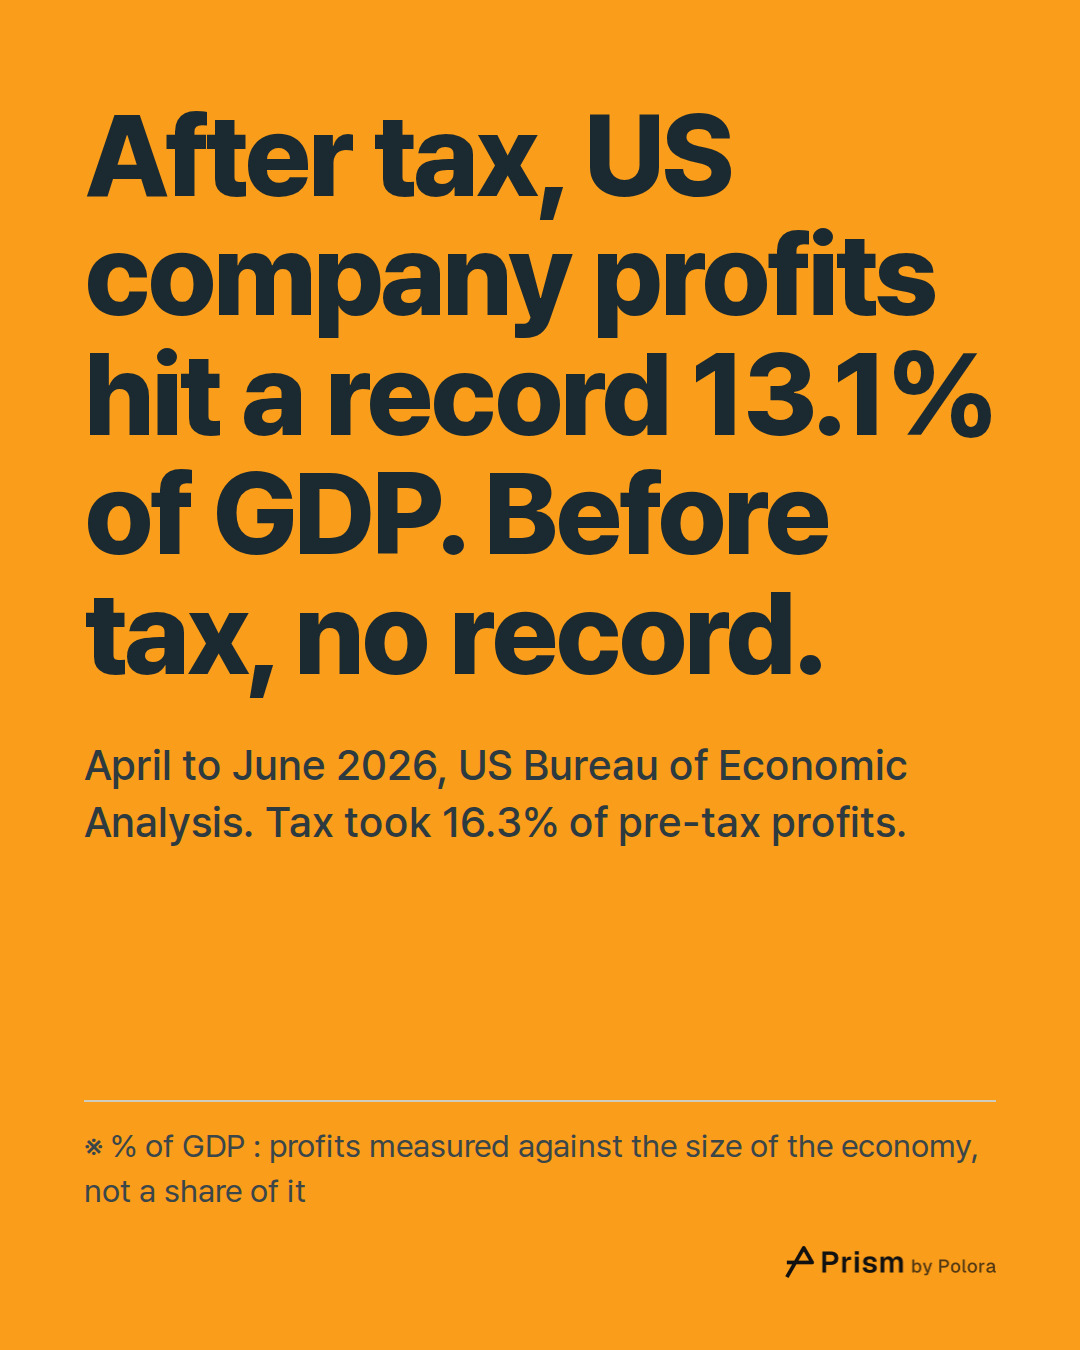
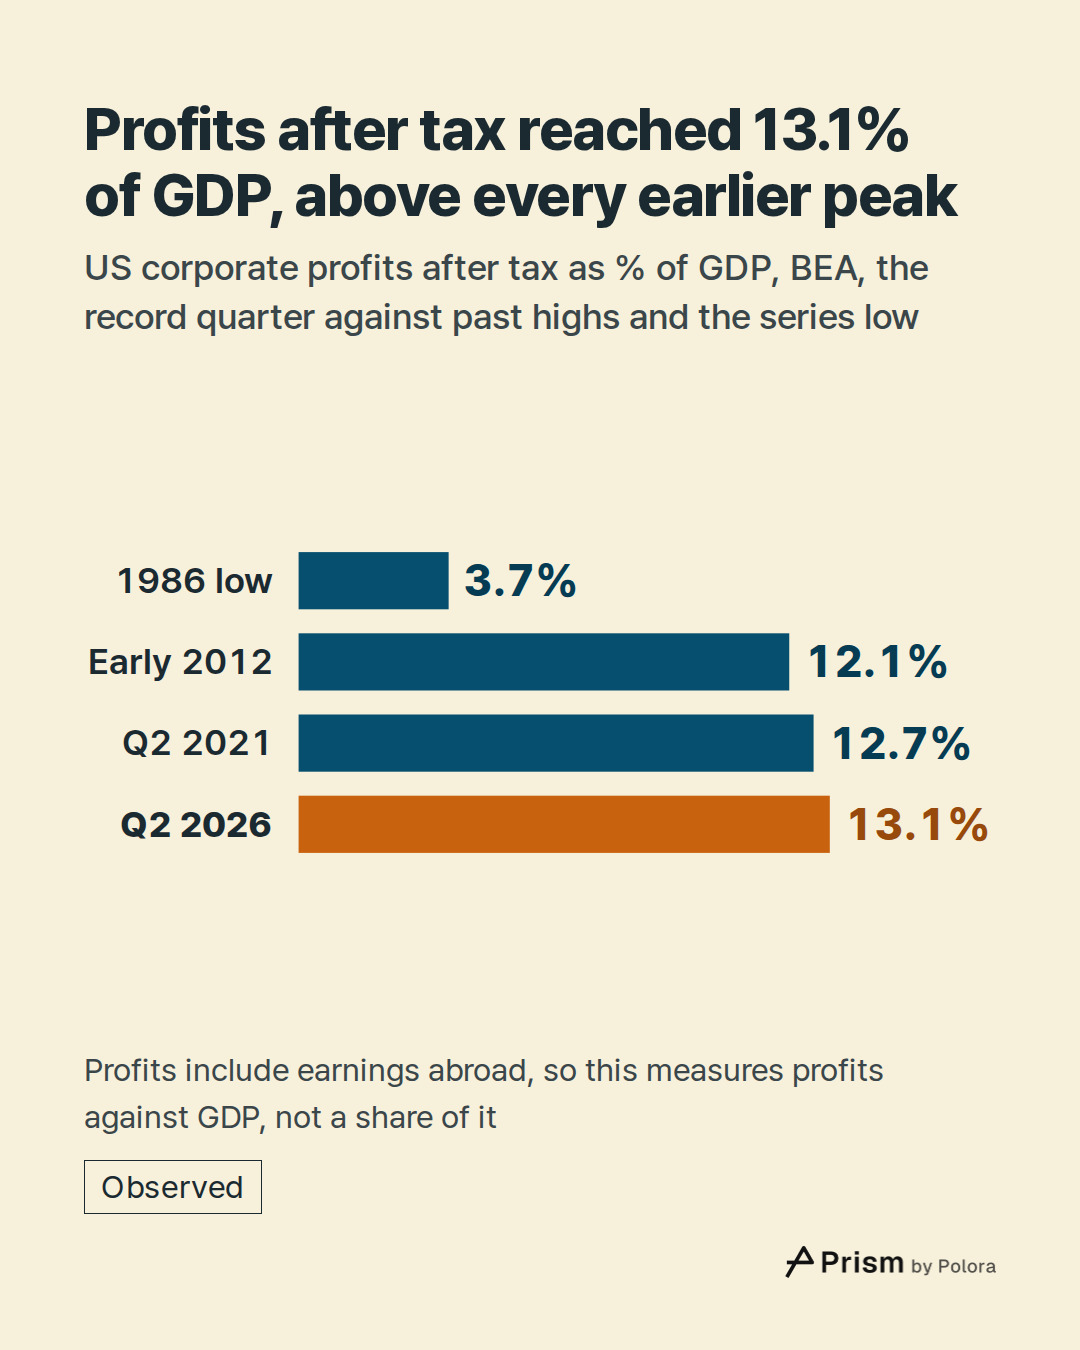
In the second quarter of 2026, April to June, profits after tax came to 13.1% of GDP. The previous high was 12.7% in the second quarter of 2021, and before 2020 the high was 12.1%, in early 2012. The low point of the whole series was 3.7%, in 1986.
The comparison is with GDP, but profits are not a slice of it. GDP counts what is produced inside the United States, while US corporations' profits include what they earn abroad. The figure for the part earned abroad comes from BEA's adjusted measure of profits, not the measure behind the record. On that measure, the net amount from the rest of the world, receipts from abroad less payments abroad, was 11.6% of profits in the second quarter of 2026. So the right reading is "profits measured against the size of the economy", not "the share of the economy that went to profits".
Nearly eighty years in two lines
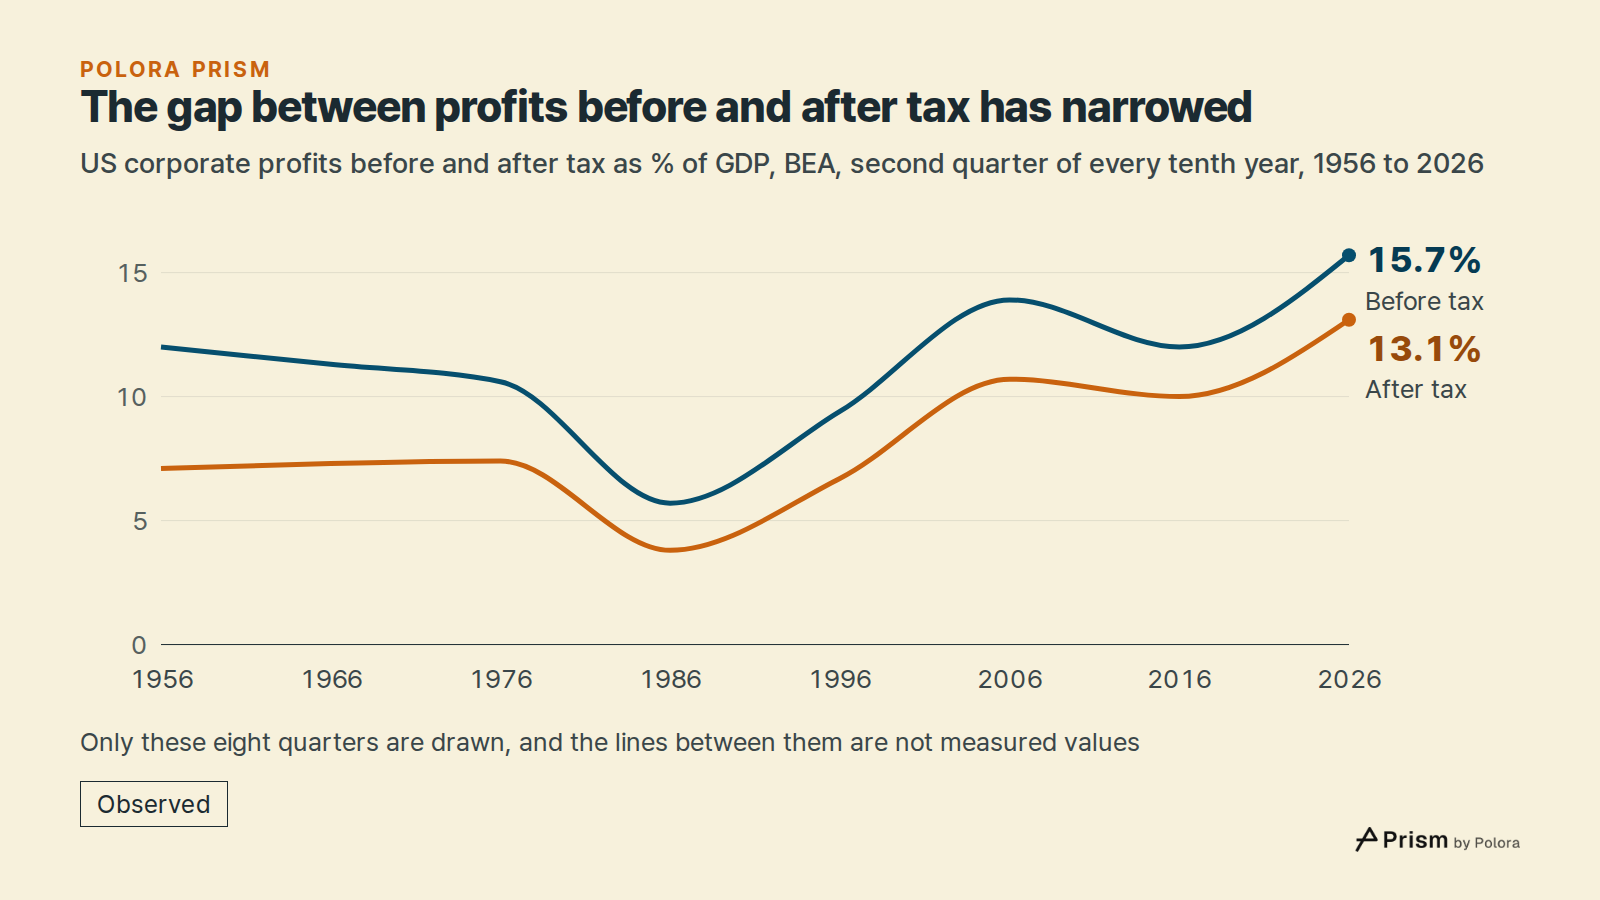
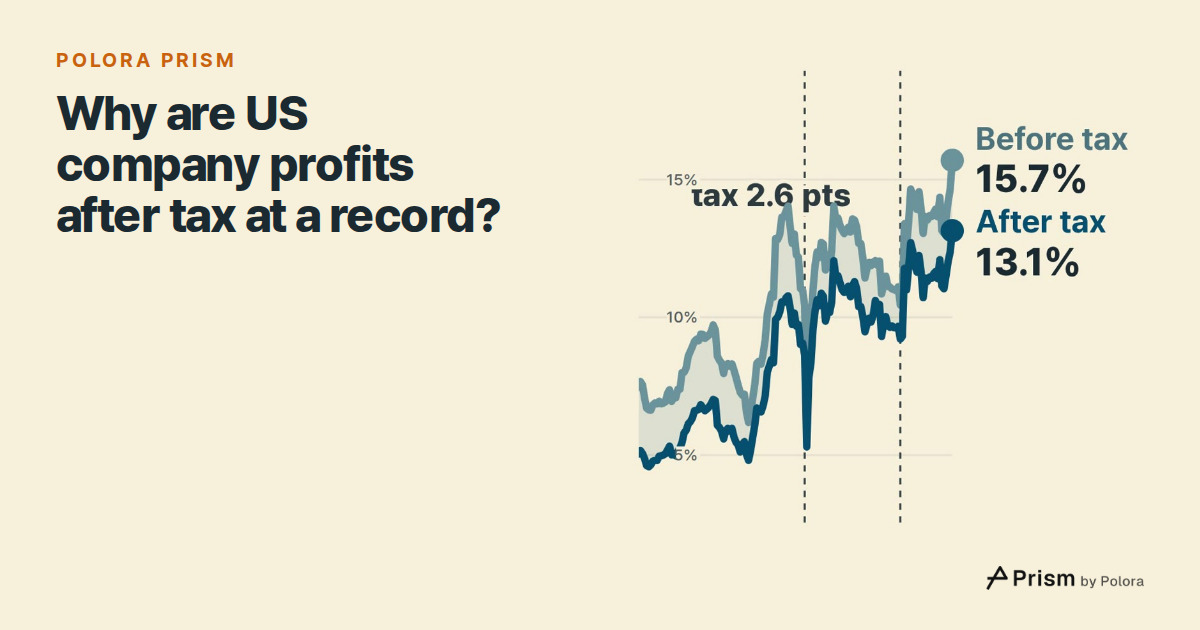
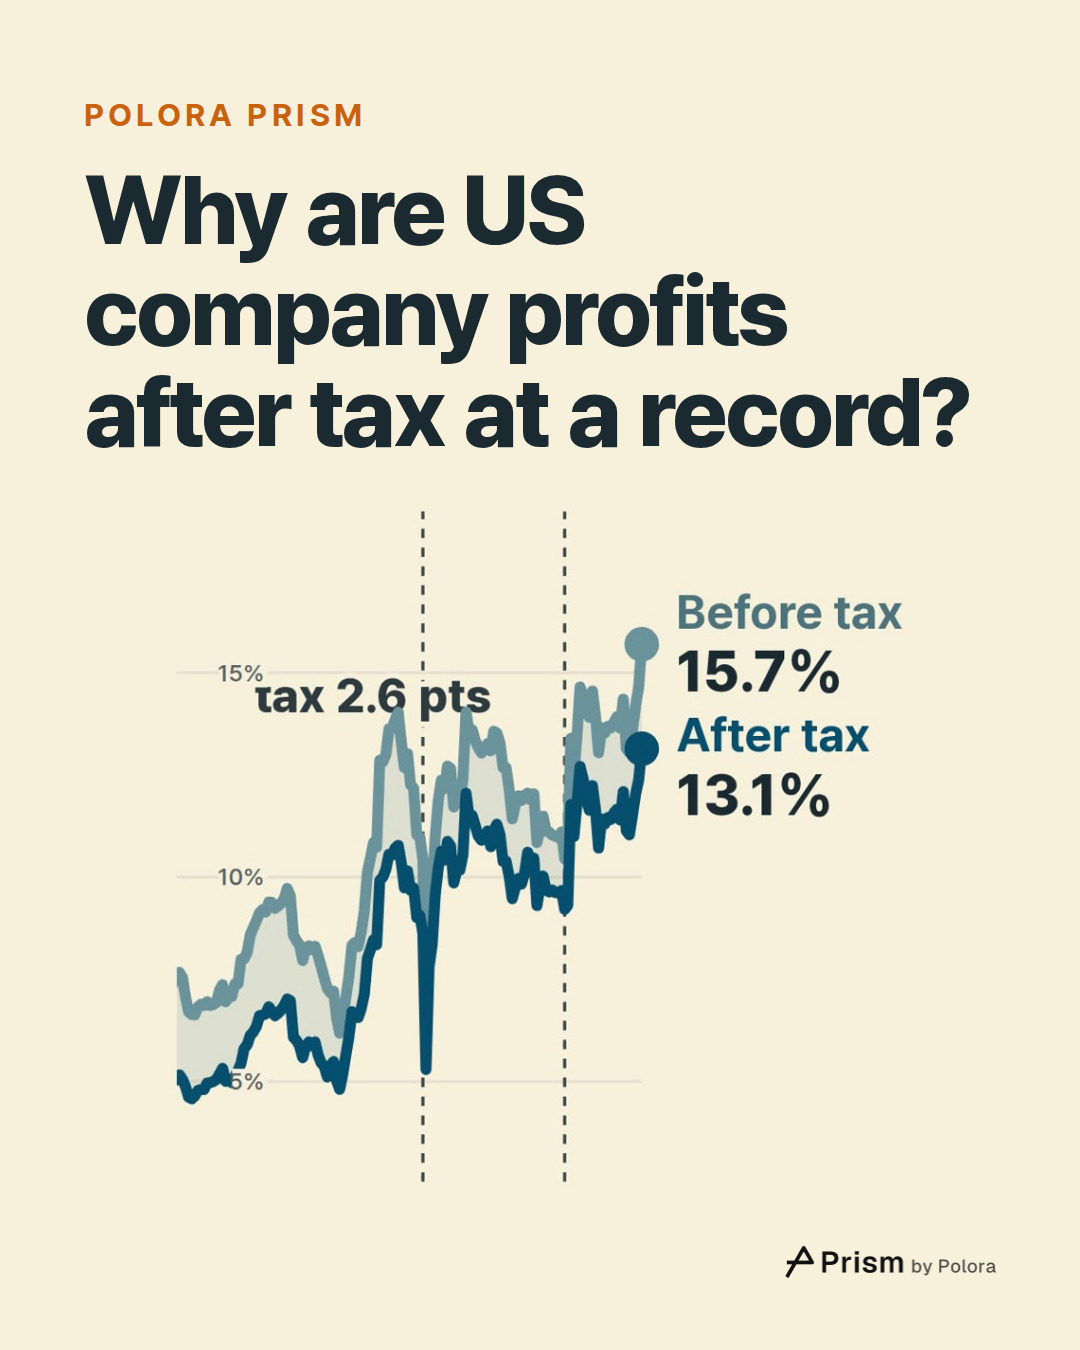
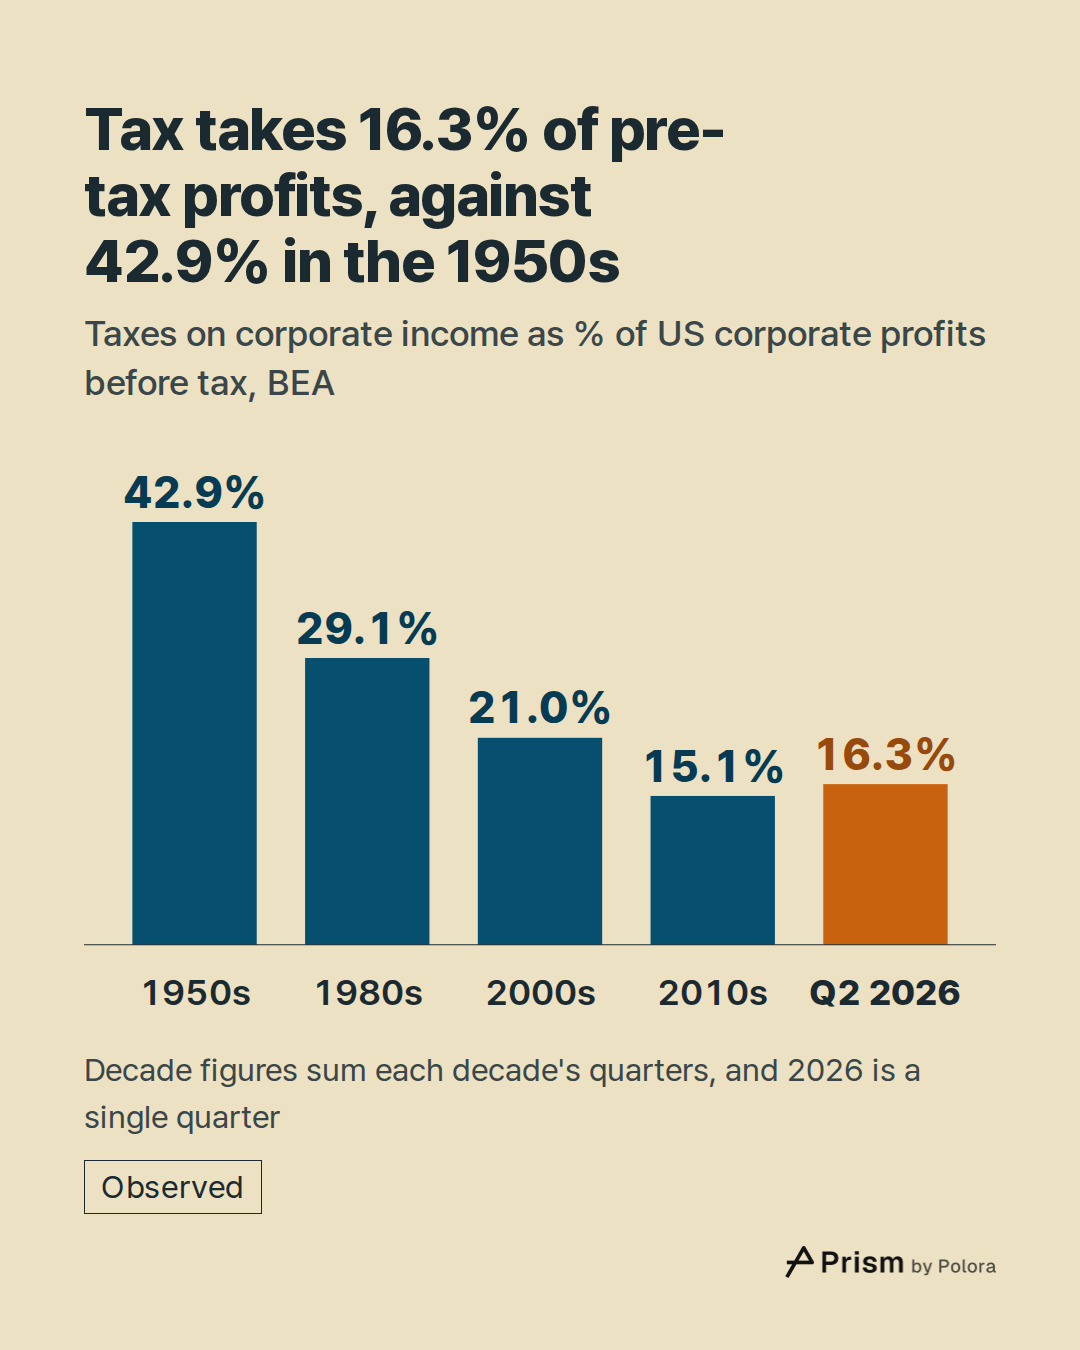
The film that comes with this piece draws two lines, profits before tax and profits after tax, each against GDP. The space between them is BEA's taxes on corporate income. In the 1950s that space was wide : summing the decade's quarters, tax took 42.9% of profits before tax. Through the 1960s and 1970s both lines swung up and down while tax took a shrinking share, and profits after tax then sank to their 1986 low. From there they climbed back with big swings, fell in the 2008 financial crisis and reached 12.1% by 2012. They eased through the rest of the 2010s while staying well above their 1980s level, dipped in the 2020 pandemic recession and reached a new high of 12.7% in 2021.
Before tax, no record
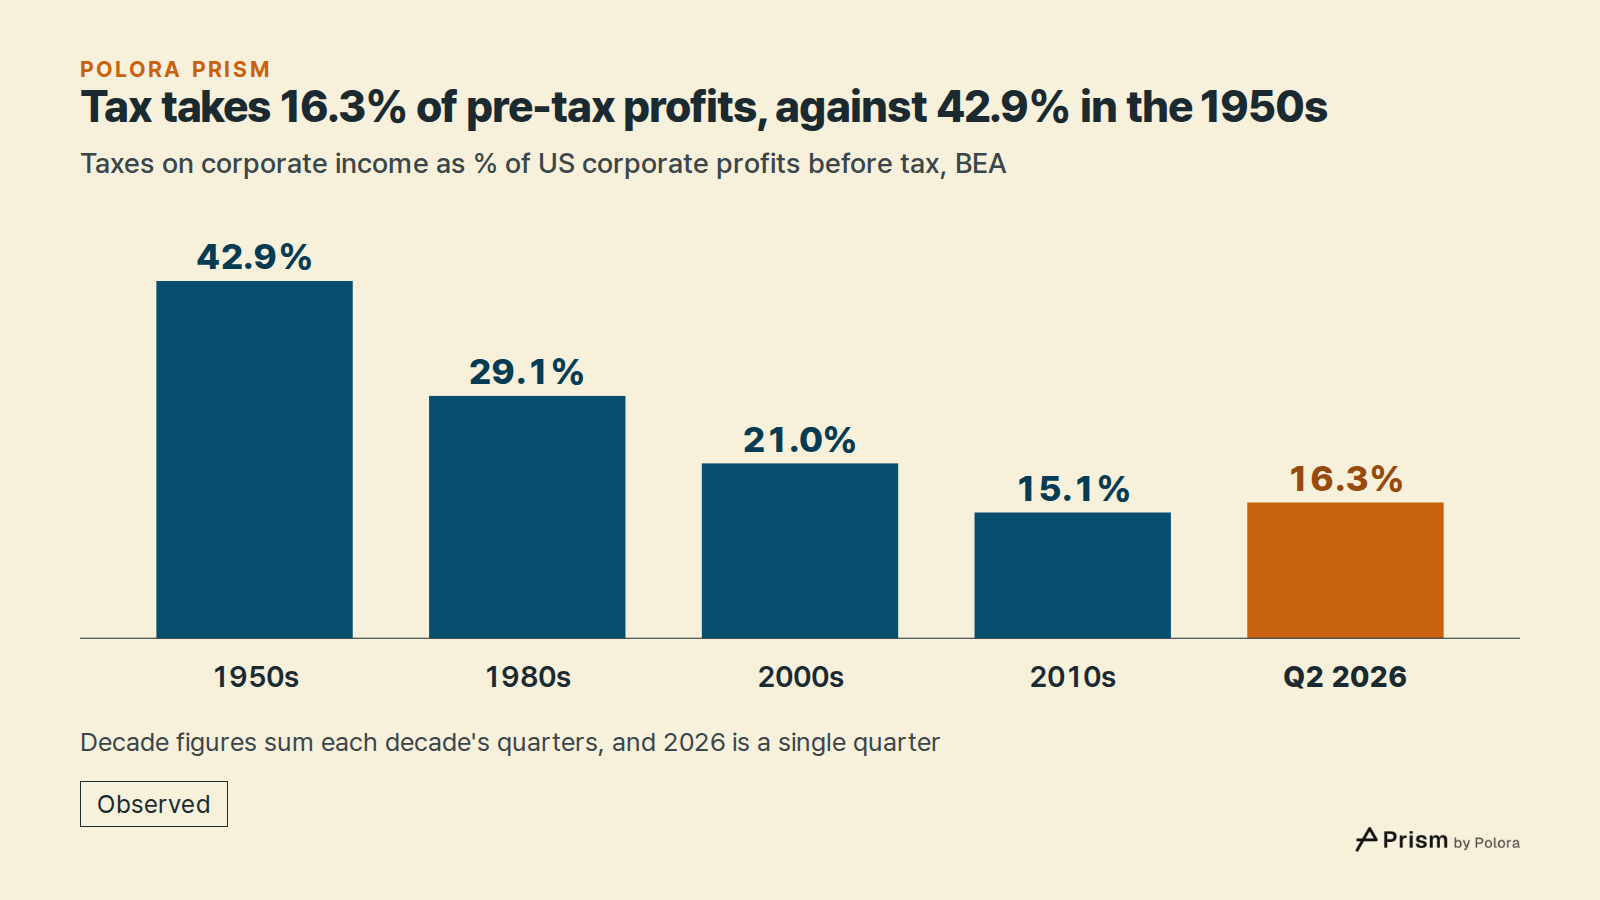
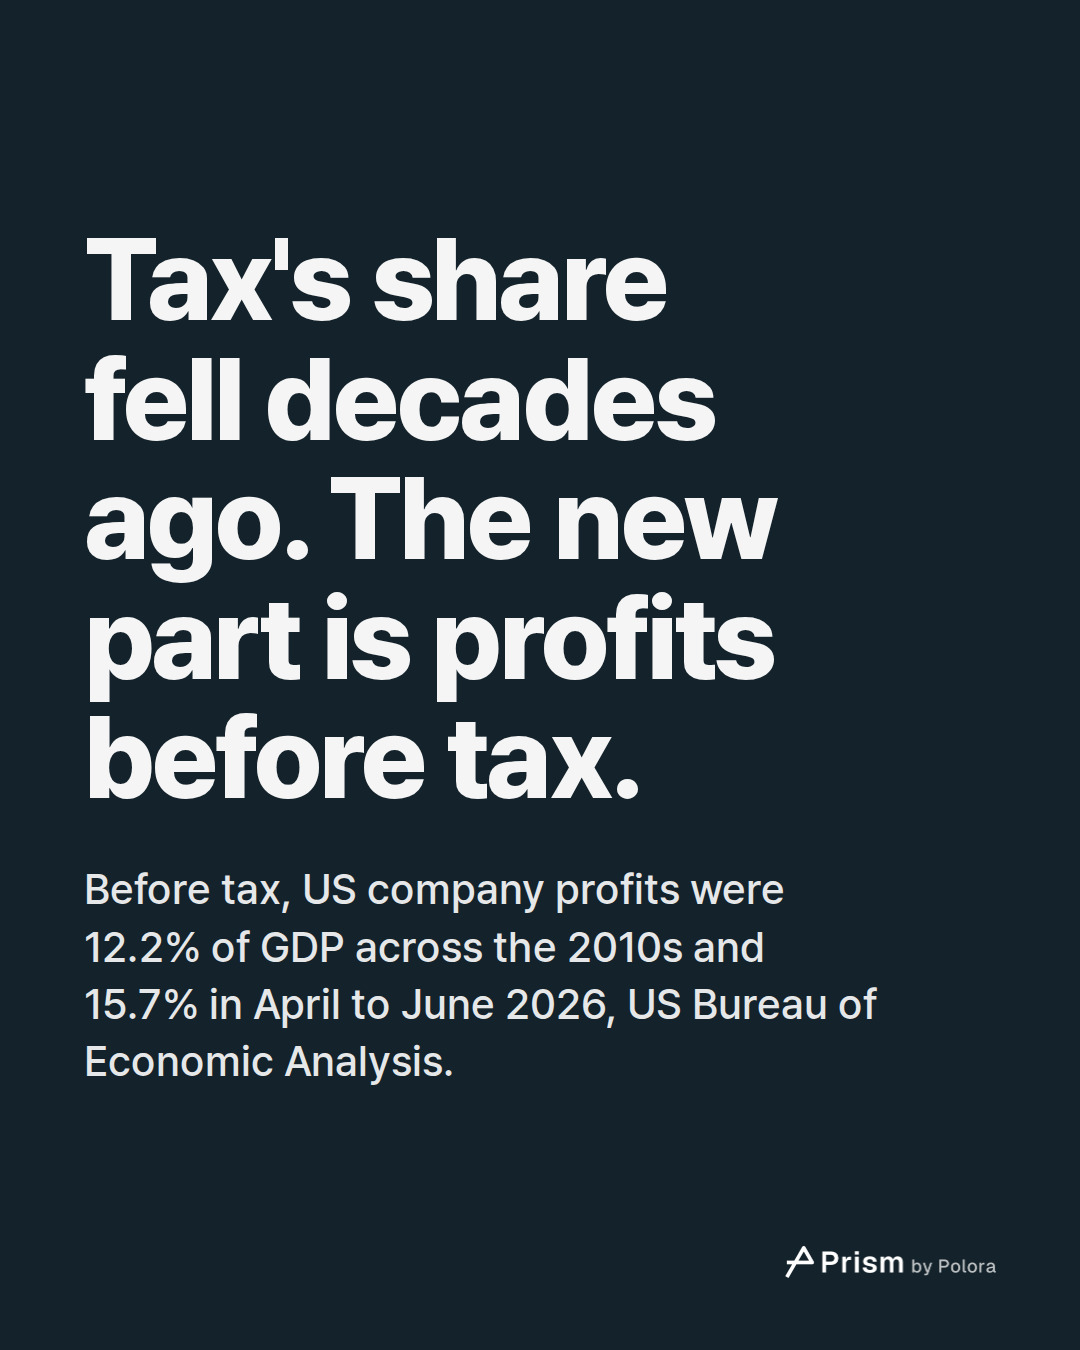
Before tax, profits were 15.7% of GDP in the second quarter of 2026. That is high, but below the 16.6% of the last quarter of 1950. The after-tax line holds the record because the gap between the two lines is so much thinner than it was then : tax took 16.3% of pre-tax profits in the second quarter of 2026.
Most of that fall happened long ago. Measured the same way, summing each decade's quarters, tax took 29.1% of pre-tax profits in the 1980s, 21.0% in the 2000s and 15.1% in the 2010s. The share in the second quarter of 2026 is a little higher than the 2010s figure, not lower. What has changed since the 2010s is the before-tax line : pre-tax profits came to 12.2% of GDP across that decade taken as a whole, and stood at 15.7% in the second quarter of 2026. The record is where the two meet : pre-tax profits back near their 1950 peak, and a tax share that fell decades ago.
Why tax takes less
The national accounts record how much tax on corporate income there was, not why it changed, and this piece does not split the fall between causes. Tax law is one candidate. The 2017 Tax Cuts and Jobs Act, for example, cut the federal corporate rate to a single flat rate from 2018. But by the measure here, more than three quarters of the fall from the 1950s had already happened by the 2000s.
A Federal Reserve staff note from 2022 by Michael Smolyansky looked at a narrower group : the non-financial companies in Standard & Poor's main index of large US companies, using their reported accounts rather than BEA's. It found that interest and tax expenses fell steadily as a share of those companies' earnings before interest and tax, and that the major step down in their effective tax rate followed the 2017 law. By comparing inflation-adjusted yearly growth rates with and without that decline, it found that falling interest and tax costs accounted, mechanically, for about one-third of their profit growth from the end of 2004 to early 2022. That calculation describes a past period for listed companies, and it is not the same measure as the lines in the film.
What the tax gap contains
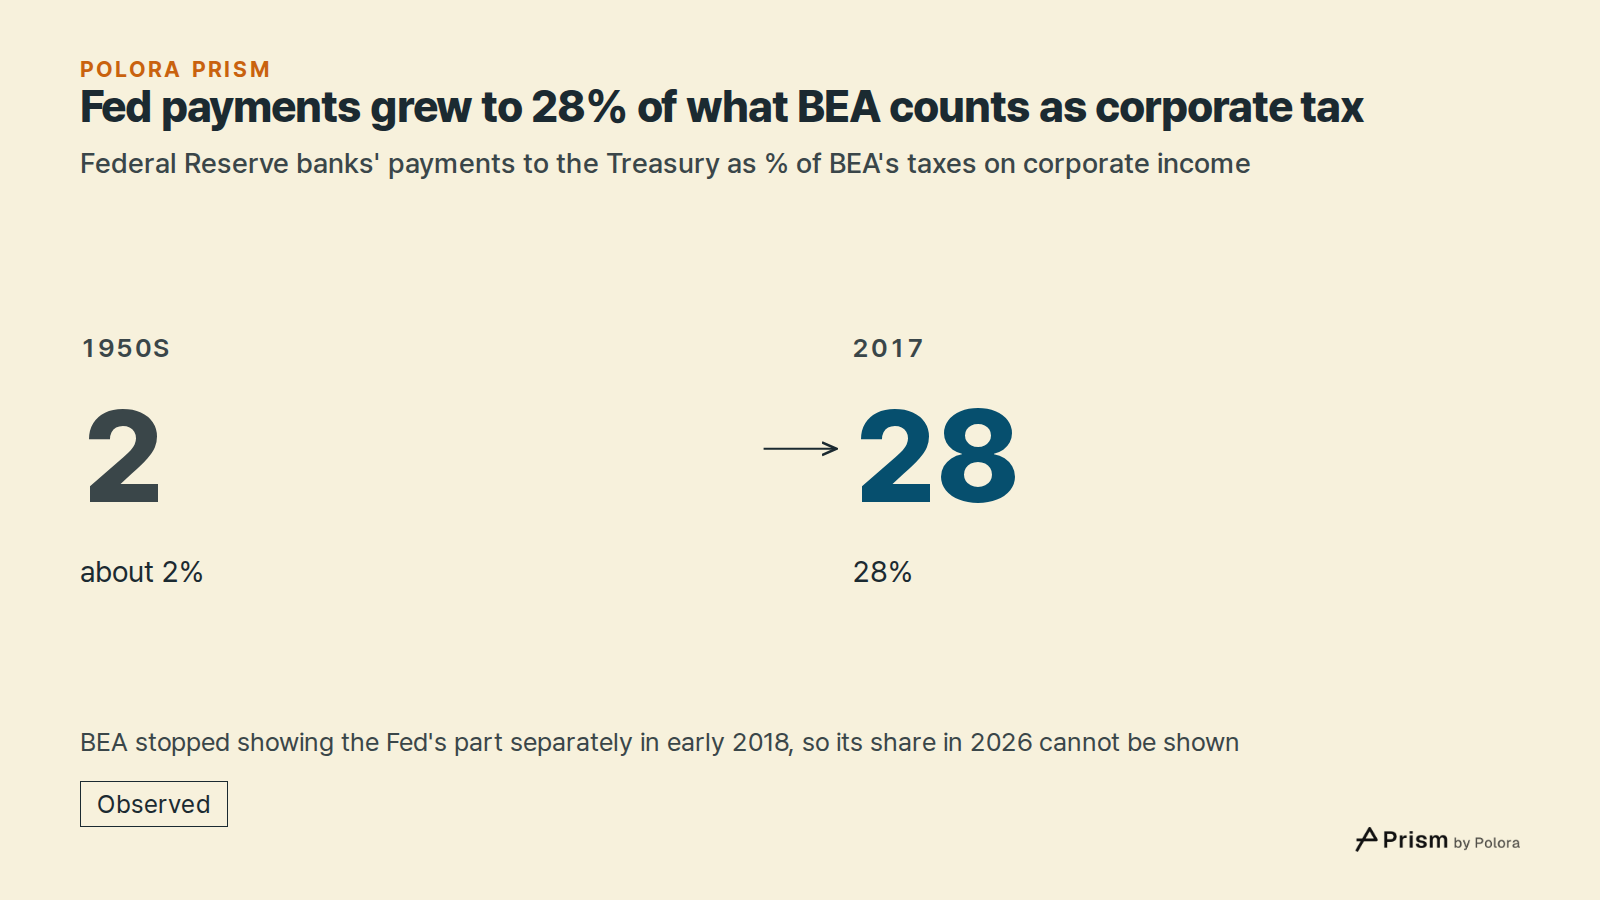
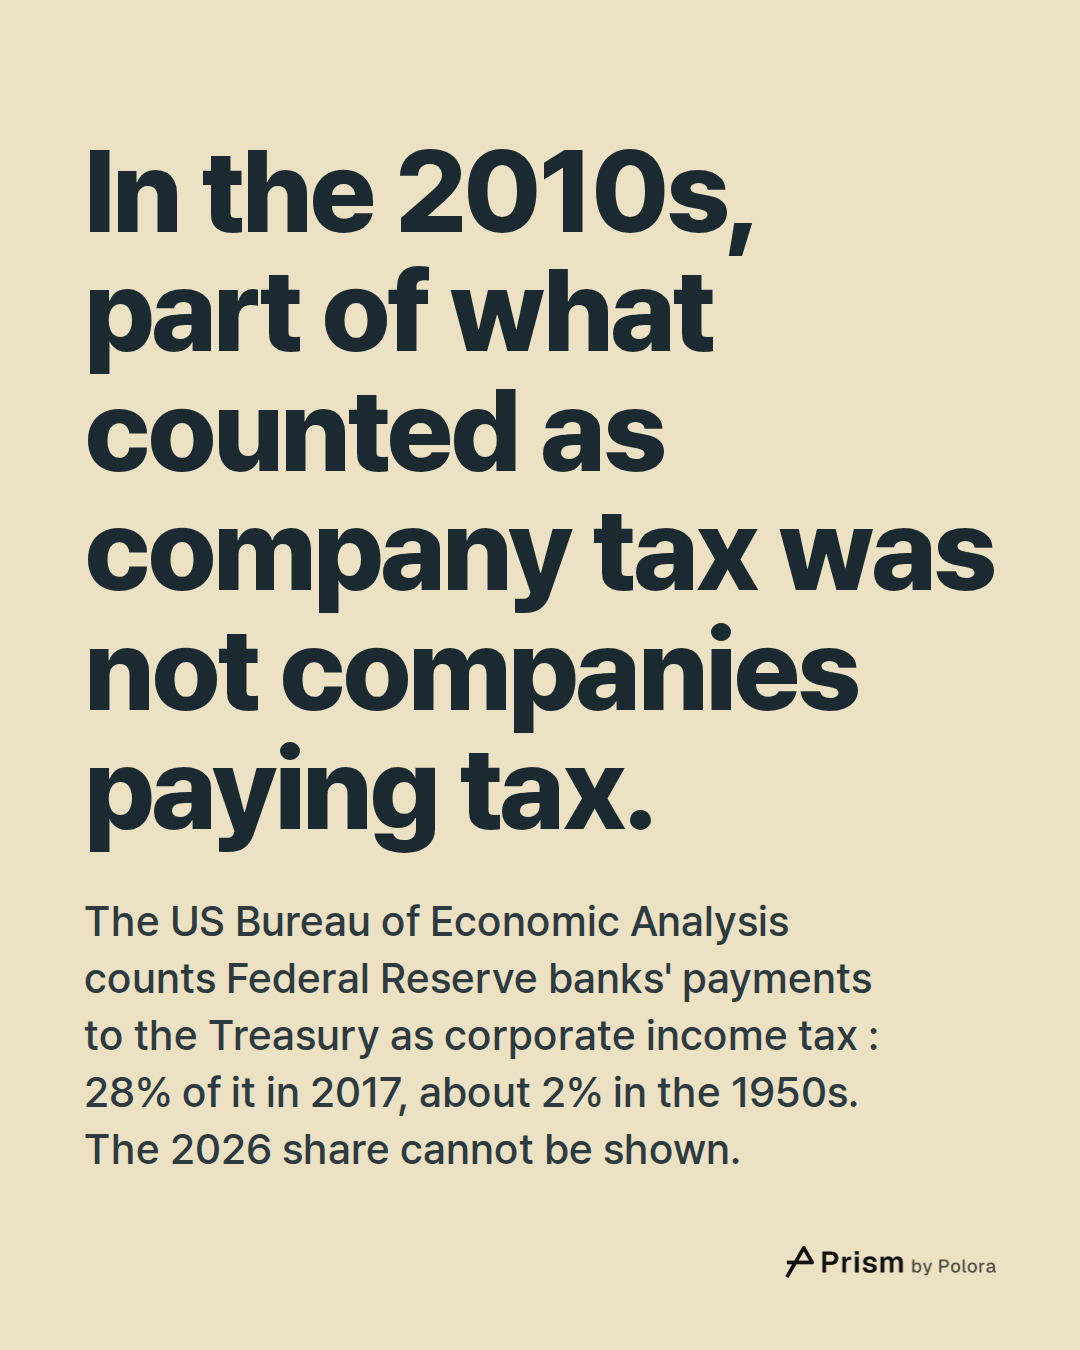
BEA counts the payments the Federal Reserve banks make to the Treasury among taxes on corporate income, and it published them as a separate line until early 2018. In the 1950s they were about 2% of those taxes. In 2017, the last full year shown separately, they were 28%. So in the 2010s a sizeable part of what the gap counts as tax was not companies paying tax. For the latest quarters BEA no longer publishes the Fed's part separately. The Fed's own report says its combined net income was negative on net from September 2025 to March 2026, with the shortfall carried as a "deferred asset", though some Reserve Banks still made payments to the Treasury in some weeks. How much of the 2026 tax figure comes from the Fed cannot be shown from these figures.
How firm the number is
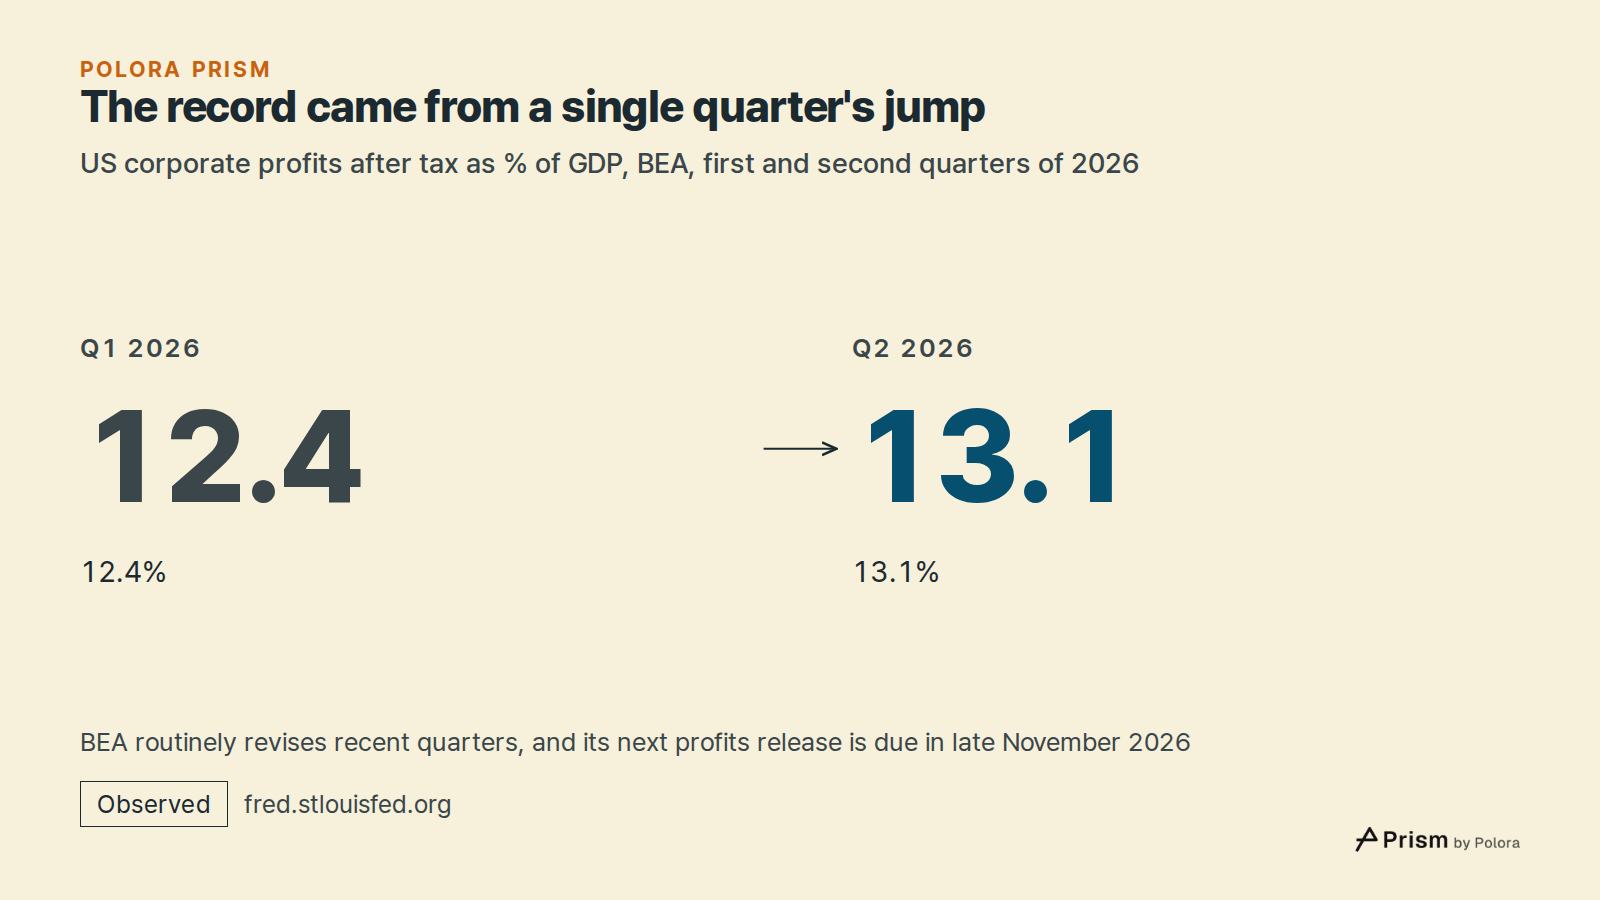
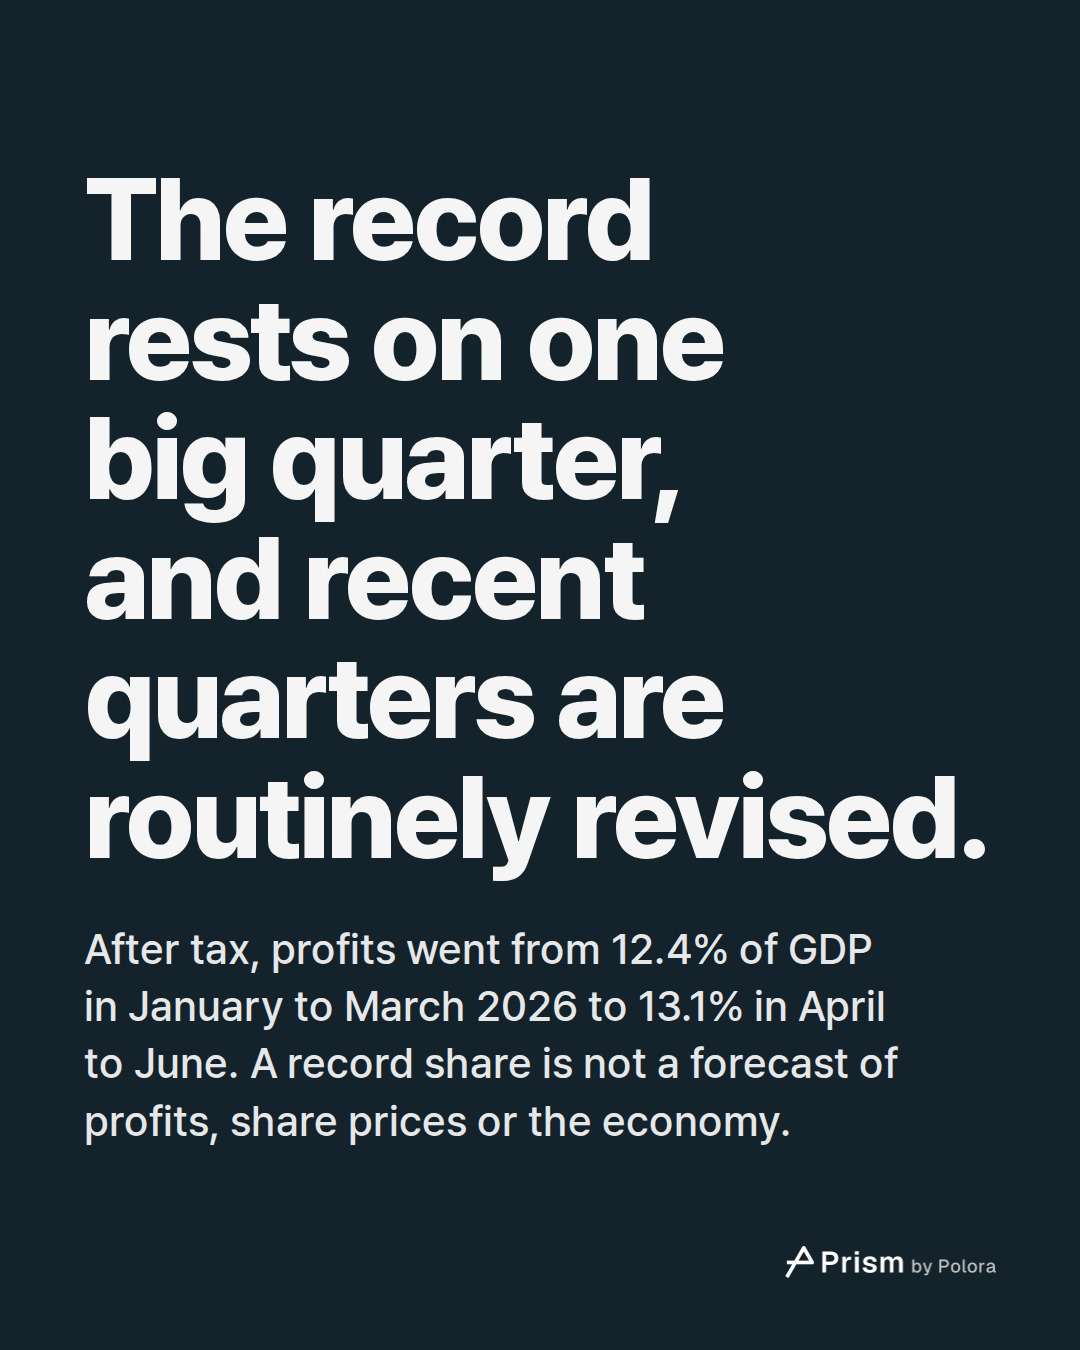
The record rests on a single big quarter. Profits after tax rose by $332 billion at an annual rate between the first and second quarters of 2026, lifting them from 12.4% of GDP to 13.1%. BEA's figures for the second quarter came out at the end of September 2026 with its yearly update of the accounts, and recent quarters are routinely revised later. BEA's next release with corporate profits, for the third quarter, is due in late November 2026.
The record also shows on BEA's other measure, profits from current production, which adjusts for inventory values and depreciation. After tax, that measure was 11.9% of GDP in the second quarter of 2026, the highest in its own history and above its previous peak in 2021. The two measures define profit differently, so their levels should not be compared with each other, only each with its own history.
A record share says how large profits are next to the economy now. It is not a forecast of profits, of share prices or of where the economy goes next.
- FRED, Federal Reserve Bank of St. Louis: Corporate Profits After Tax (without IVA and CCAdj), CP, from the US Bureau of Economic Analysis]
- FRED: National income: Corporate profits before tax (without IVA and CCAdj), from BEA]
- FRED: Gross Domestic Product, from BEA]
- FRED: Taxes on corporate income, from BEA]
- FRED: Corporate Profits After Tax with IVA and CCAdj, from BEA]
- FRED: Corporate Profits with IVA and CCAdj, from BEA]
- FRED: Corporate profits with IVA and CCAdj: Rest of the world, from BEA]
- FRED: Taxes on corporate income: Federal Reserve banks, from BEA]
![Sources 8 : fred.stlouisfed.org · FRED, Federal Reserve Bank of St. Louis: Corporate Profits After Tax (without IVA and CCAdj), CP, from the US Bureau of Economic Analysis], fred.stlouisfed.org · FRED: National income: Corporate profits before tax (without IVA and CCAdj), from BEA], fred.stlouisfed.](https://media.cdn.polora.ai/picks/2026/11/pickrun_4bbc82bd6cfa4040/EJH9FgGl0e4aSUQU-slide-08--why-are-us-company.jpg)