Two rates at opposite ends of the market
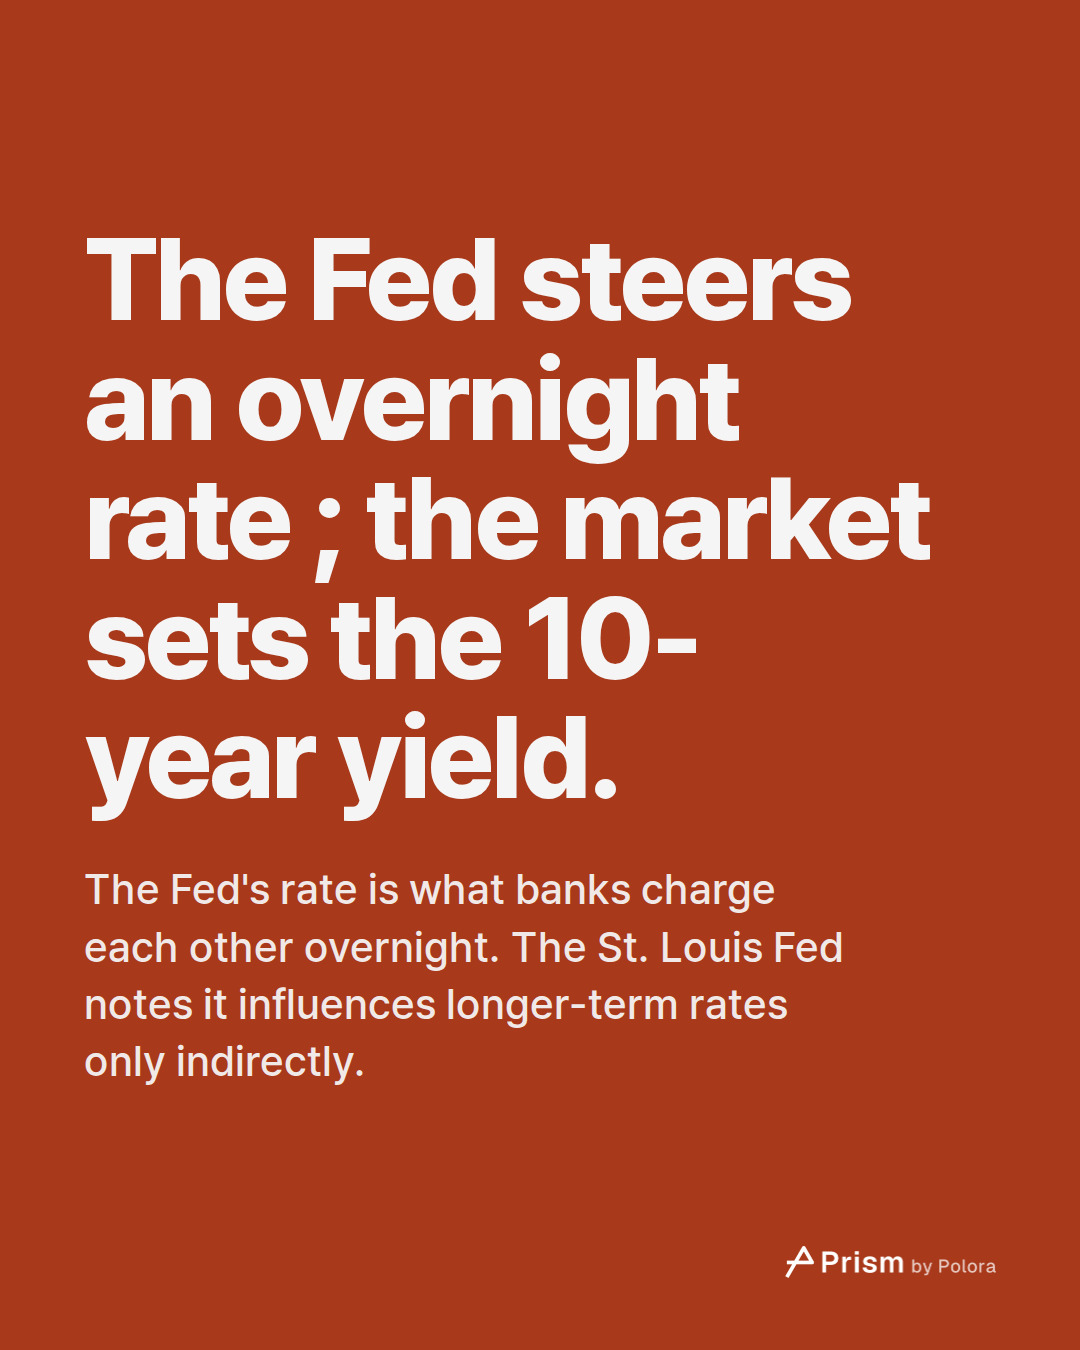
The Fed's rate is the effective federal funds rate. Banks charge it when they lend to each other overnight, and the Fed steers it into a target range that its policy committee sets at meetings held eight times a year. The 10-year yield is the daily market yield on US Treasury debt at a constant ten-year maturity, read off the Treasury yield curve and published in the Fed's H.15 release of selected interest rates. The St. Louis Fed's notes on the federal funds rate say it influences longer-term rates, such as mortgage rates, only indirectly. In 2022 and 2023 the two rose together. Since the Fed's first cut they have gone opposite ways.
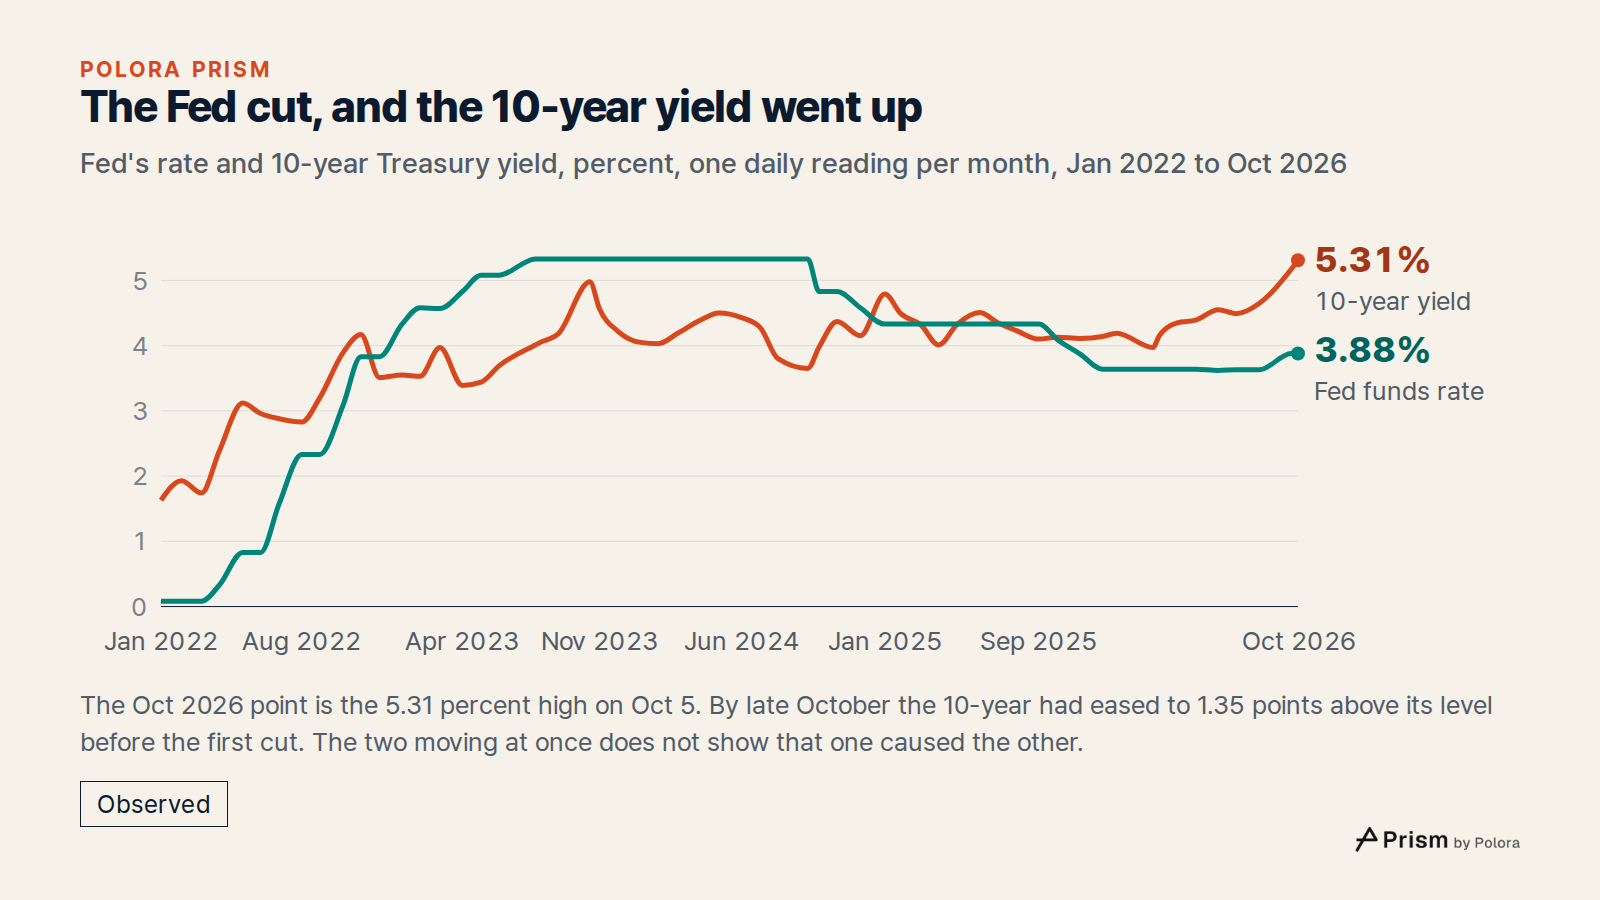
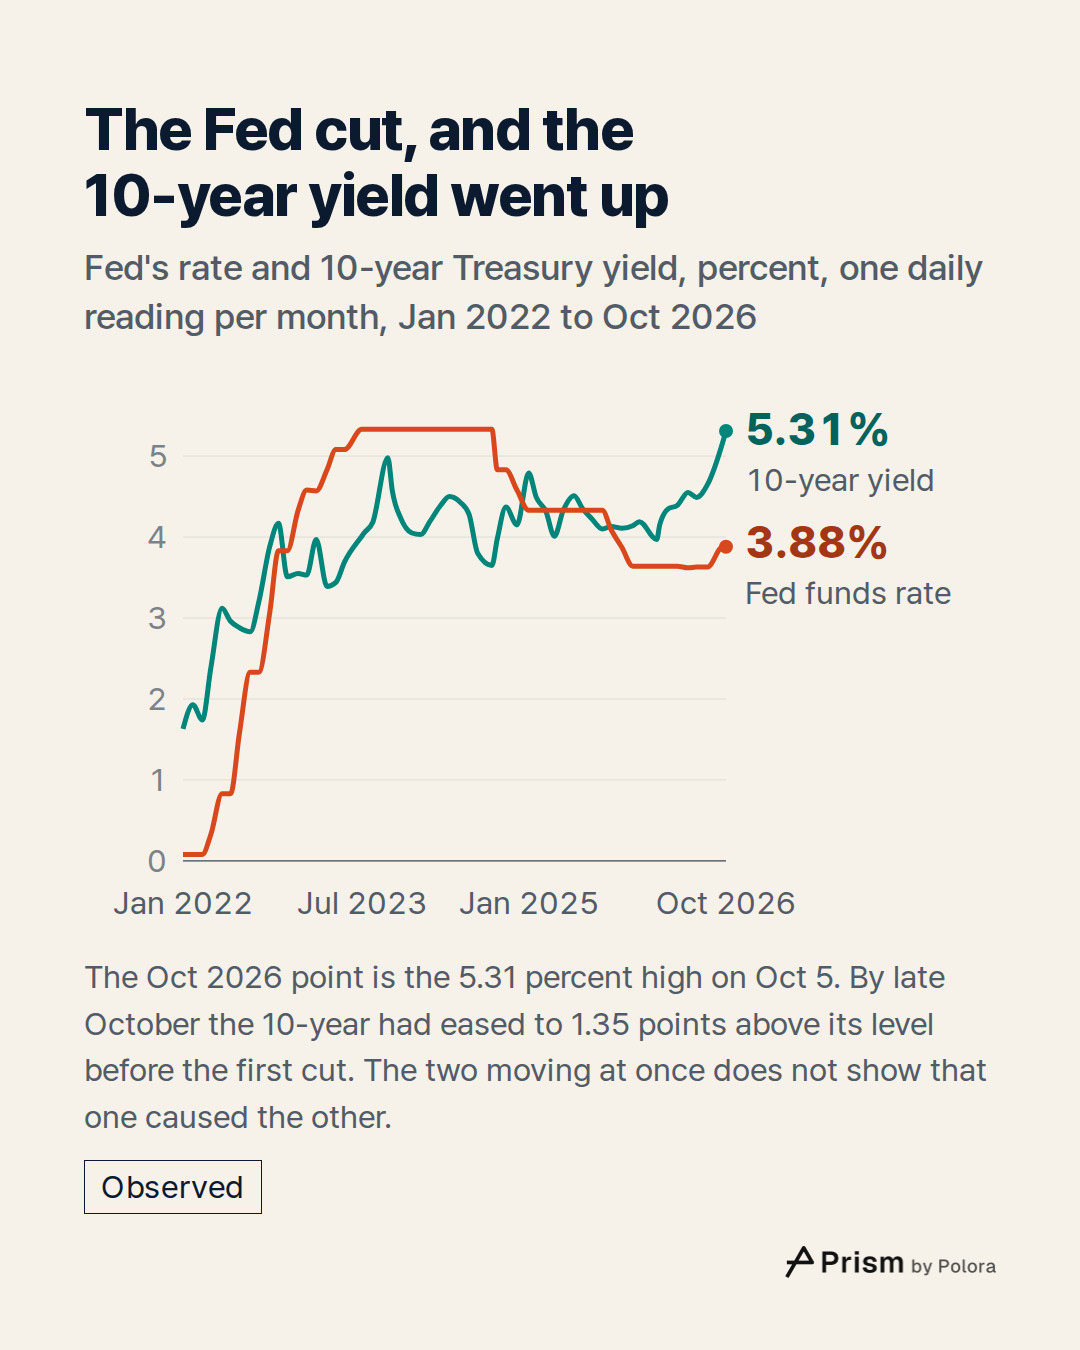
At the start of 2022 the Fed's rate was 0.08 percent and the 10-year yield was 1.63 percent. From March 2022 the Fed raised quickly, saying in its statement that inflation remained elevated. By July 2023 its rate had reached 5.33 percent. The 10-year rose with it and topped out at 4.98 percent in October 2023. The Fed then left its rate unchanged for over a year while the 10-year eased.
The cuts, and the yield that went up
On the day before the first cut was announced, in mid-September 2024, the Fed's rate stood at 5.33 percent and the 10-year at 3.65 percent. The Fed then cut its target range by half a point, to 4.75 to 5.00 percent. It said it had gained greater confidence that inflation was moving sustainably toward its goal.
The 10-year went the other way. By mid-January 2025 it had climbed to 4.79 percent. The Fed went on cutting. By December 2025 it had lowered the range six times, by 1.75 points in all, to 3.50 to 3.75 percent. Yet from the first cut through the latest data in late October 2026, the 10-year has not been at or below that 3.65 percent on a single day. Its lowest daily level since then is 3.70 percent, on the day of that first cut.
2026 : an oil shock, a rate rise and a high not seen since 2002
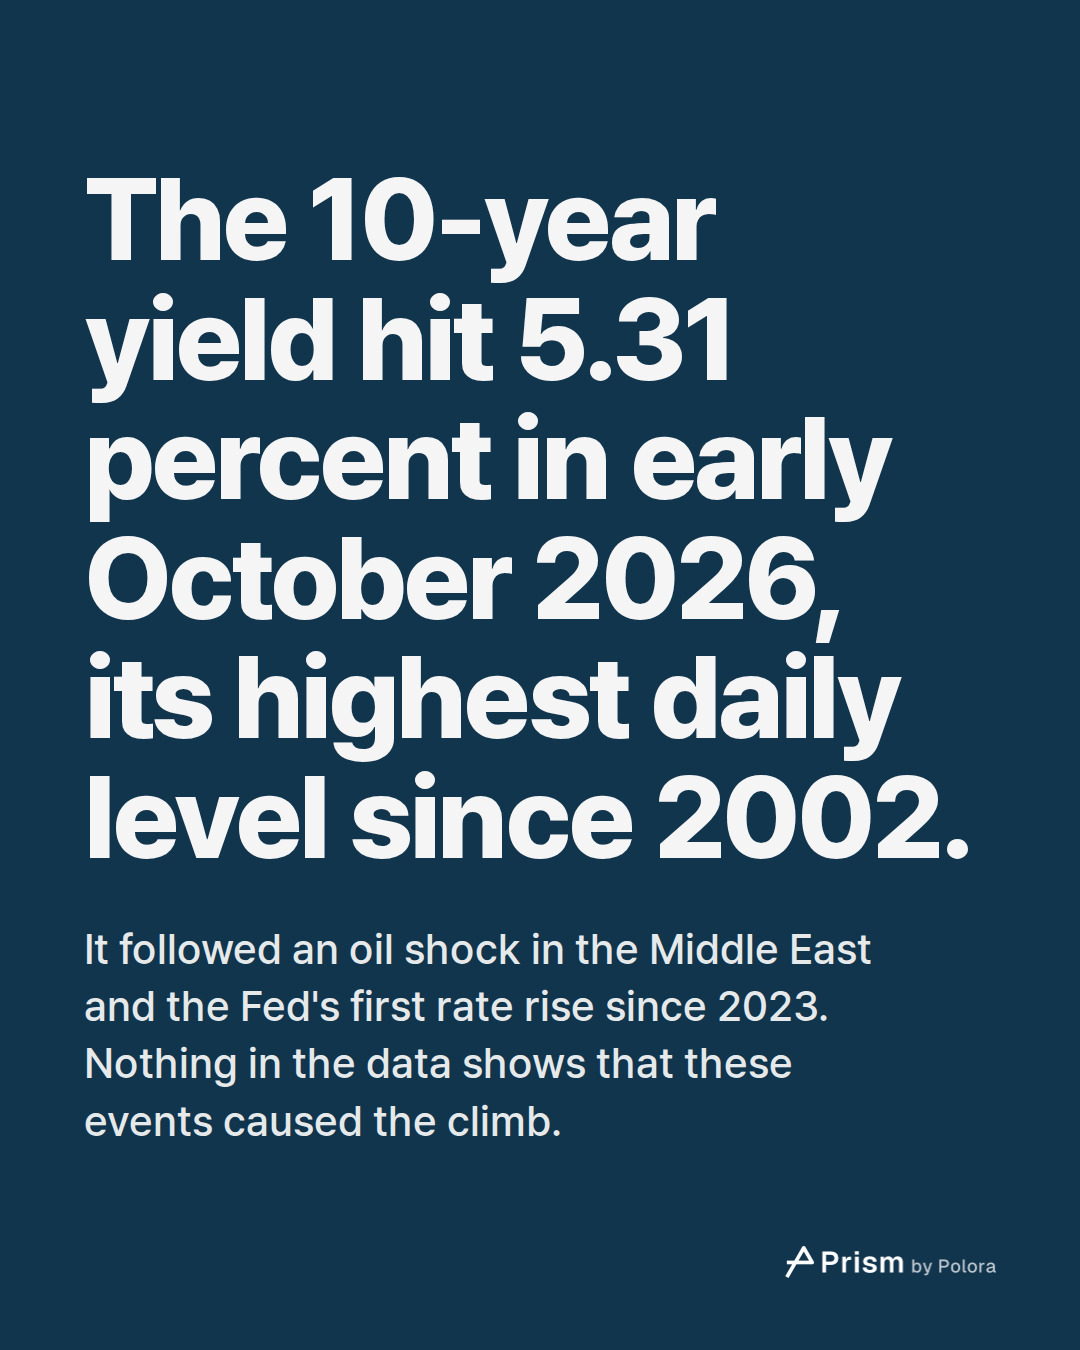
The 10-year had eased back to 3.97 percent by late February 2026. At the end of February came military action in the Middle East, followed by what the US Energy Information Administration calls the de facto closure of the Strait of Hormuz. Most shipping stopped using the strait, and crude oil and fuel prices jumped. Over the following months the 10-year climbed, with dips along the way. Those events and that climb happened at the same time. Nothing in the rate data or in the sources behind this piece shows that one caused the other.
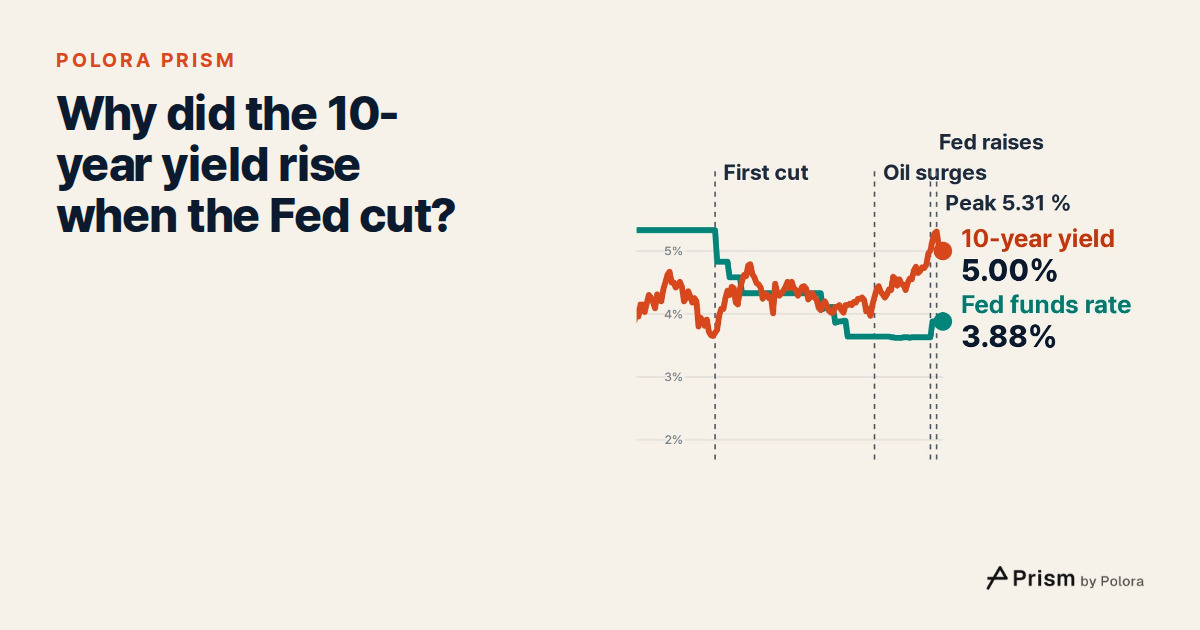
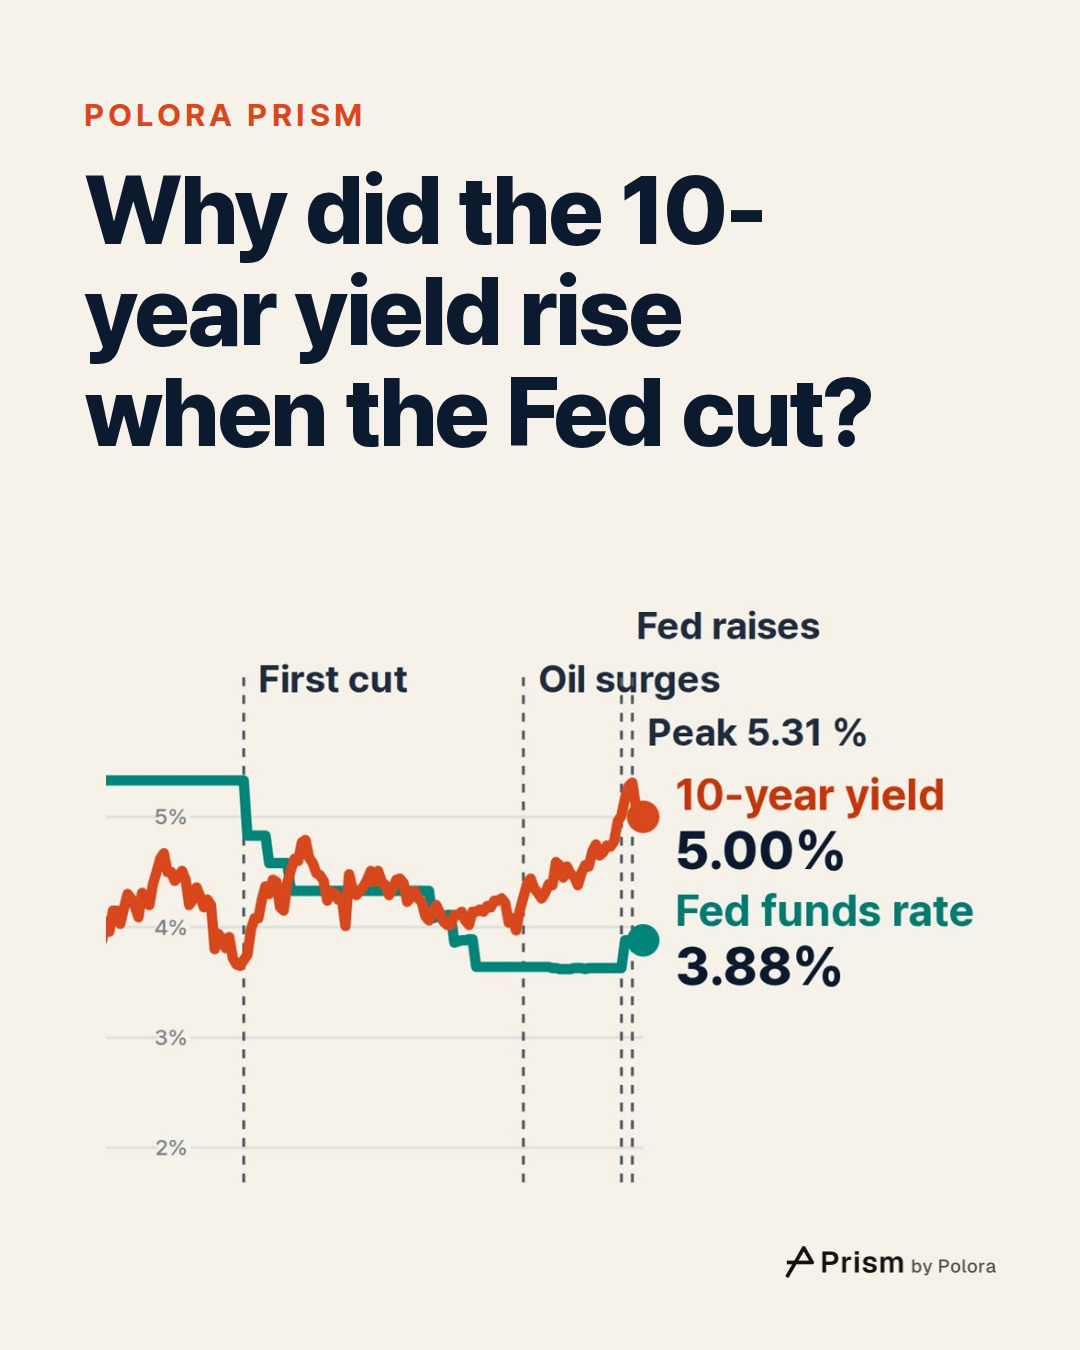
In mid-September 2026 the Fed raised its range by a quarter point, to 3.75 to 4.00 percent, its first increase since 2023. Its statement said : "Inflation remains elevated." It also said uncertainty "remains elevated owing, in part, to geopolitical developments." Early in October the 10-year reached 5.31 percent, its highest daily level since 2002.
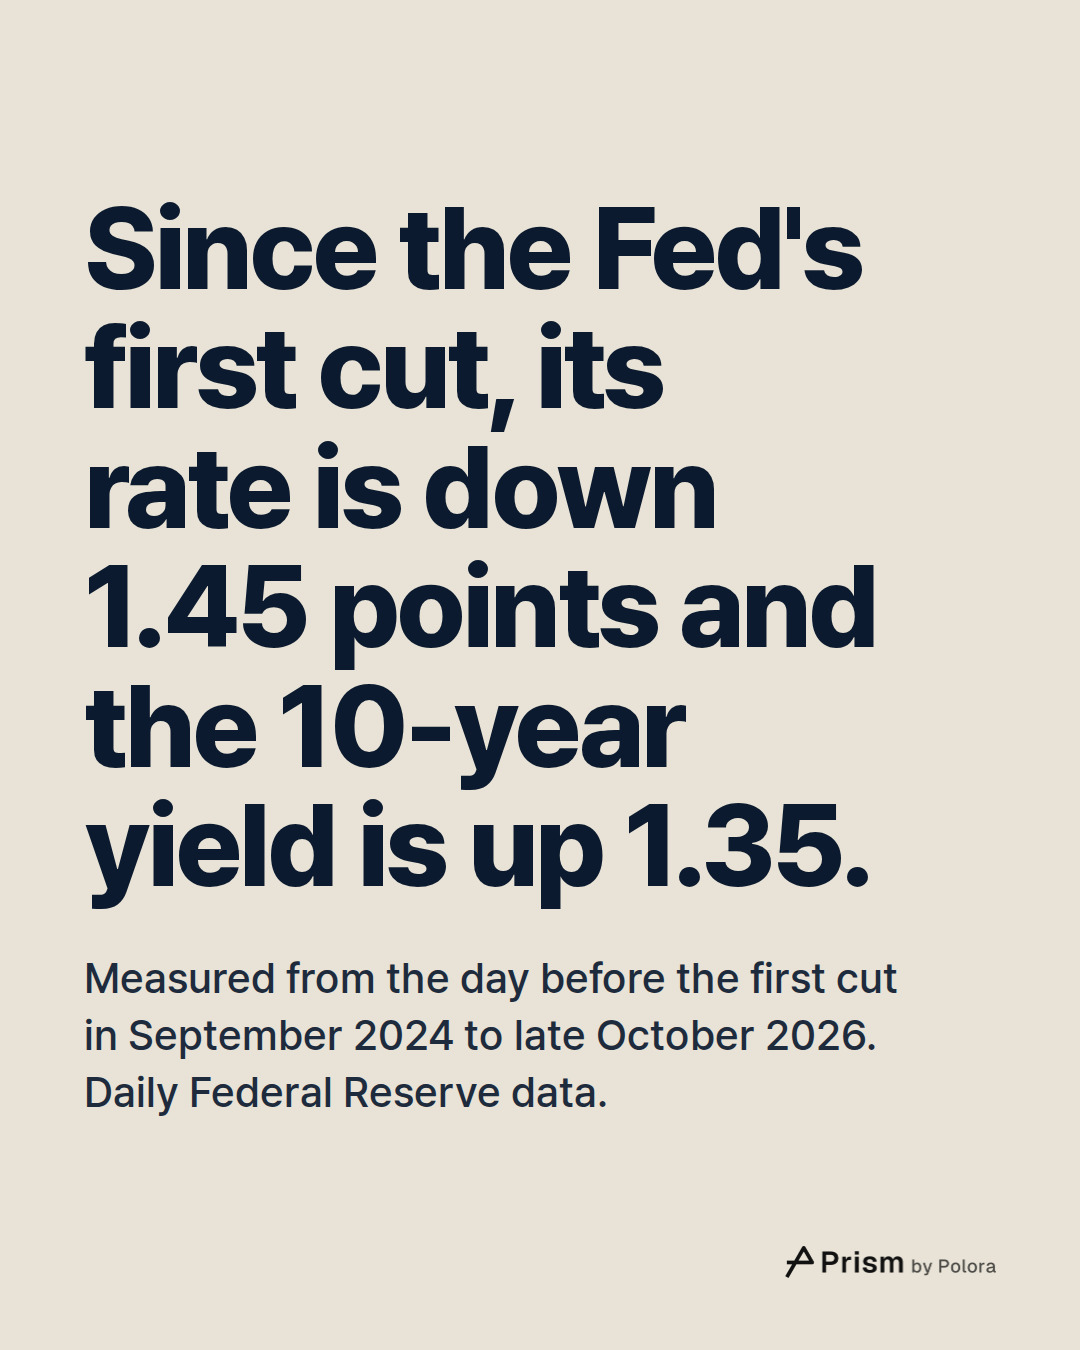
By late October the 10-year had eased from that peak, and the Fed's rate stood at 3.88 percent. Against the day before the first cut, the Fed's rate is down 1.45 points and the 10-year is up 1.35 points. On that latest day the 10-year sat 1.12 points above the Fed's rate. Before the cuts it sat below it.
What one Fed model makes of the rise
A 10-year yield can be split into two parts. One is the short-term rate expected to prevail, on average, over the ten years. The other is the term premium, which is what is left of the yield after that expected average. Neither part can be observed directly. The Federal Reserve Board publishes estimates of both from a staff model built by economists Don Kim and Jonathan Wright, and notes that these are a research product, not an official statistic. The Board's page for the model says the term premium reflects compensation for interest rate risk plus a technical effect it calls a convexity premium, and that it can be positive or negative.
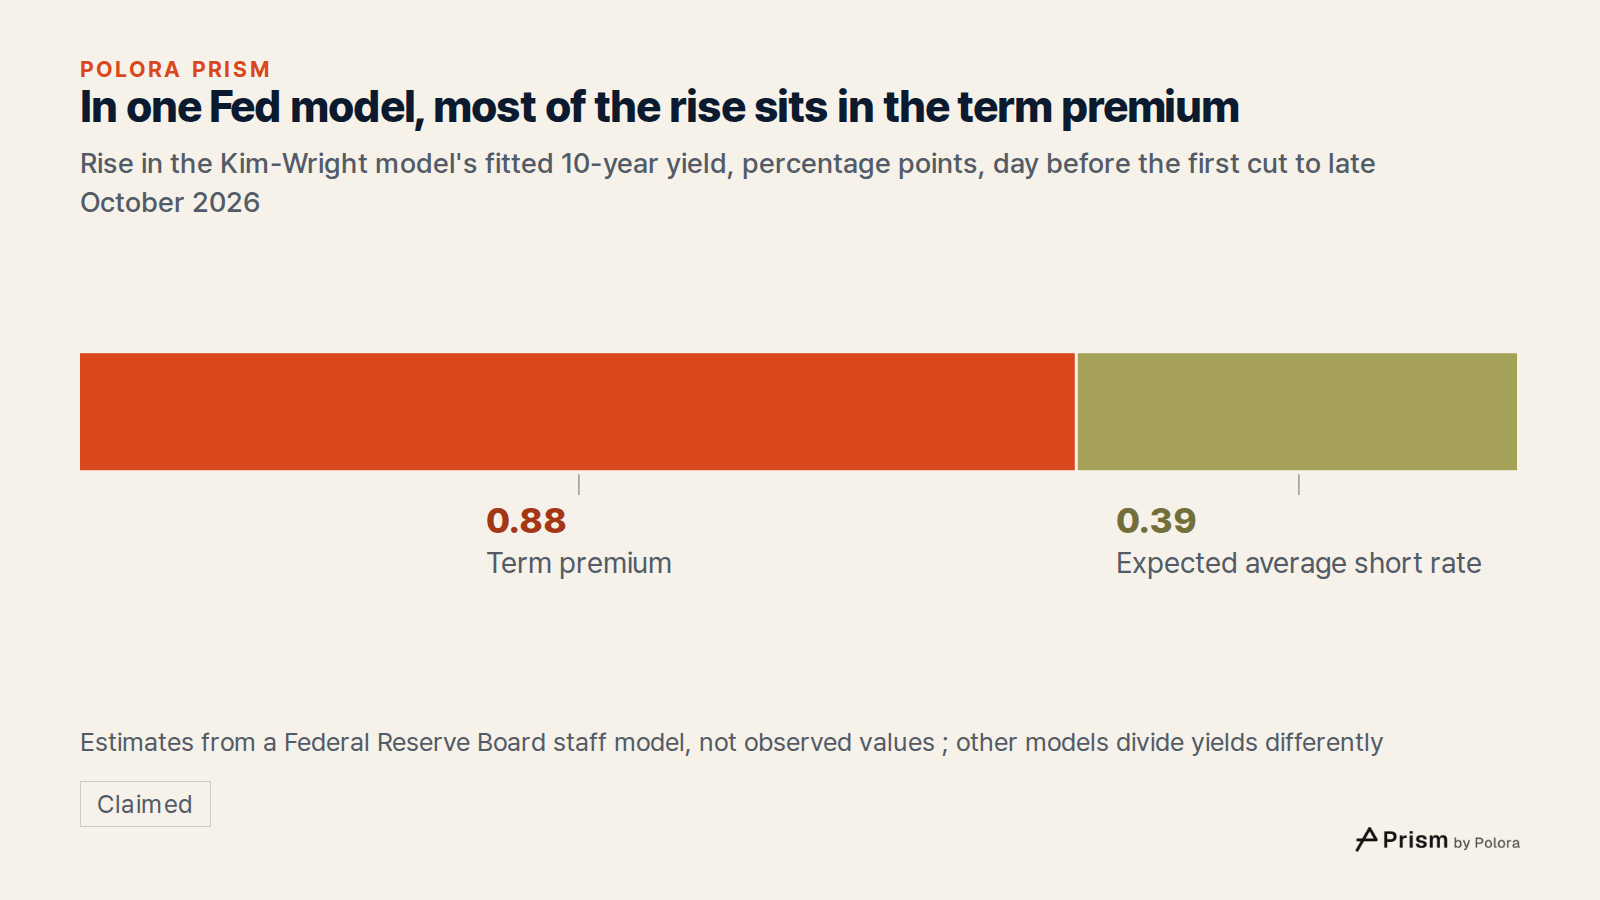
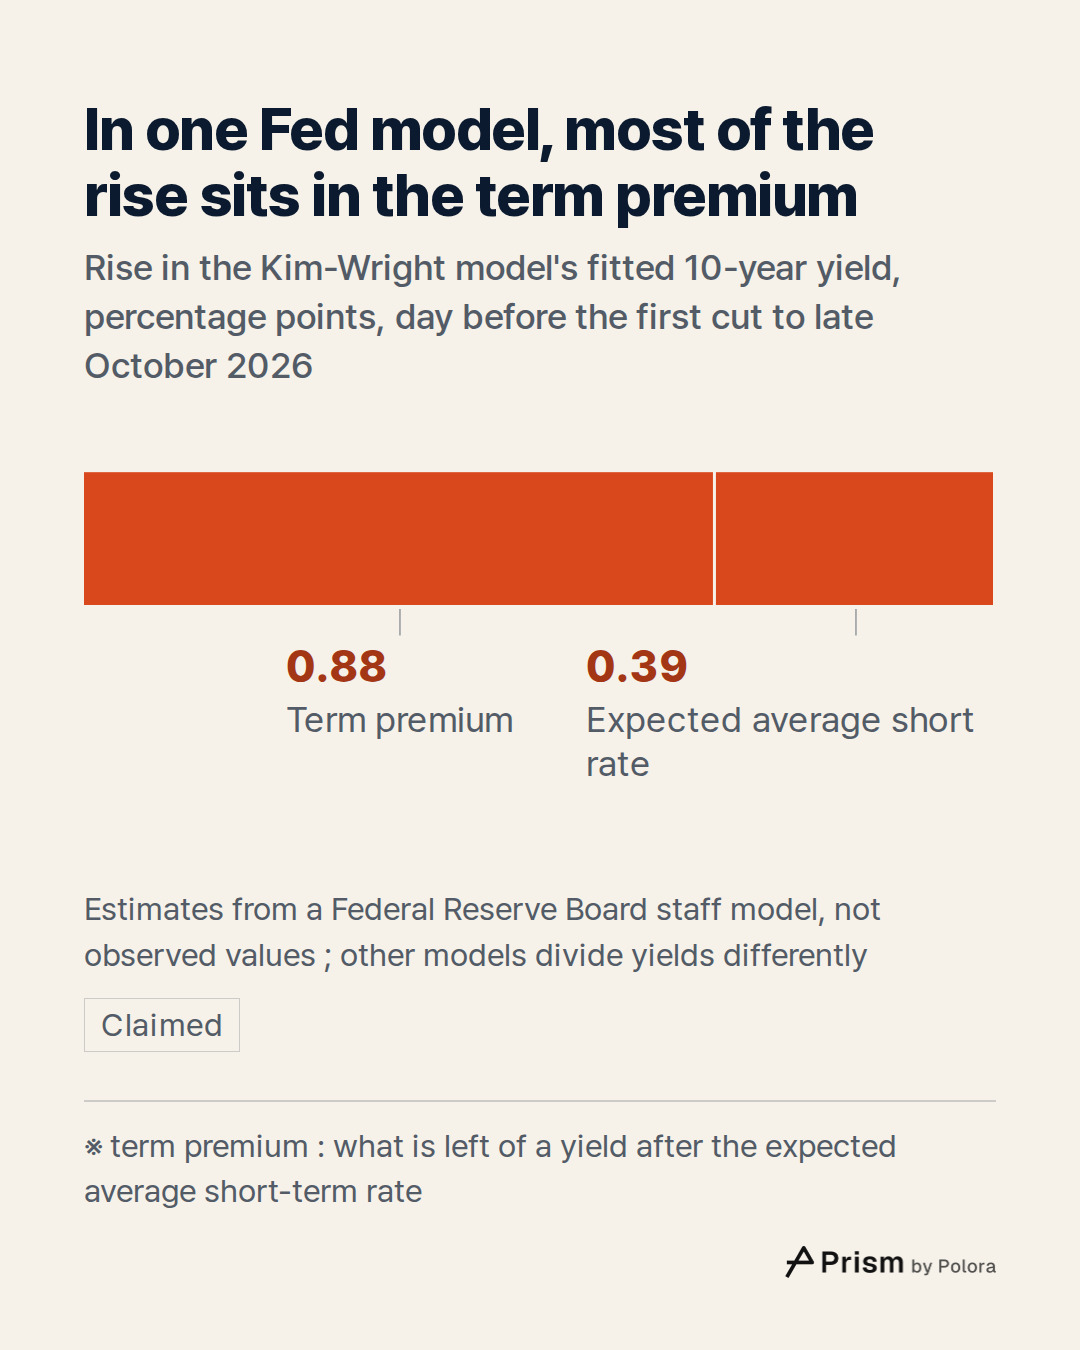
The model works on its own fitted yield for a 10-year zero-coupon bond, which is not the same measure as the market yield above. On the day before the first cut its fitted yield was 3.73 percent, while the market yield was 3.65. By the model's newest day in late October 2026, one trading day before the market figures above end, the fitted yield had risen 1.27 points. The model puts 0.88 of that rise in the term premium, which went from 0.06 to 0.94 percent. It puts 0.39 in the expected average short rate, which went from 3.67 to 4.06 percent.
So in this model, most of the rise shows up in the estimated term premium, and less of it in the estimated path of short-term rates. Both parts are estimates of things nobody can observe directly, and other models divide yields differently. The model also does not say why the premium rose.
What this shows and what it doesn't
This is a sequence of events, not proof of a cause. The two rates are daily figures from the Federal Reserve's H.15 release. The target range and the model estimates are separate Federal Reserve Board series. The 10-year figures were checked against the US Treasury's daily yield curve files and the Fed's rate against the New York Fed's own publication. The starting point matters. On the day of the first cut itself the 10-year was 3.70 percent, so measured from that day the rise is a little smaller. "Highest since 2002" compares daily levels : the last earlier day at or above 5.31 percent was in 2002. None of this says where either rate goes next.
- Federal Reserve Board via FRED, Federal Funds Effective Rate (DFF)]
- Federal Reserve Board via FRED, Market Yield on U.S. Treasury Securities at 10-Year Constant Maturity (DGS10)]
- Federal Reserve Board via FRED, Federal Funds Target Range, Upper Limit (DFEDTARU)]
- Federal Reserve Board via FRED, Federal Funds Target Range, Lower Limit (DFEDTARL)]
- Federal Reserve Board via FRED, Fitted Yield on a 10 Year Zero Coupon Bond (THREEFY10)]
- Federal Reserve Board via FRED, Term Premium on a 10 Year Zero Coupon Bond (THREEFYTP10)]
- Federal Reserve Board, Three-Factor Nominal Term Structure Model (Kim-Wright)]
- Federal Reserve Board, Kim-Wright model data file]
![Sources 8 : fred.stlouisfed.org · Federal Reserve Board via FRED, Federal Funds Effective Rate (DFF)], fred.stlouisfed.org · Federal Reserve Board via FRED, Market Yield on U.S. Treasury Securities at 10-Year Constant Maturity (DGS10)], fred.stlouisfed.org · Federal Reserve Board via FRED, Federal F](https://media.cdn.polora.ai/picks/2026/10/pickrun_ac94cb7acb3647a6/1QvFd4lbL0Ffcnum-slide-08--why-did-the-10.jpg)