What Apple counts as Services
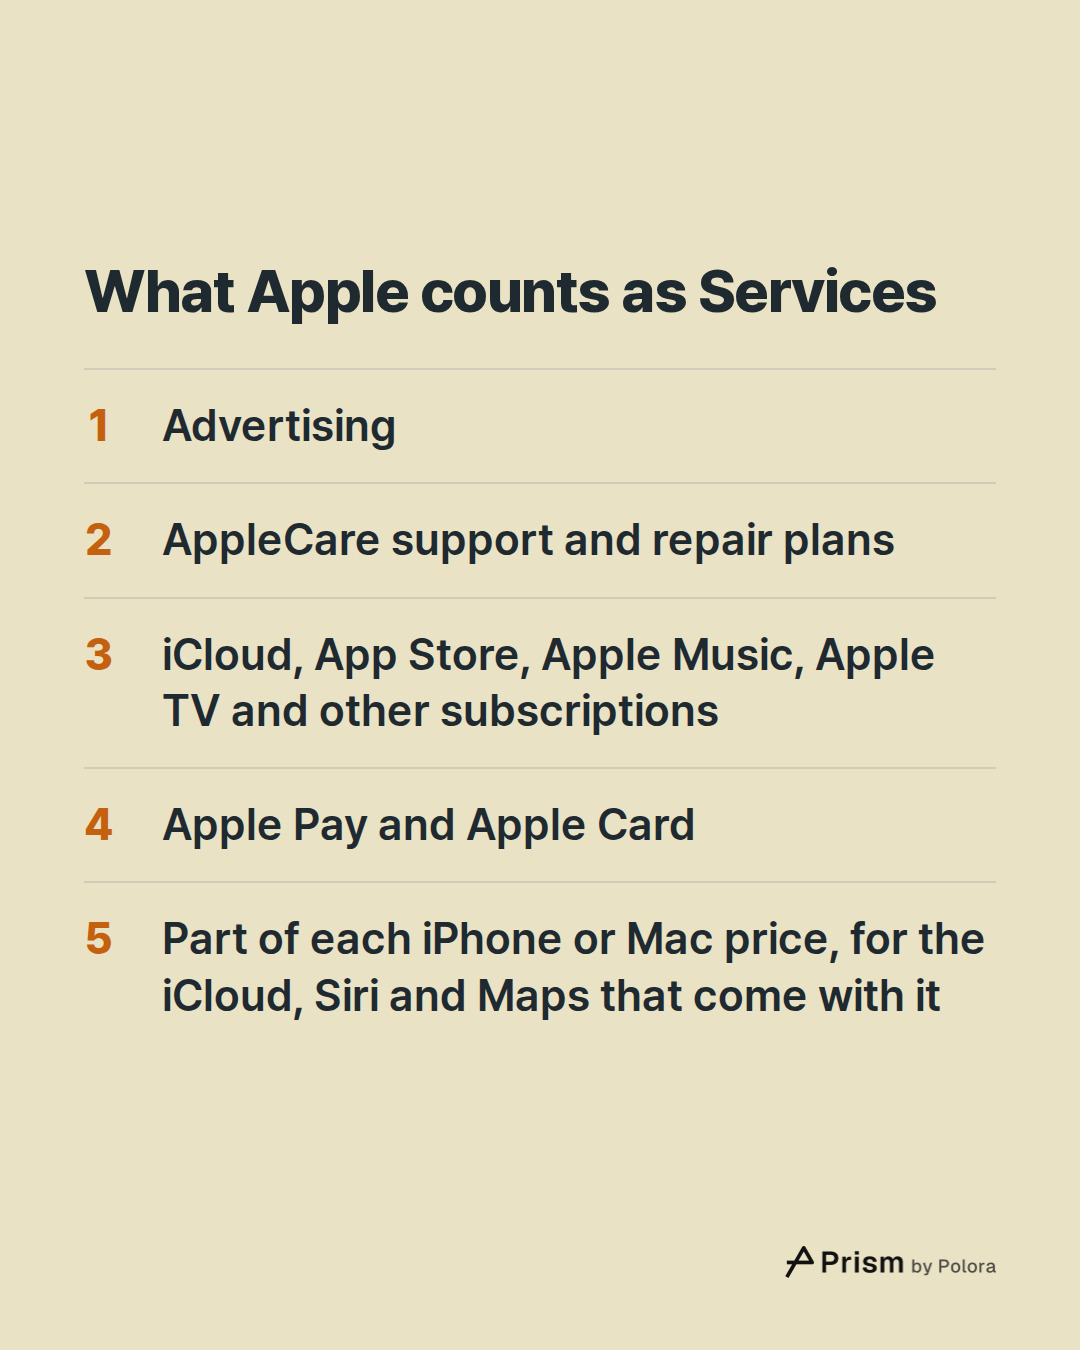
Apple splits its sales into two parts : products (iPhone, Mac, iPad, wearables and accessories) and Services. In its latest annual report, Services cover advertising, AppleCare support and repair plans, cloud services such as iCloud, digital content from the App Store, Apple Music, Apple TV and other subscriptions, and payment services such as Apple Pay and Apple Card.
The line between the two is Apple's own, and it is not a clean split between hardware and everything else. When someone buys an iPhone or a Mac, Apple books part of the price as Services sales over time, for the iCloud, Siri and Maps services that come with the device. Apple estimates that part, because these services have no price of their own that it can observe. Apple has counted these amounts as Services since the first quarter of its fiscal 2019, and in that quarter's report it restated the same quarter a year earlier on the same basis. Its later reports did the same for the rest of fiscal 2018, so the 2018 starting point here uses the same split. For apps from other developers sold through the App Store, Apple counts as Services sales only the commission it keeps, not what customers pay.
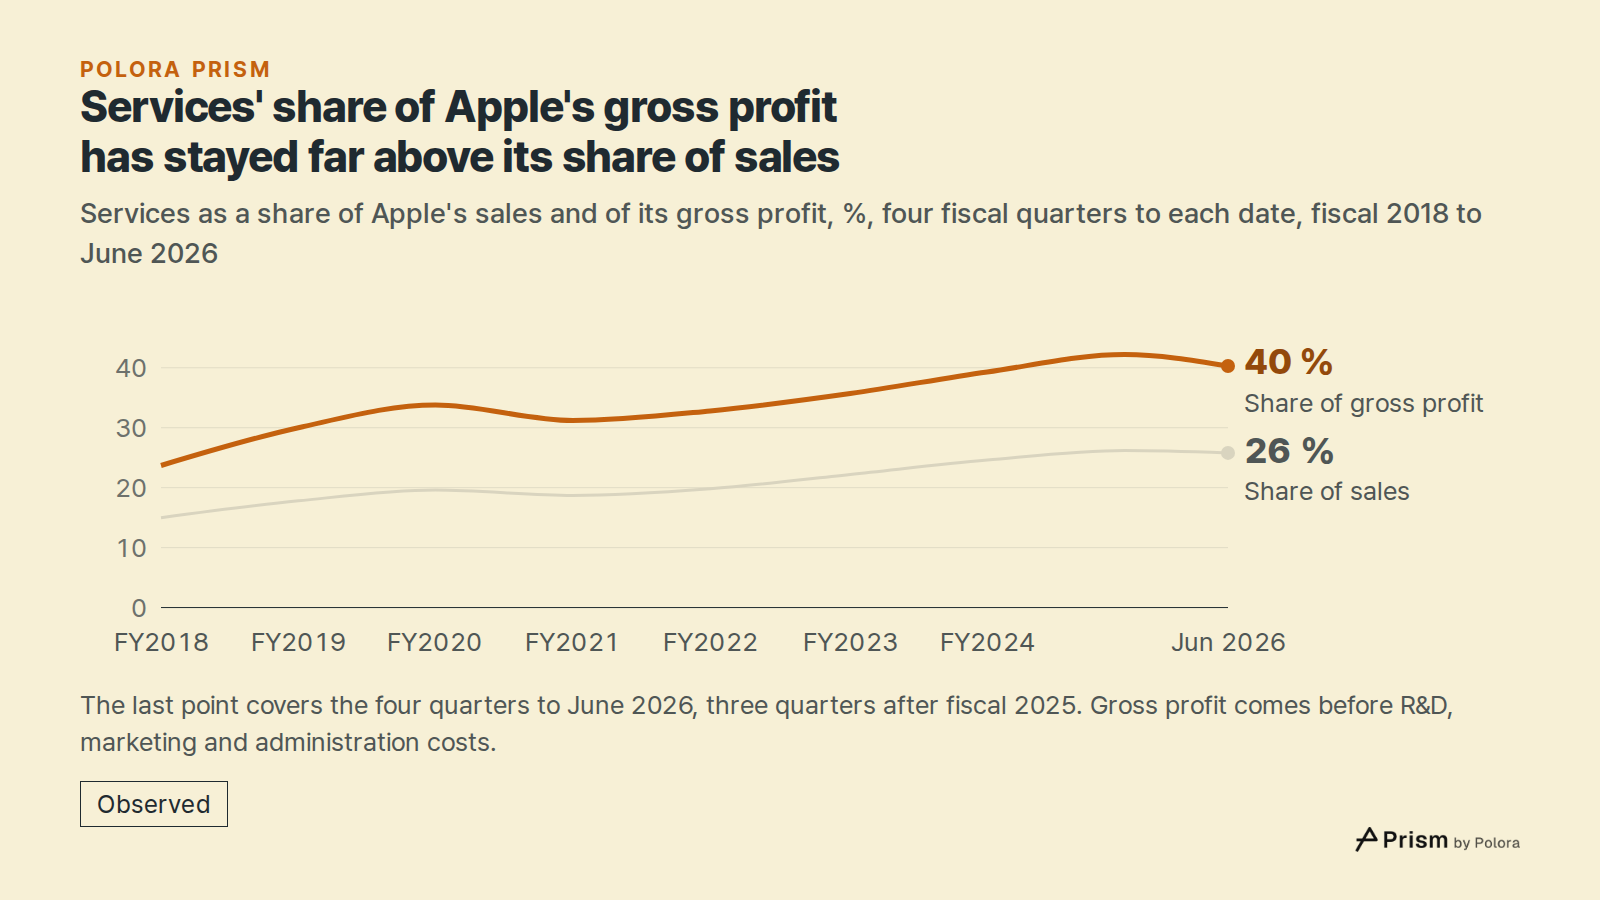
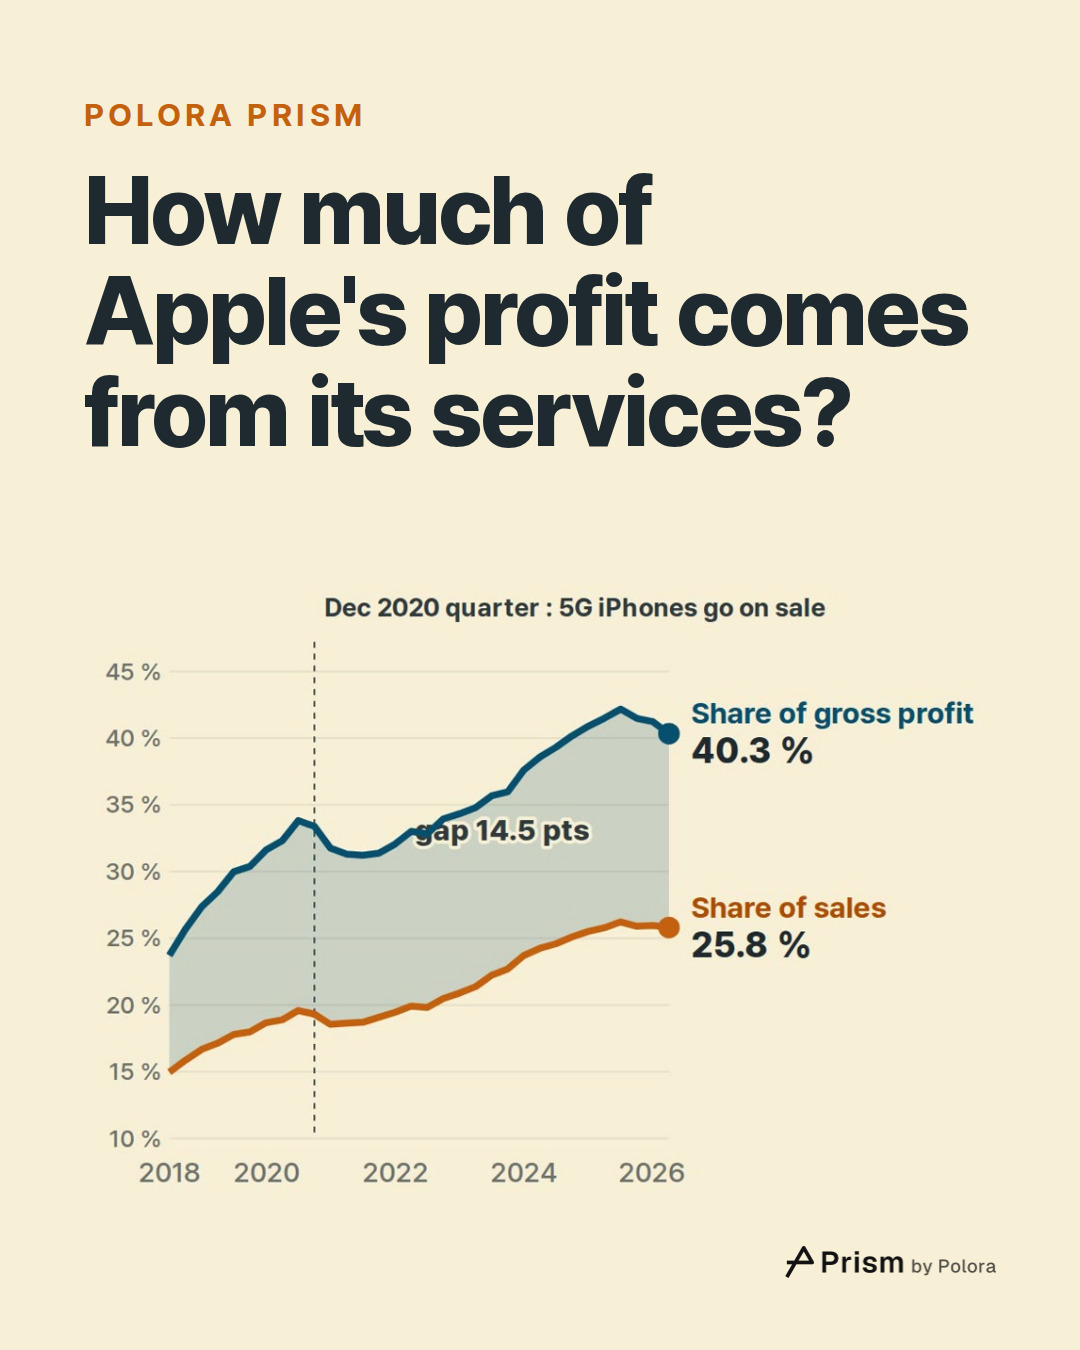
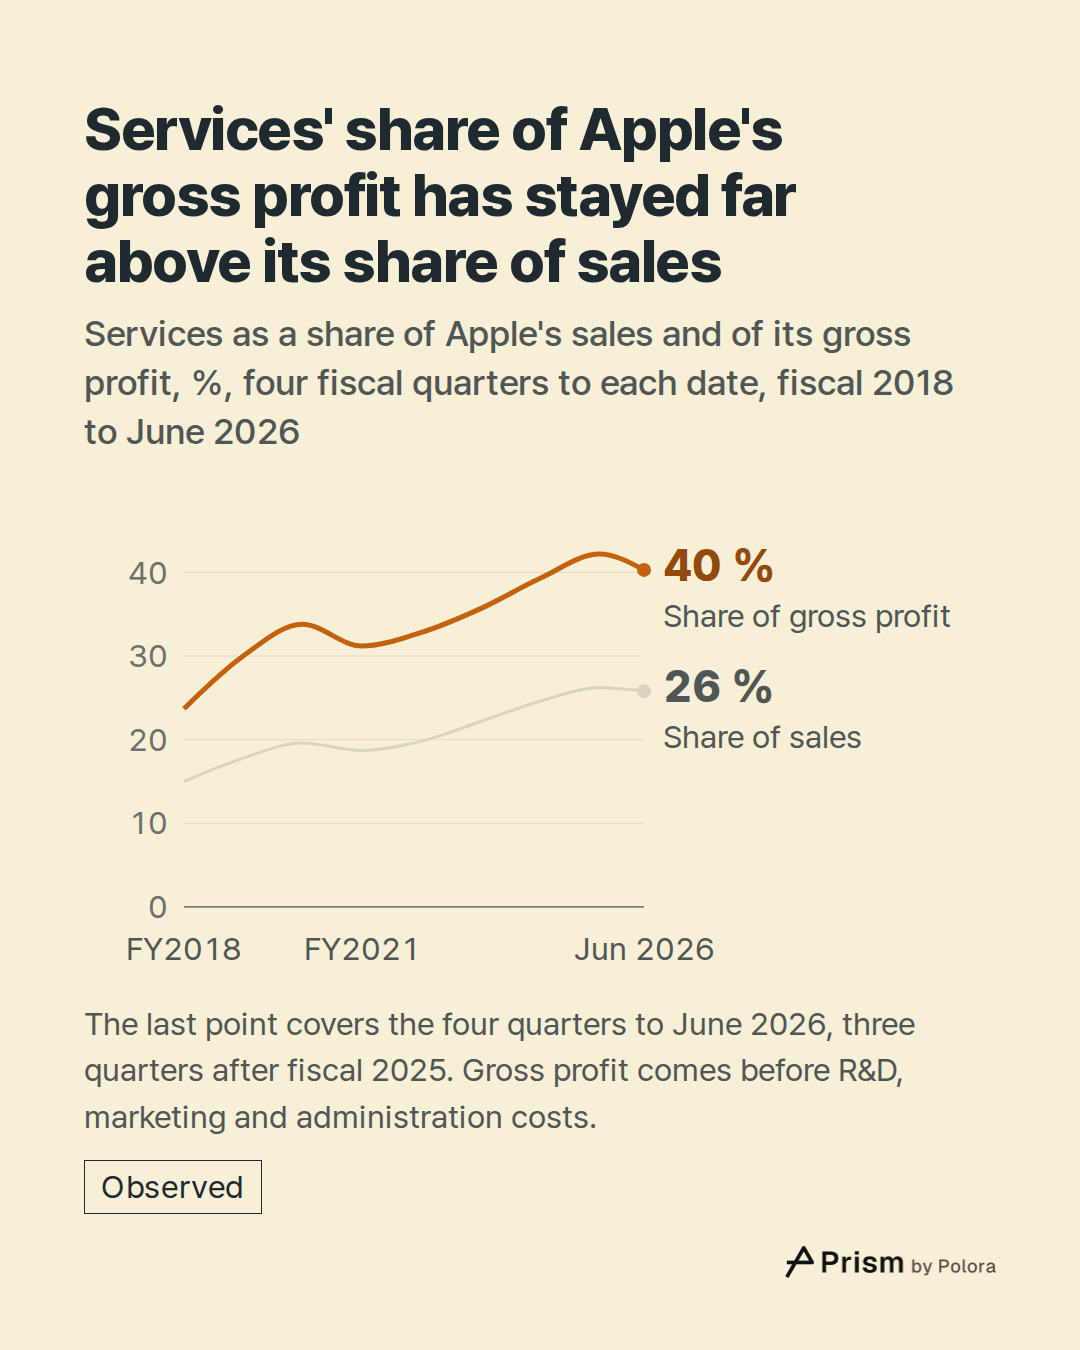
Services bring in a quarter of Apple's sales and two-fifths of its gross profit
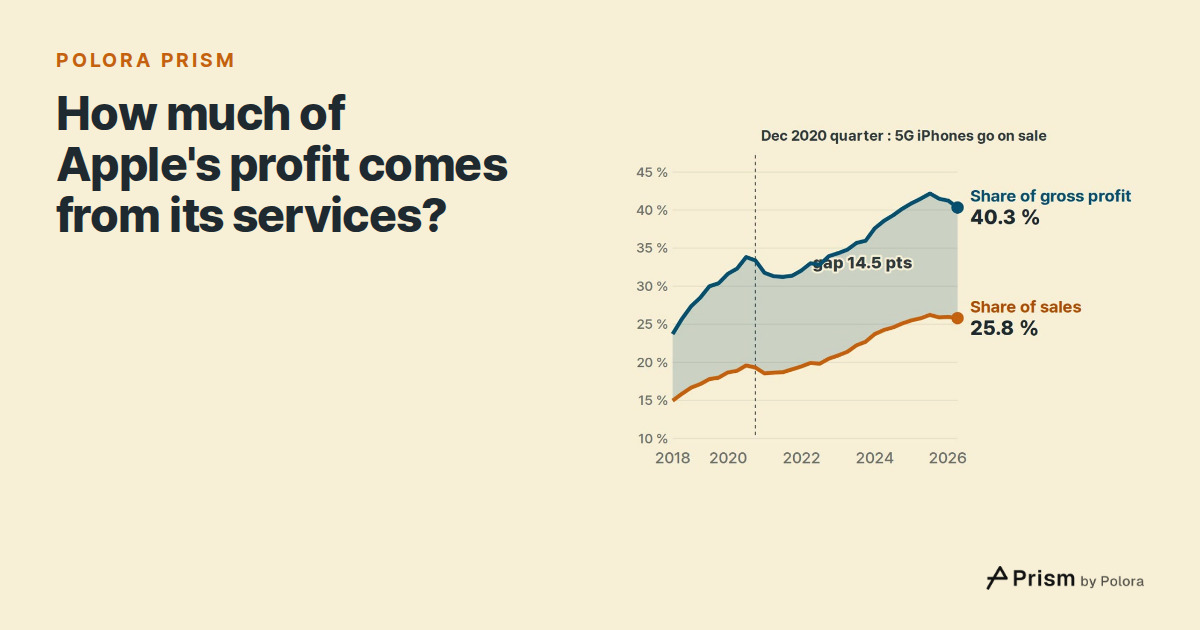
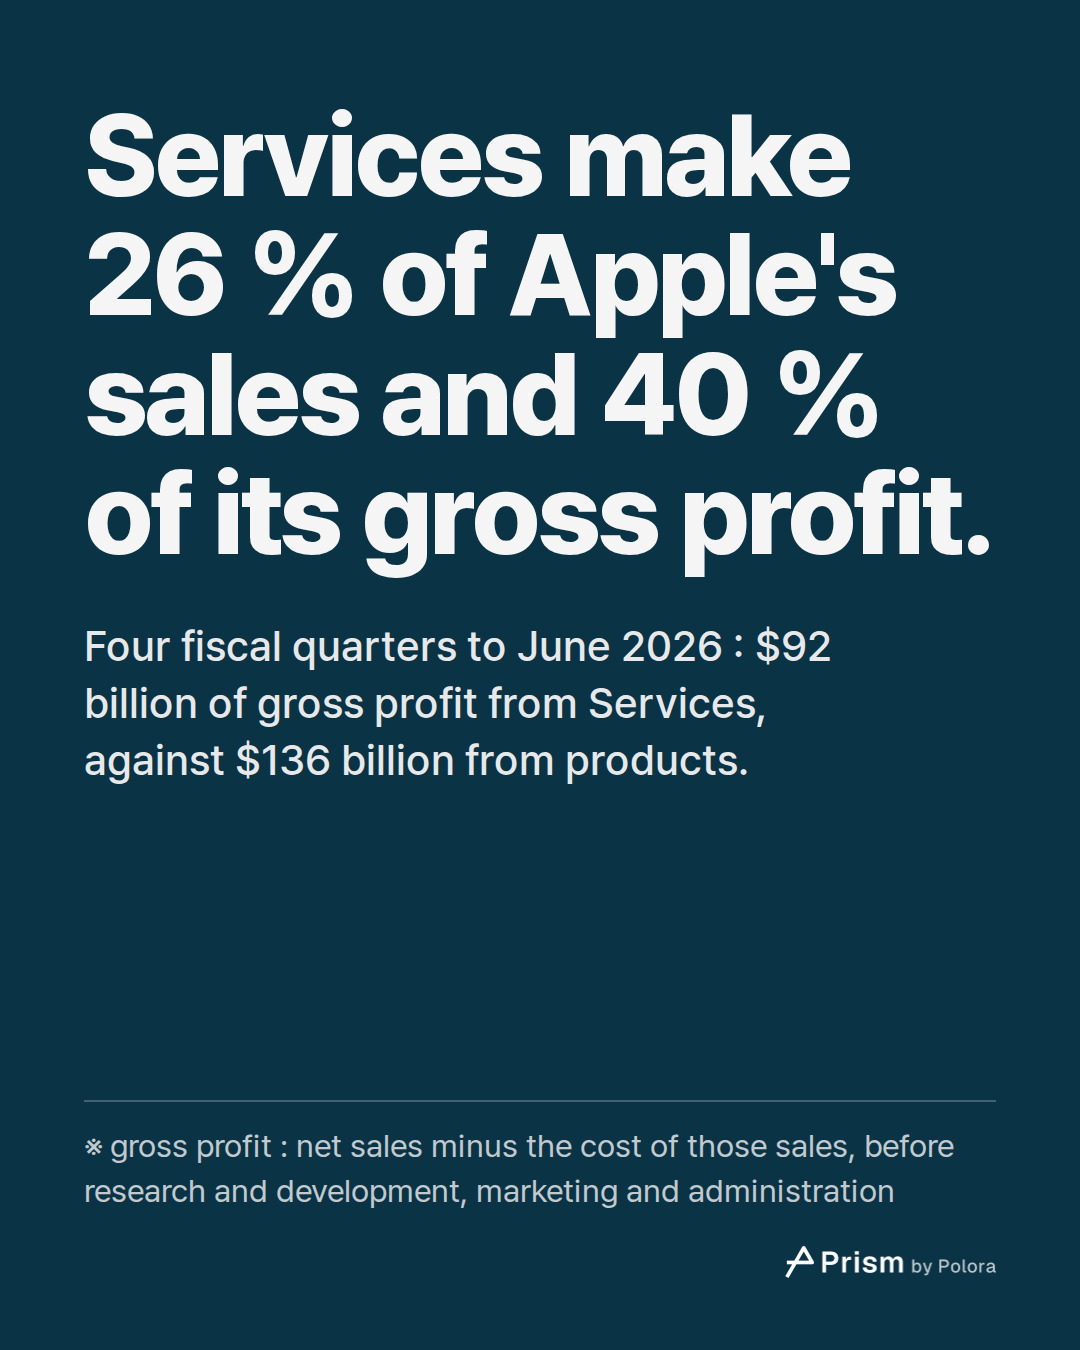
In the four fiscal quarters to June 2026, Services brought in $120 billion of sales, 26 % of Apple's total. After the cost of sales, Services left $92 billion of gross profit, against $136 billion from products. So Services made 40 % of Apple's gross profit.
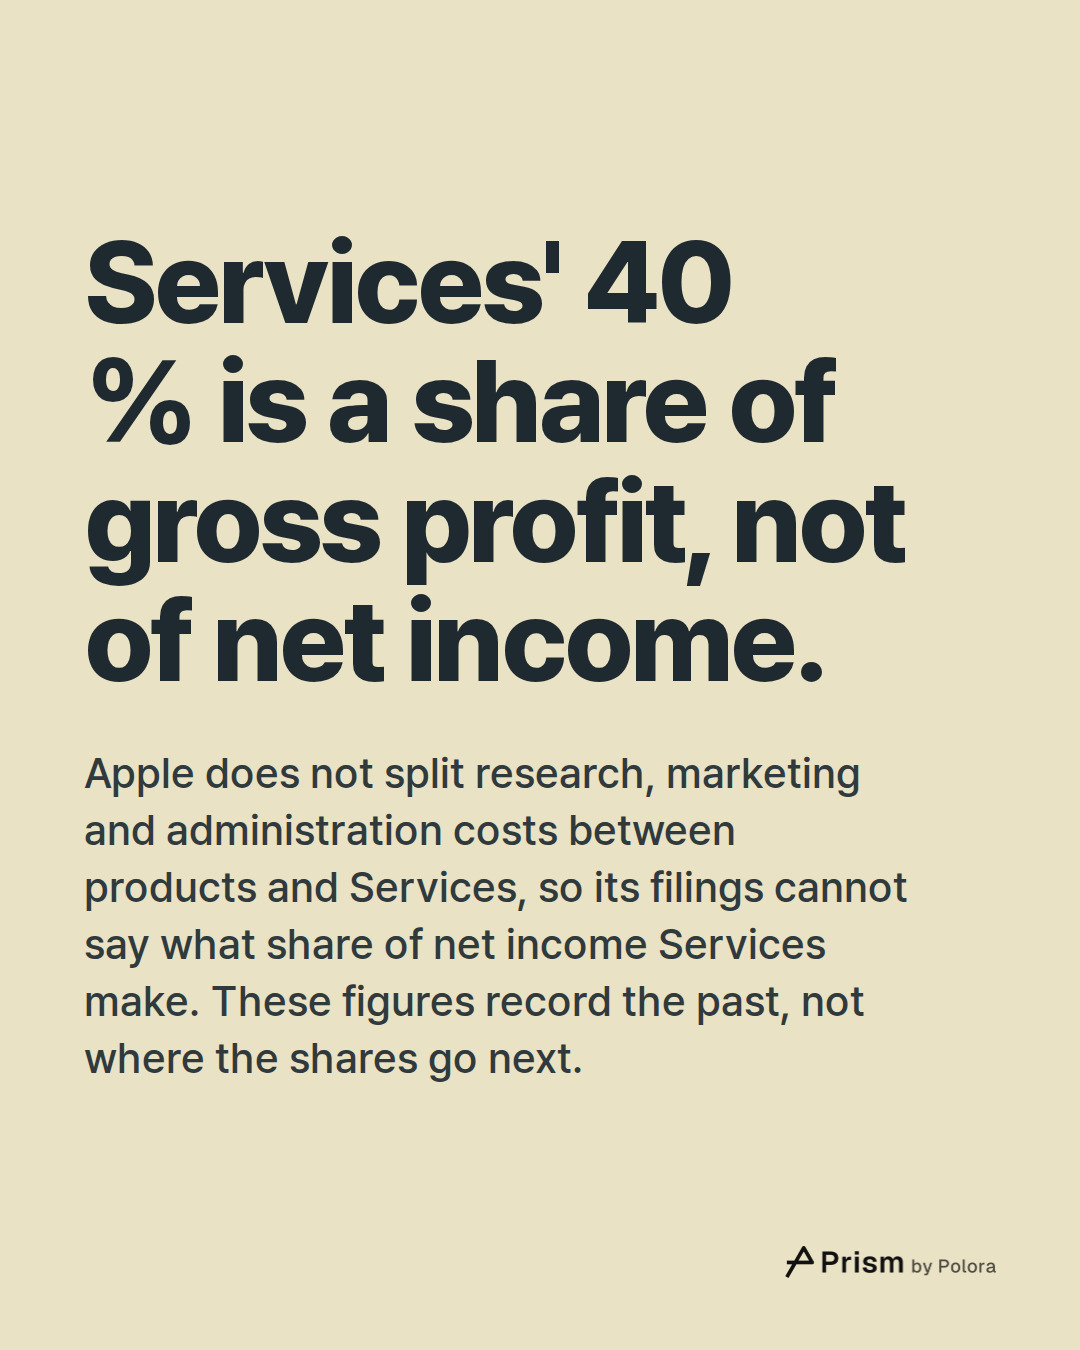
Gross profit here means net sales minus the cost of those sales (Apple calls it "gross margin"). It comes before research and development, marketing and administration. Apple does not split those costs between products and Services, so neither Apple's filings nor this piece can say what share of Apple's operating profit or net income Services make.
Why a quarter of Apple's sales becomes two-fifths of its profit
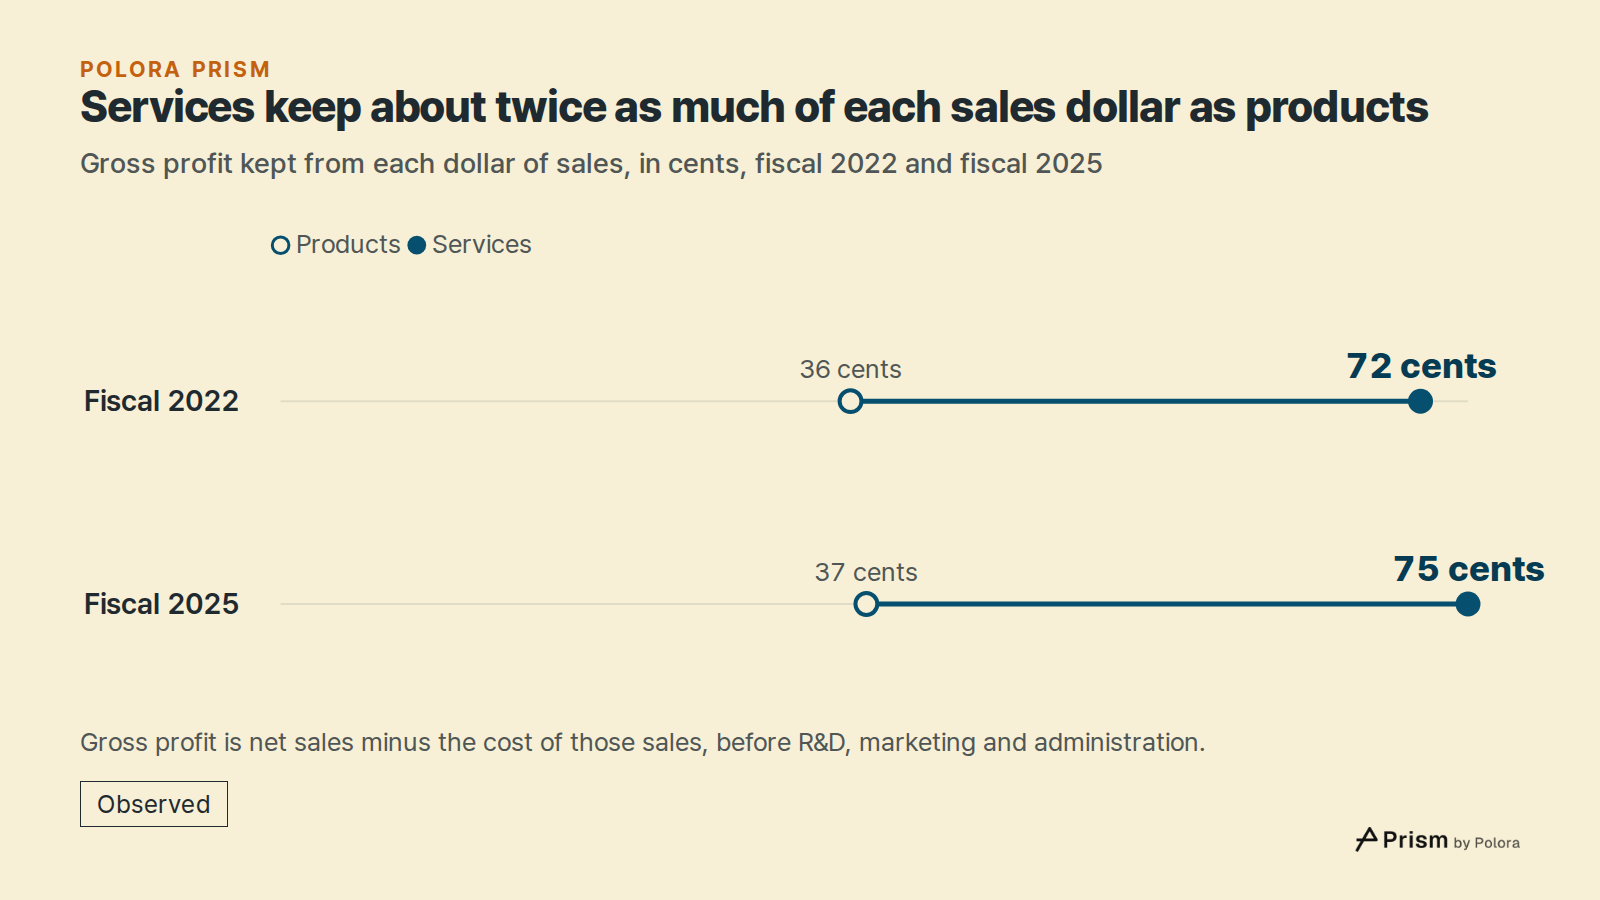
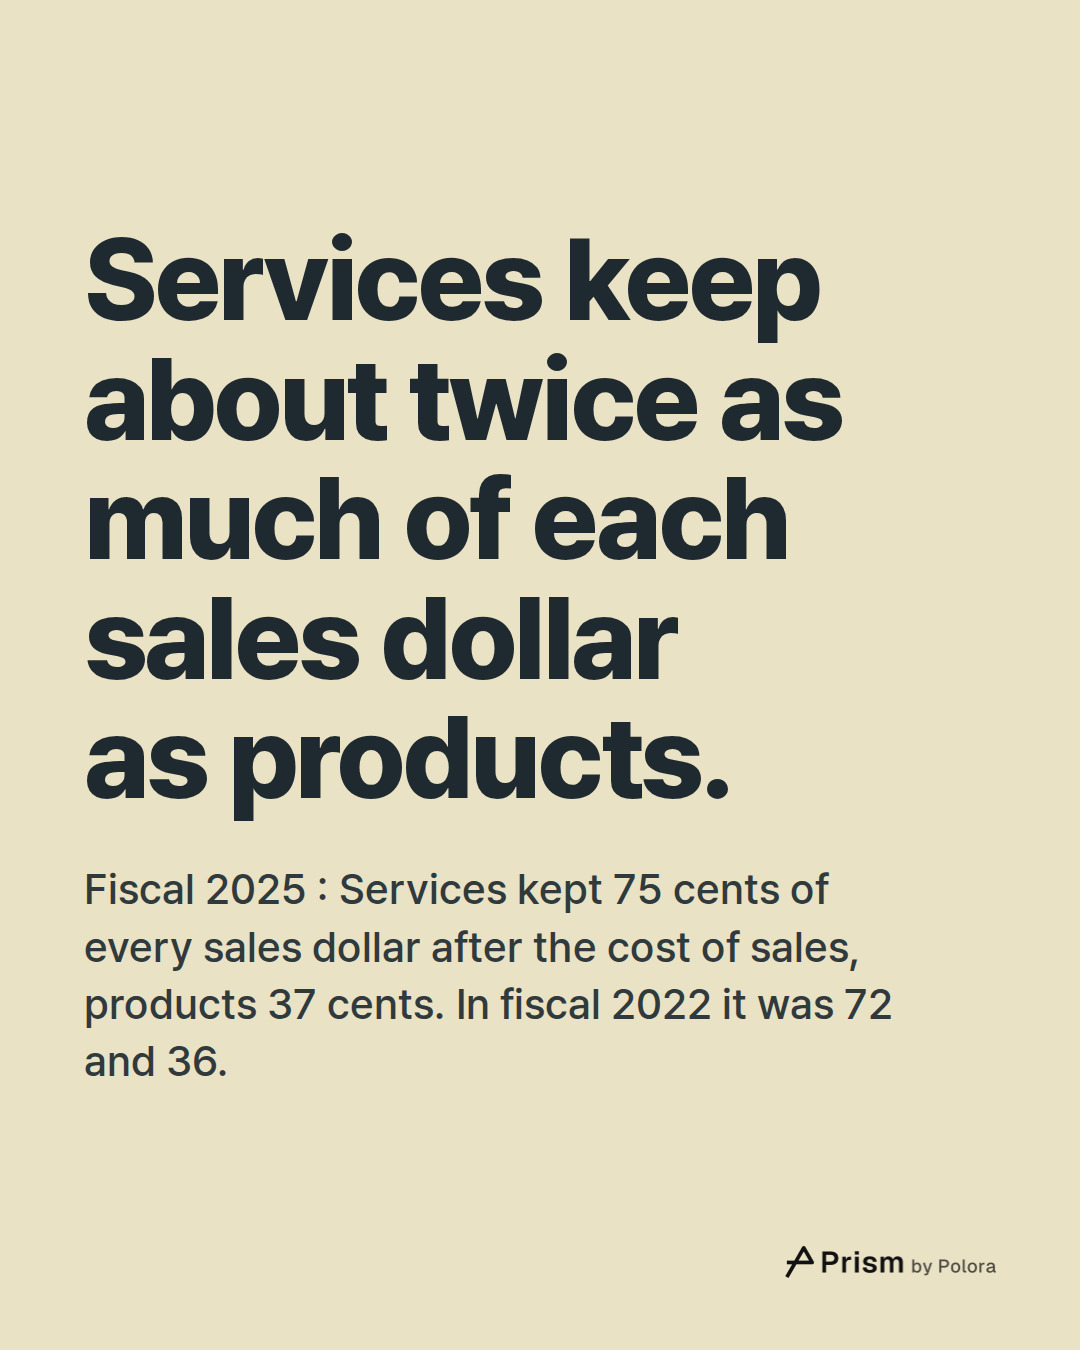
A dollar of Services sales leaves far more gross profit than a dollar of products. In fiscal 2022, Services kept 72 cents of every sales dollar after the cost of sales; products kept 36 cents. By fiscal 2025 Services kept 75 cents and products 37. With Services keeping about twice as much per dollar, a quarter of the sales becomes a much bigger share of the gross profit.
Services' share of gross profit went up at every fiscal year-end from 2021 to 2025, reaching 42 % in fiscal 2025. For fiscal 2025, Apple says Services gross margin, in dollars, rose mainly on higher Services sales and a different mix of services. It says the percentage Services keep rose mainly because of that different mix, partly offset by higher costs.
Services' profit share has slipped twice, and both times products' profit grew faster
Twice since 2018, Services' share of gross profit has fallen for several quarters in a row (it also dipped slightly in late 2022). Both times Services gross profit kept growing; products gross profit grew faster.
The first time was fiscal 2021. Products sales jumped 35 %. Apple's annual report says iPhone sales rose mainly because of new iPhone models launched in the first and fourth quarters of that fiscal year, and a favourable mix of iPhone sales. Products also became more profitable per dollar : the share of products sales kept as gross profit rose from 31.5 % in fiscal 2020 to 35.3 % in fiscal 2021. Apple puts that down mainly to a different mix of products, what it calls improved leverage, and stronger foreign currencies against the dollar. Products gross profit grew 51.3 %, Services gross profit 34.4 %. So Services' share of gross profit fell from 34 % in fiscal 2020 to 31 % in fiscal 2021.
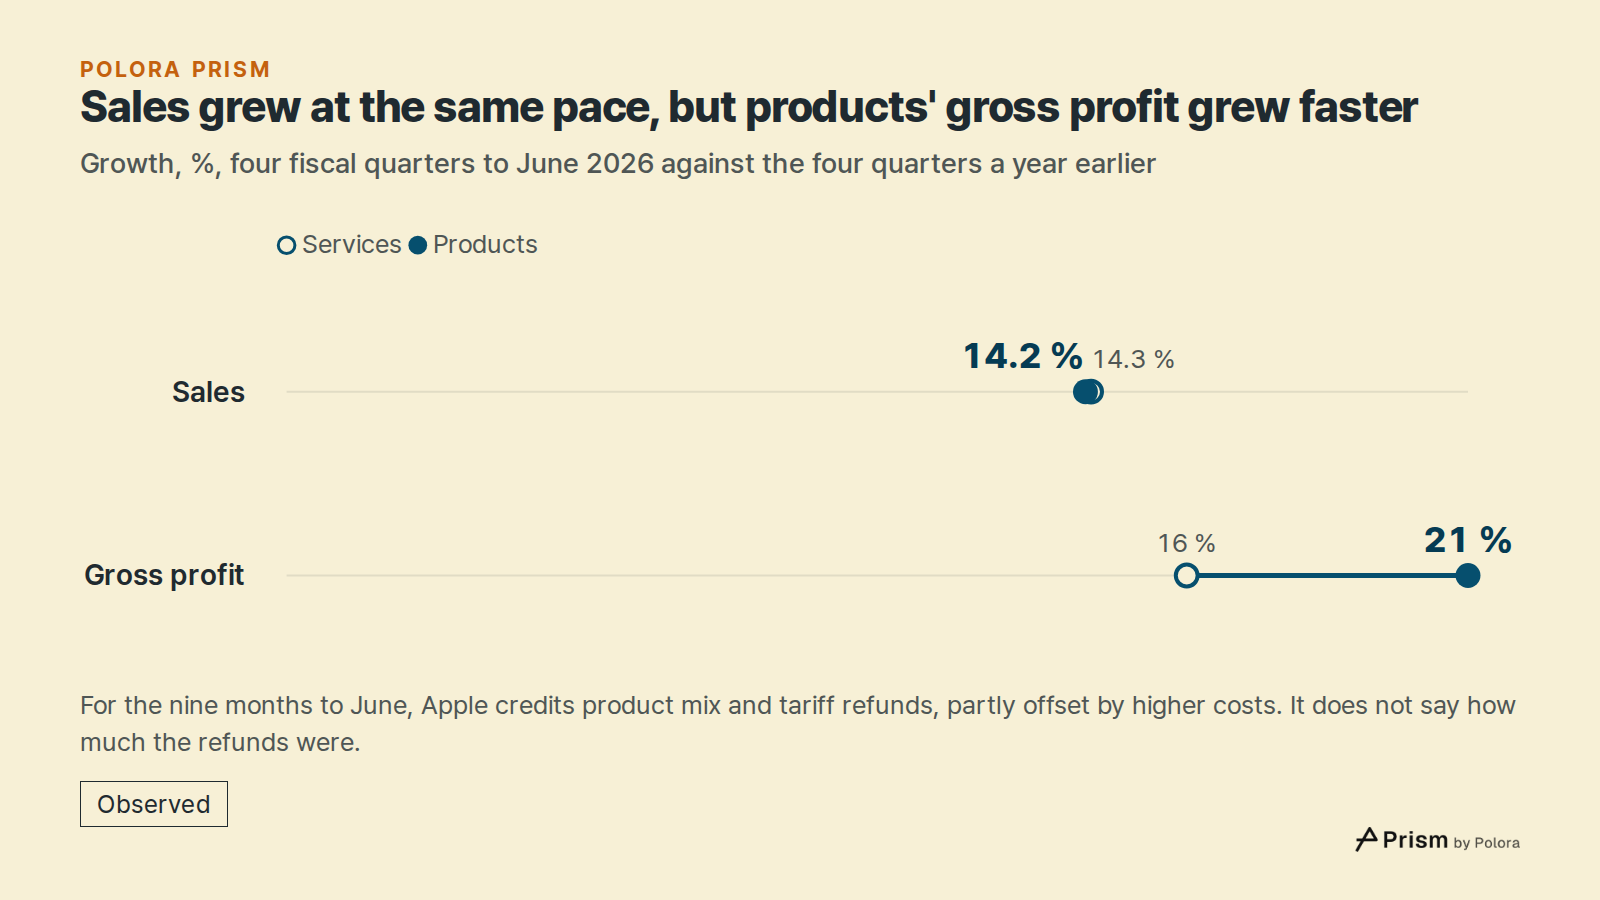
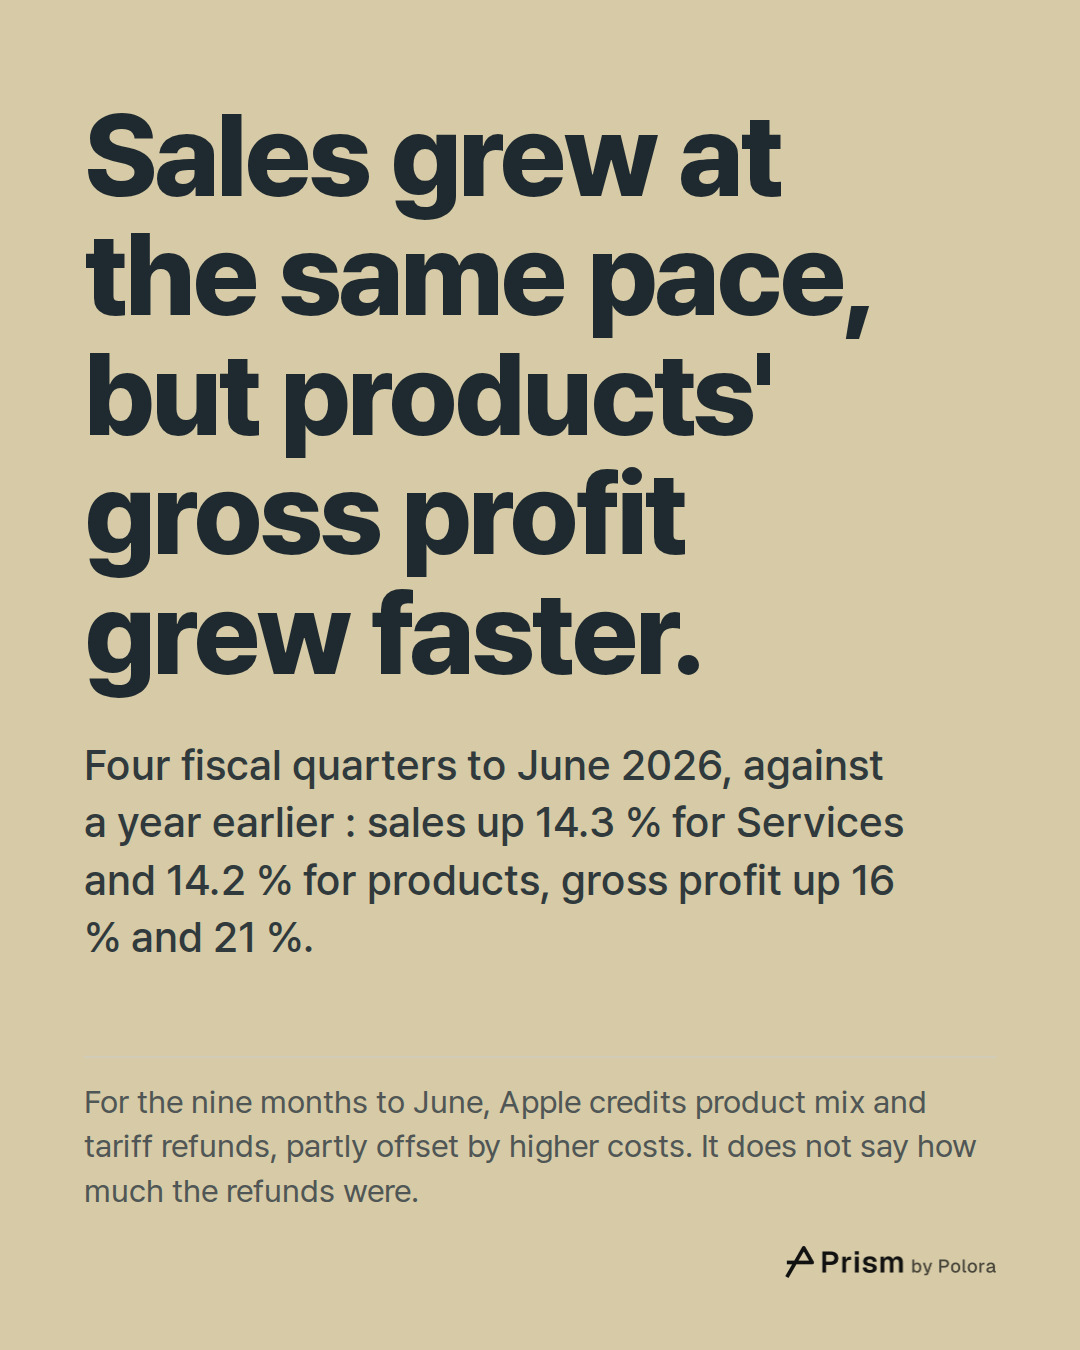
The second time is now. Compare the four quarters to June 2026 with the four quarters a year earlier : Services sales grew 14.3 % and products sales 14.2 %, almost the same pace. But products kept 39 cents of each sales dollar as gross profit, against 37 cents in fiscal 2025. Products gross profit grew 21 % and Services gross profit 16 %. Services' share of gross profit slipped from 42 % in fiscal 2025 to 40 % in the four quarters to June. In dollars, Services gross profit kept rising, from $82 billion in fiscal 2025 to $92 billion in the four quarters to June.
Apple's quarterly report gives its reasons for the first nine months of fiscal 2026. Products gross margin rose "primarily due to a different mix of products and tariff refunds, partially offset by higher costs, including memory." In February 2026, the US Supreme Court struck down certain tariffs imposed under the International Emergency Economic Powers Act. Apple says it applied for refunds of tariffs it had paid and books any refunds it receives as a reduction in products cost of sales. Apple does not say how much the refunds were, so this piece cannot separate them from the effect of the product mix.
What these figures do and don't show
Apple's fiscal year ends on the last Saturday of September. Every five or six years Apple adds a week to its first fiscal quarter to keep its quarters in step with the calendar; fiscal 2023 was such a year, so any four quarters that include that quarter run a week longer than usual. Both parts of each share come from the same weeks, so Services and products are still compared like for like, though a longer period can move the shares a little if that extra week's mix was unusual. The dollar totals for those periods include the extra week.
When the data for this piece was gathered, in late October 2026, Apple's latest quarterly report covered the quarter to June. Its results for the quarter to September will give a newer four-quarter figure. The pattern described here is a record of the past and does not say where the shares go next.
How the numbers were made
For each fiscal quarter from late 2017 to June 2026, we took products and Services net sales and cost of sales from Apple's quarterly and annual filings with the US Securities and Exchange Commission. An annual report gives the full year, not its last quarter, so each fourth quarter is the year minus its first nine months. Each figure is the sum of four consecutive quarters. We checked every quarterly input against the income statements in Apple's earnings releases, which print the fourth quarters directly, and all of them match. The margins Apple prints in its annual reports agree with ours : 75.4 % for Services and 36.8 % for products in fiscal 2025, and the fiscal 2020 and 2021 products figures above. Apple prints 39.9 % as the products margin for the first nine months of fiscal 2026, as do our figures for those nine months; the 39 cents above covers four quarters, a different period.
- Apple Inc., Form 10-K for fiscal 2025 (SEC EDGAR)]
- Apple Inc., Form 10-K for fiscal 2021 (SEC EDGAR)]
- Apple Inc., Form 10-Q for the quarter to June 2026 (SEC EDGAR)]
- Apple Inc., Form 10-Q for the quarter to December 2018 (SEC EDGAR)]
- Apple Inc., quarterly and annual filings, 2017 to 2026 (SEC EDGAR)]
- Apple Inc., earnings releases, January 2019 to July 2026 (latest shown, SEC EDGAR)]
![Sources 6 : sec.gov · Apple Inc., Form 10-K for fiscal 2025 (SEC EDGAR)], sec.gov · Apple Inc., Form 10-K for fiscal 2021 (SEC EDGAR)], sec.gov · Apple Inc., Form 10-Q for the quarter to June 2026 (SEC EDGAR)] + 3](https://media.cdn.polora.ai/picks/2026/10/pickrun_98eccc9ceb804732/mmEogsq9cER_Mzc0-slide-08--how-much-of-apple.jpg)