The price on the menu, and in today's money
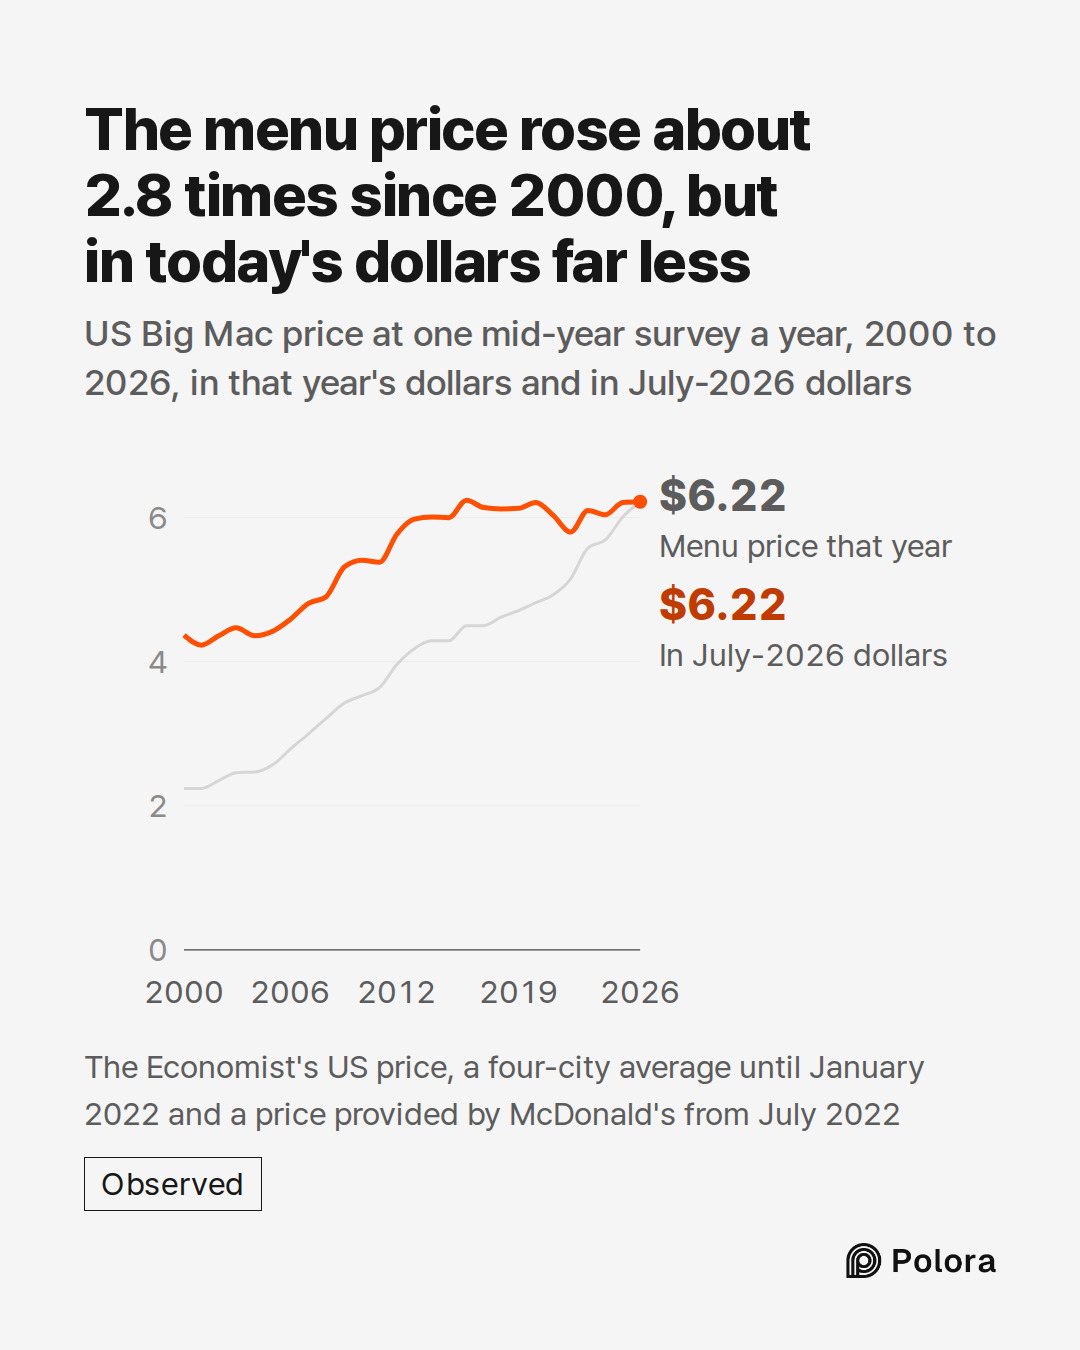
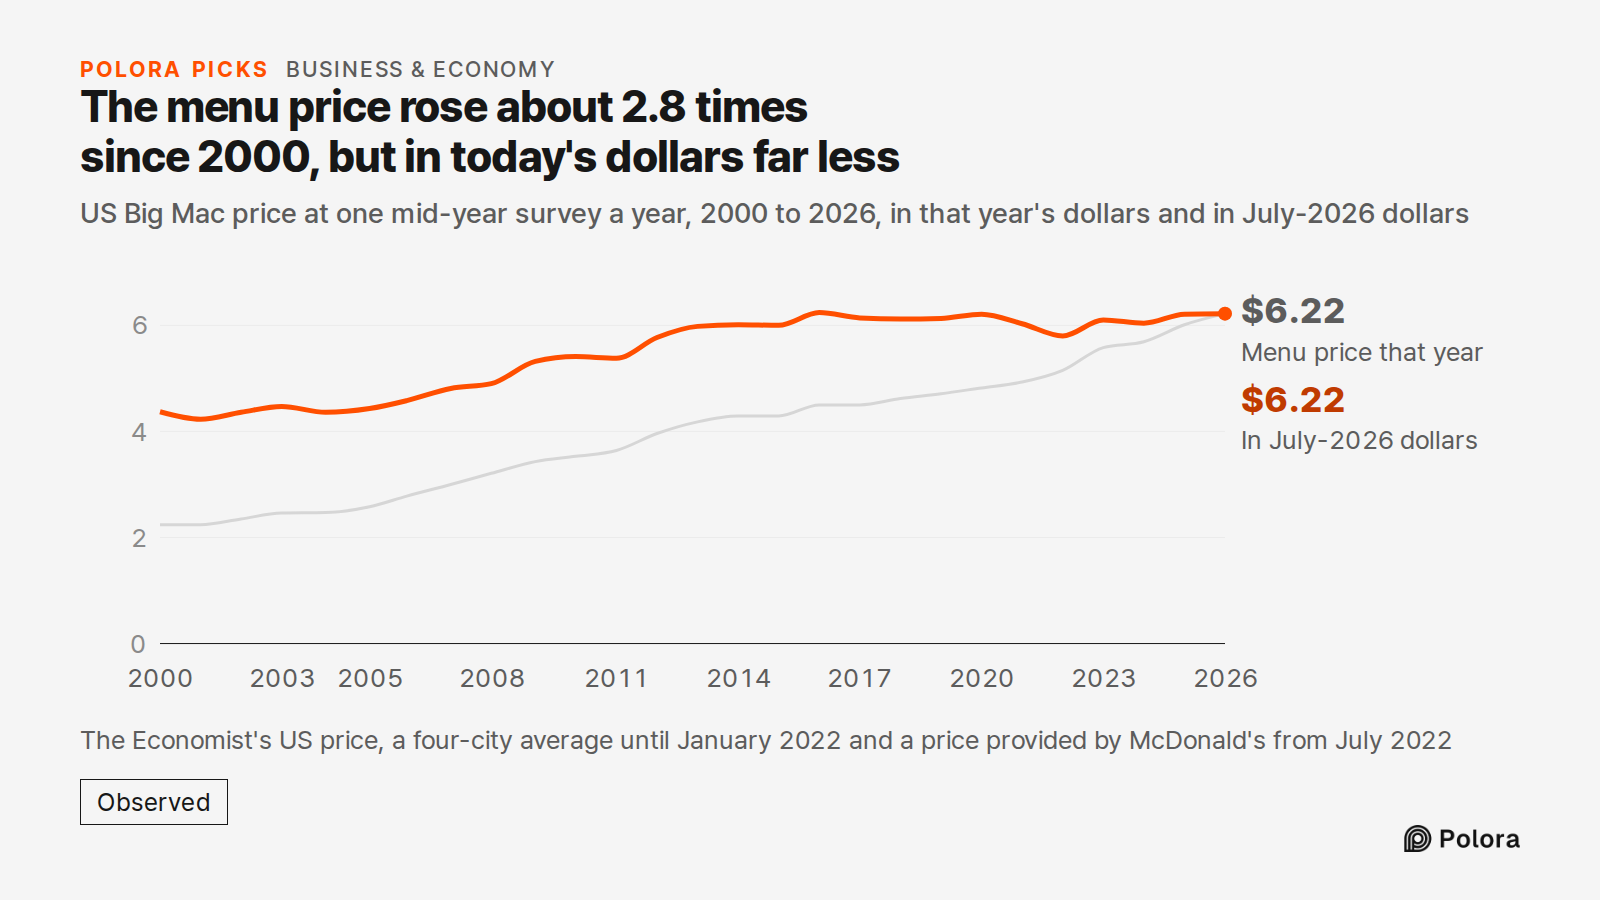
The Economist's Big Mac index data give the price of a Big Mac in the United States at each survey from April 2000 on. Over that time the menu price went from $2.24 to $6.22, about 2.8 times as much. Consumer prices as a whole, measured by the government's Consumer Price Index (CPI), rose about 1.95 times between April 2000 and July 2026. So the burger did get more expensive in real terms, but the menu price alone overstates how much.
To compare years fairly, each survey price can be restated in July-2026 dollars : multiply it by the CPI of July 2026 and divide by the CPI of the month it was surveyed. In those terms, the $2.24 Big Mac of 2000 cost $4.37. Seen this way, the 26 years fall into three stretches.
2005 to 2014 : when the Big Mac really got pricier
From 2000 to 2005 almost nothing happened after inflation : $4.37 in 2000, $4.43 in 2005, a real rise of 1.4%.
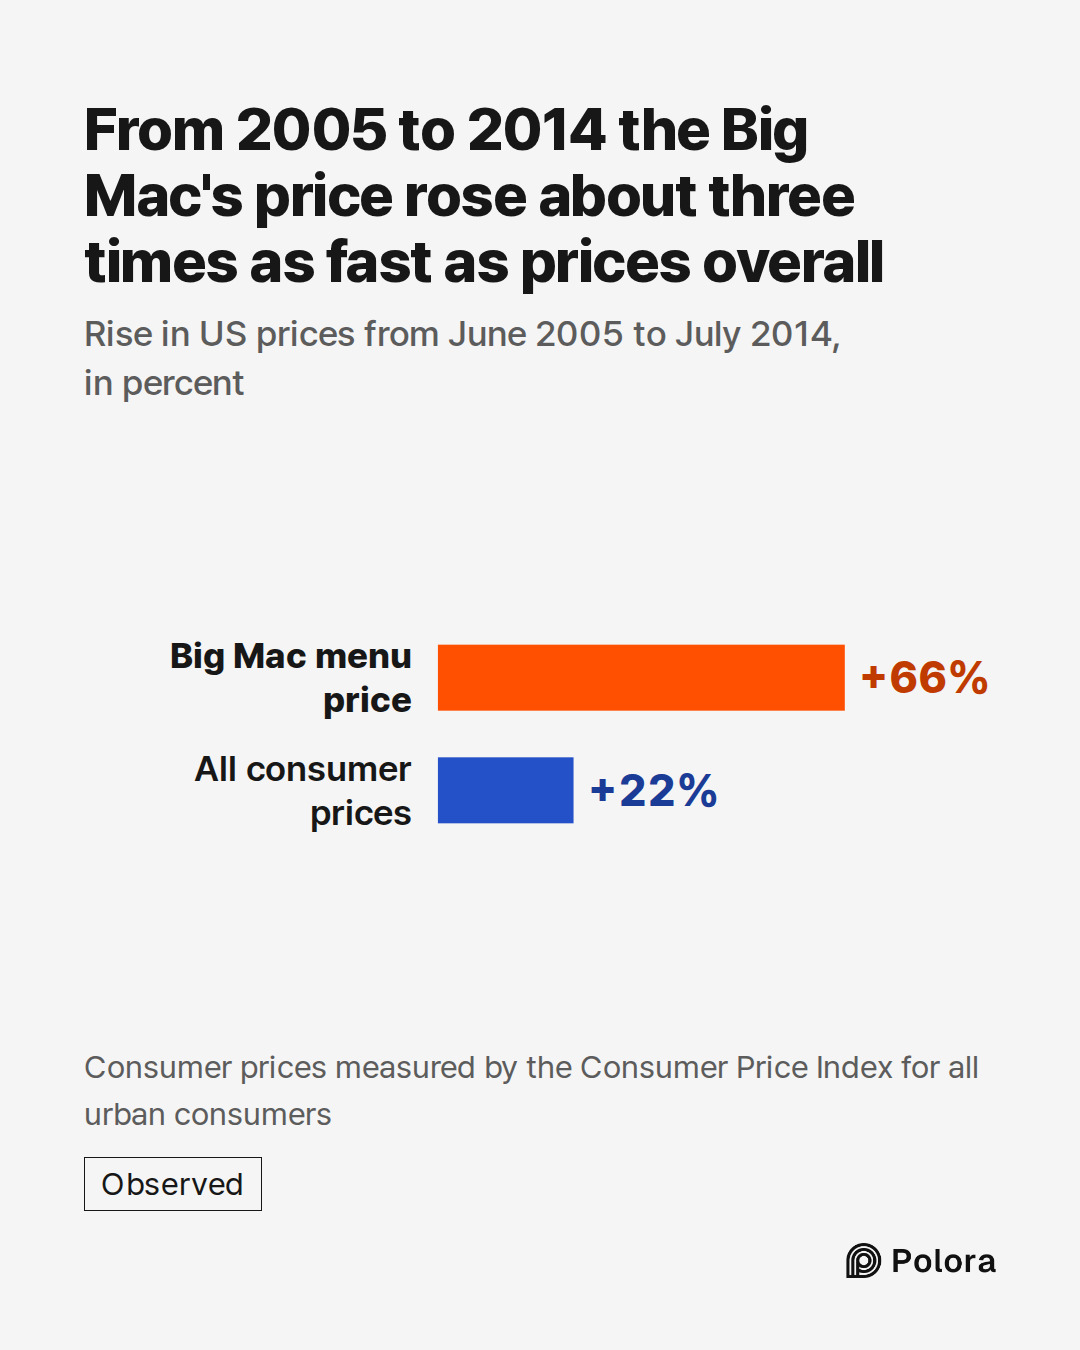
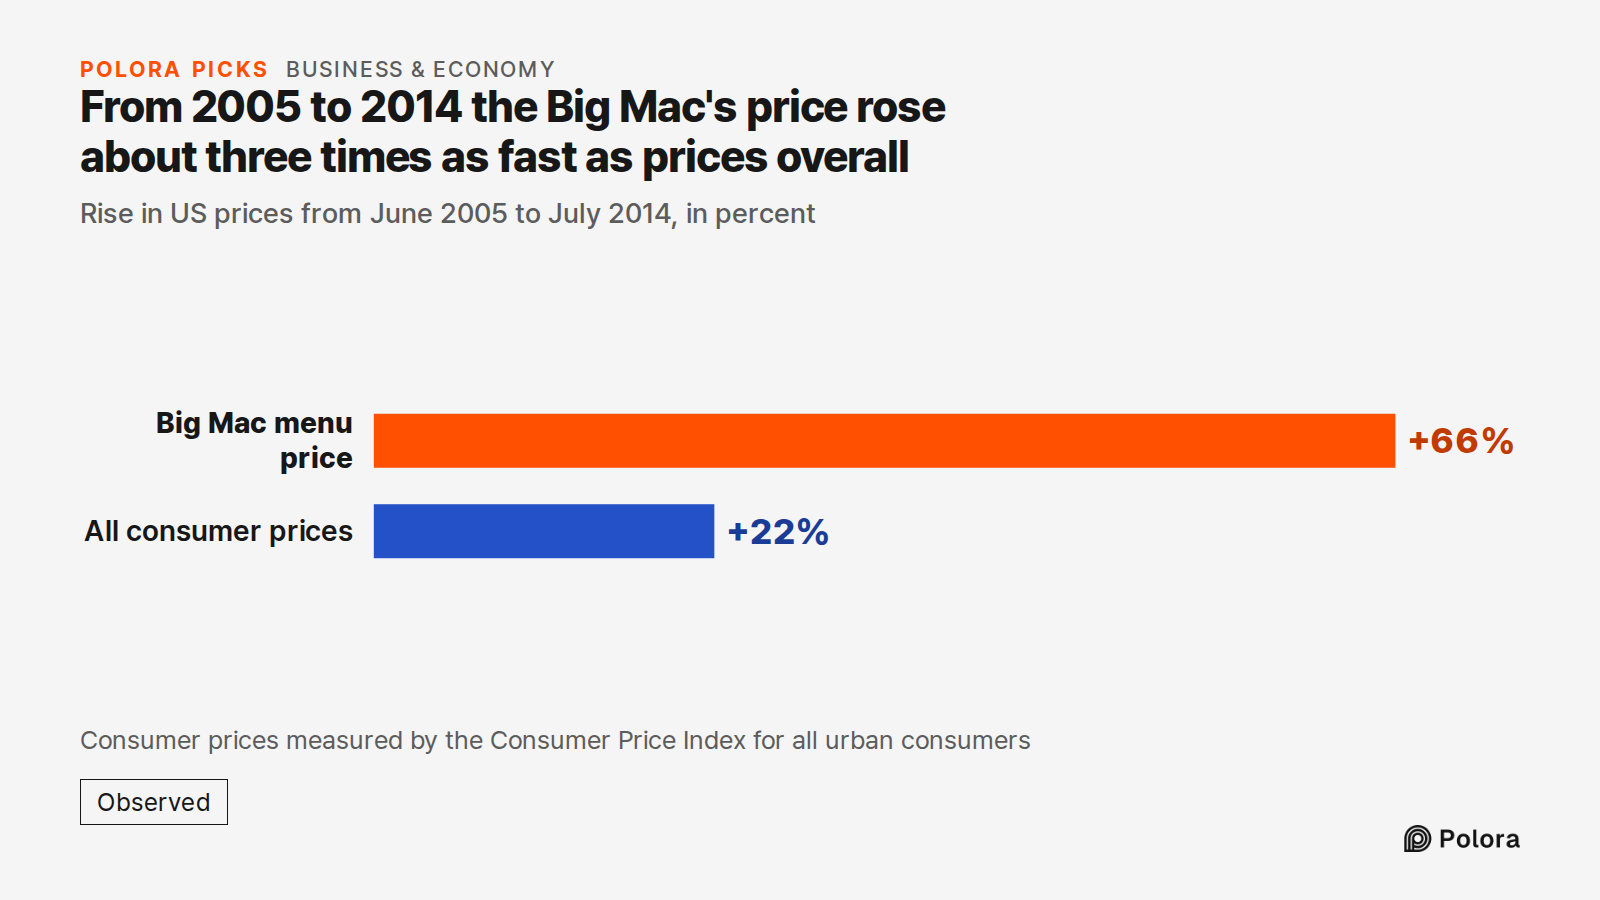
Then the price took off. Between June 2005 and July 2014 the menu price rose 66%, from $2.58 to $4.29, while consumer prices overall rose 22%. The Big Mac's increase was about three times the rise in prices generally. In July-2026 dollars it went from $4.43 to $6.01, a real increase of 36%. That is where most of the burger's real price gain over the whole period sits.
2014 to 2026 : flat, once inflation is counted
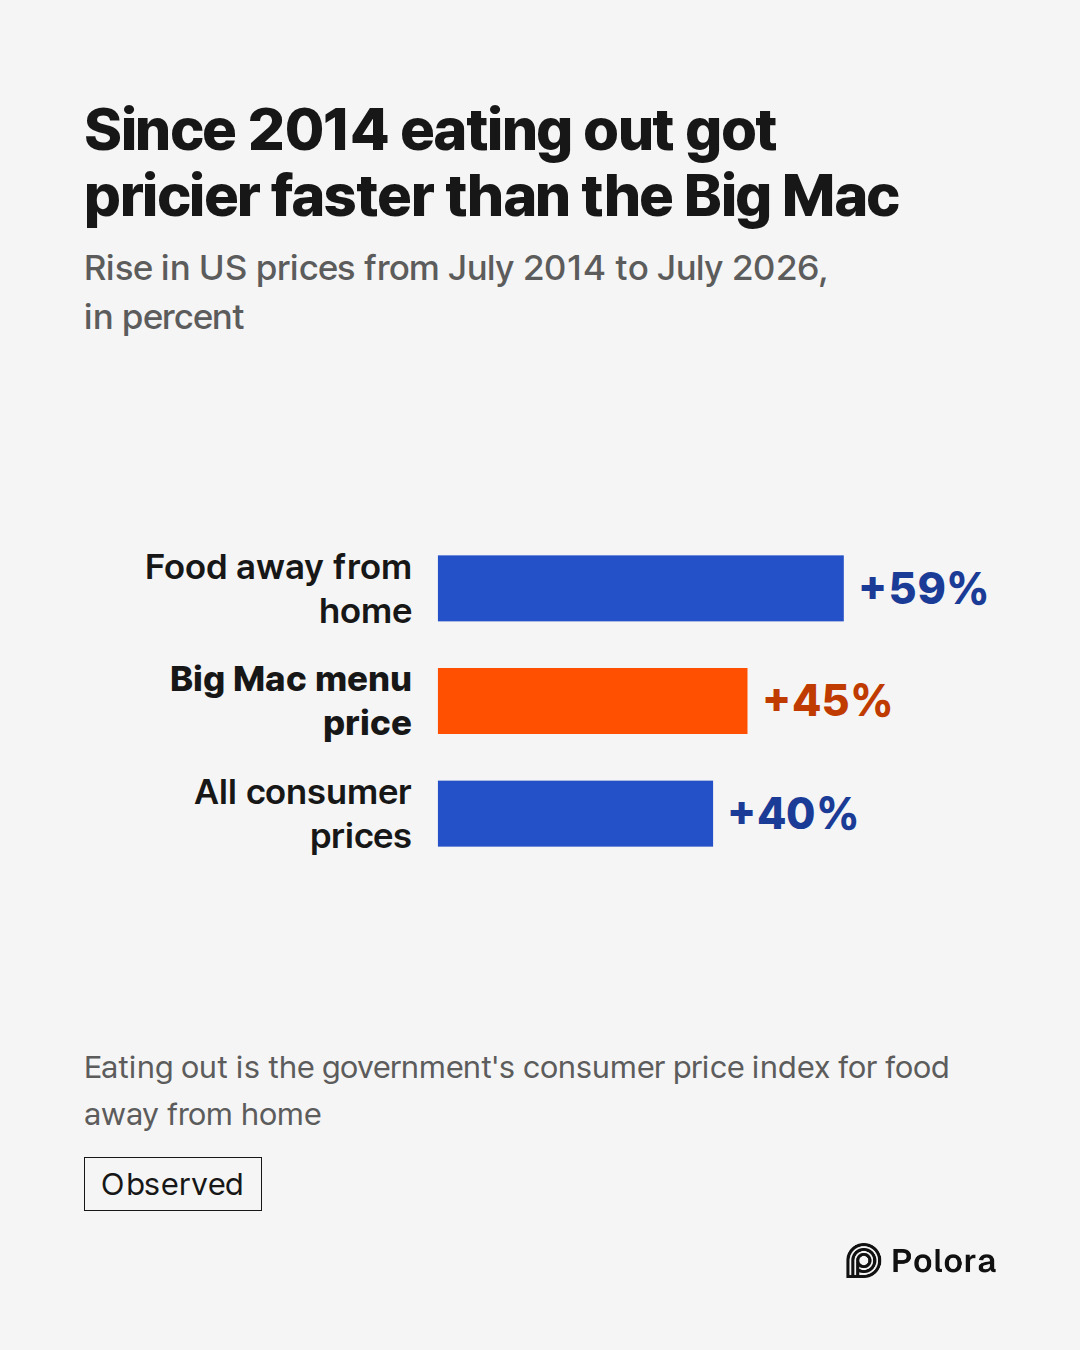
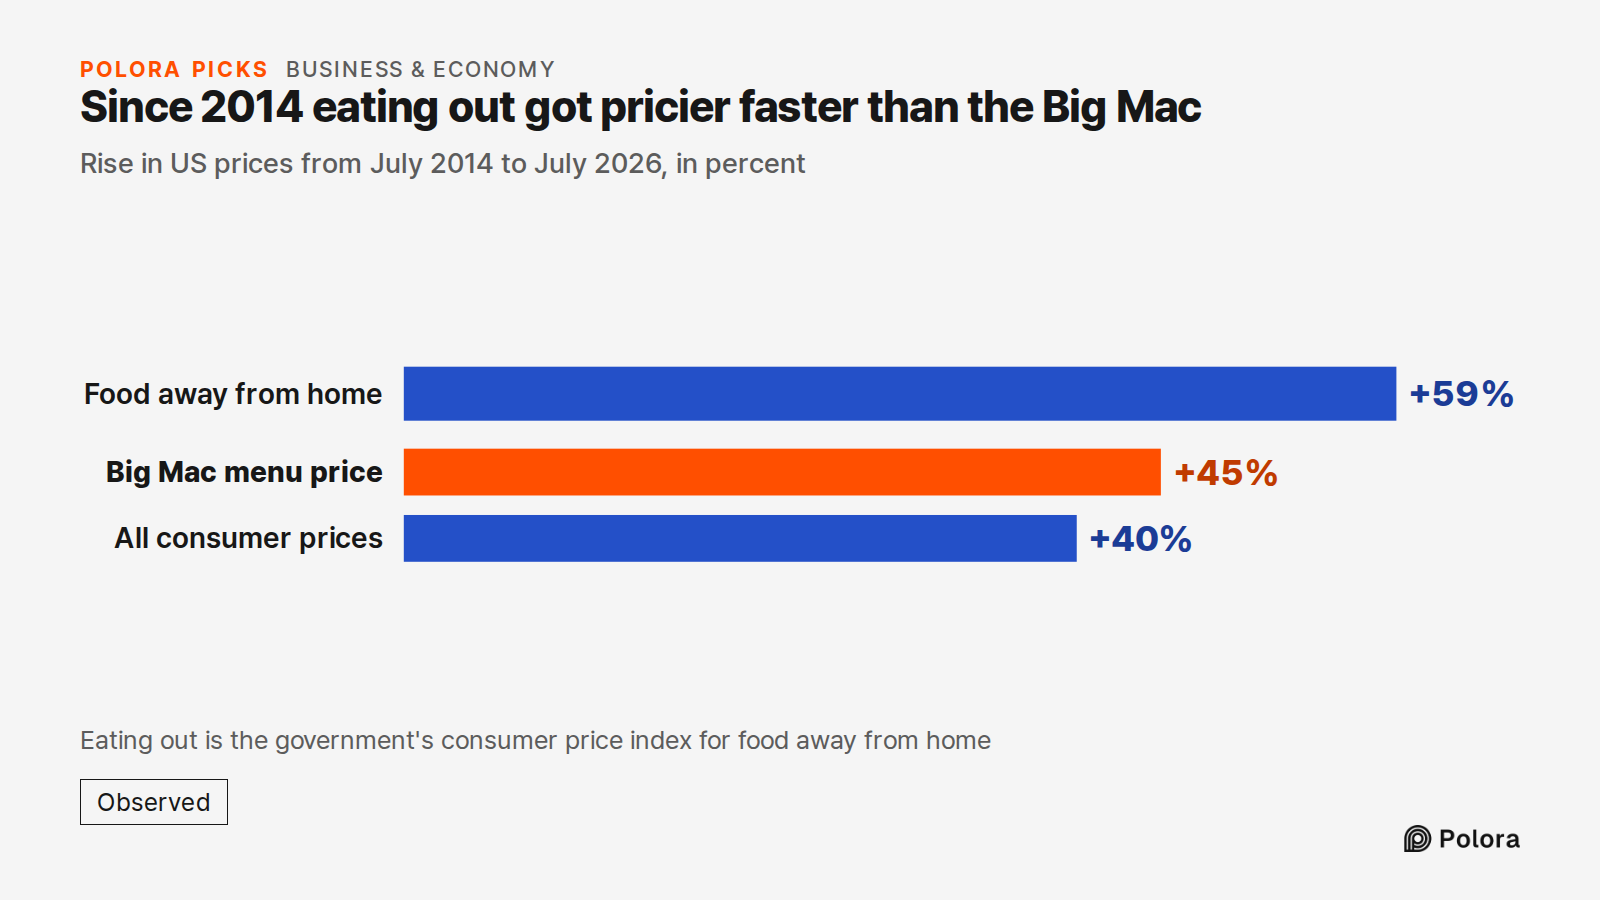
After 2014 the picture changes. The menu price kept climbing, by 45% between July 2014 and July 2026, but consumer prices rose 40% in the same years, so the gap between the two was small. For a while the recorded menu price did not move at all : The Economist found the same $4.29 at four surveys in a row, from July 2014 to January 2016.
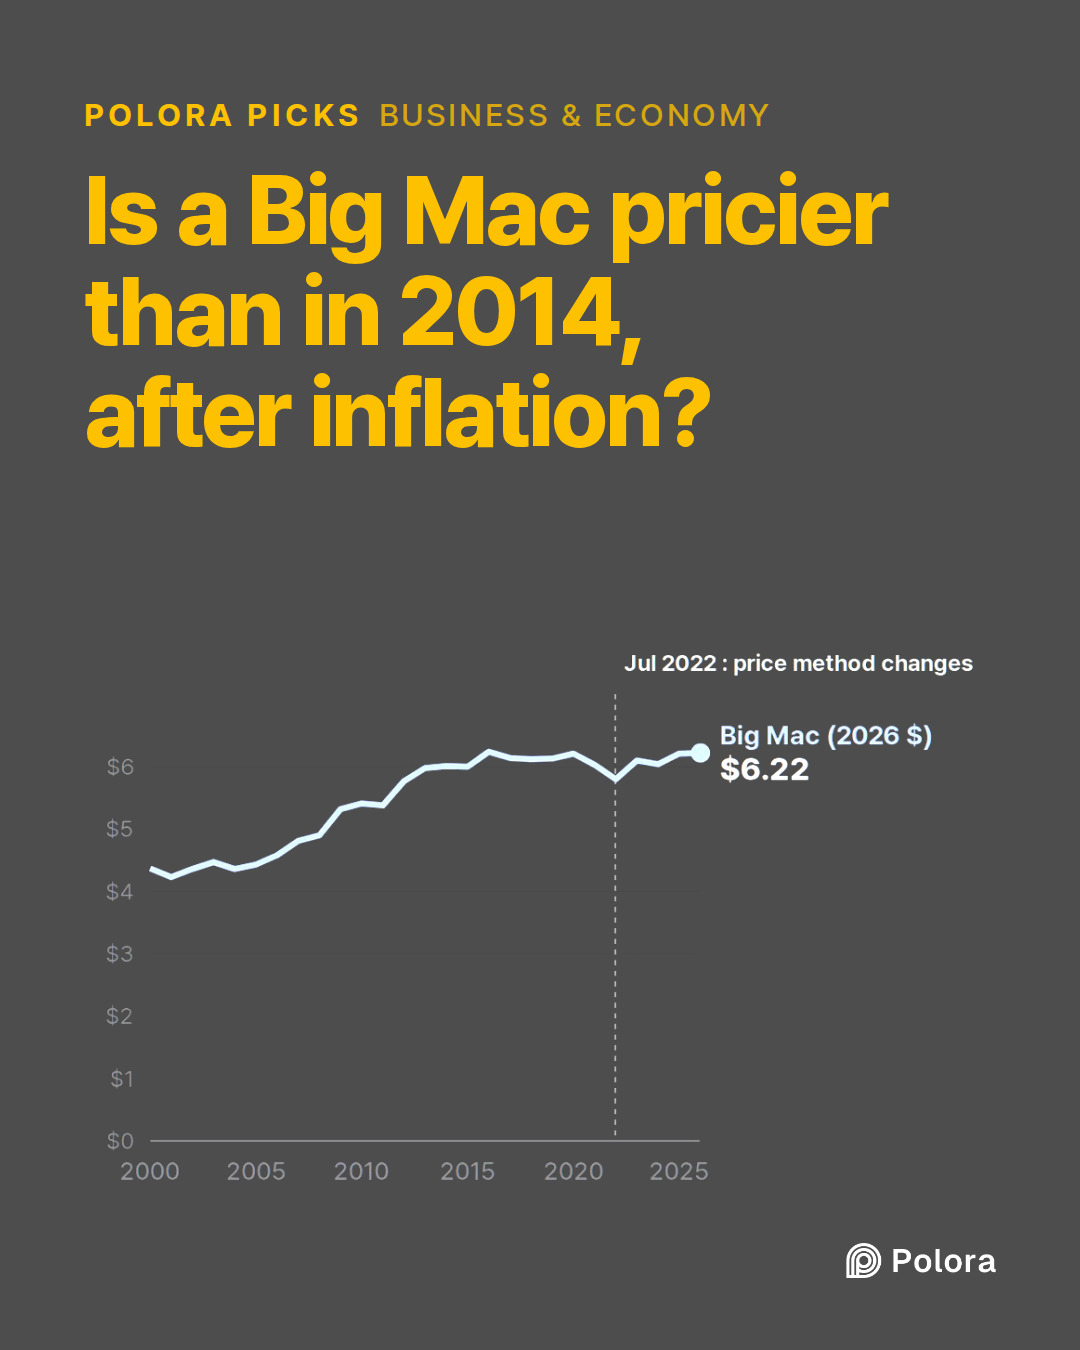
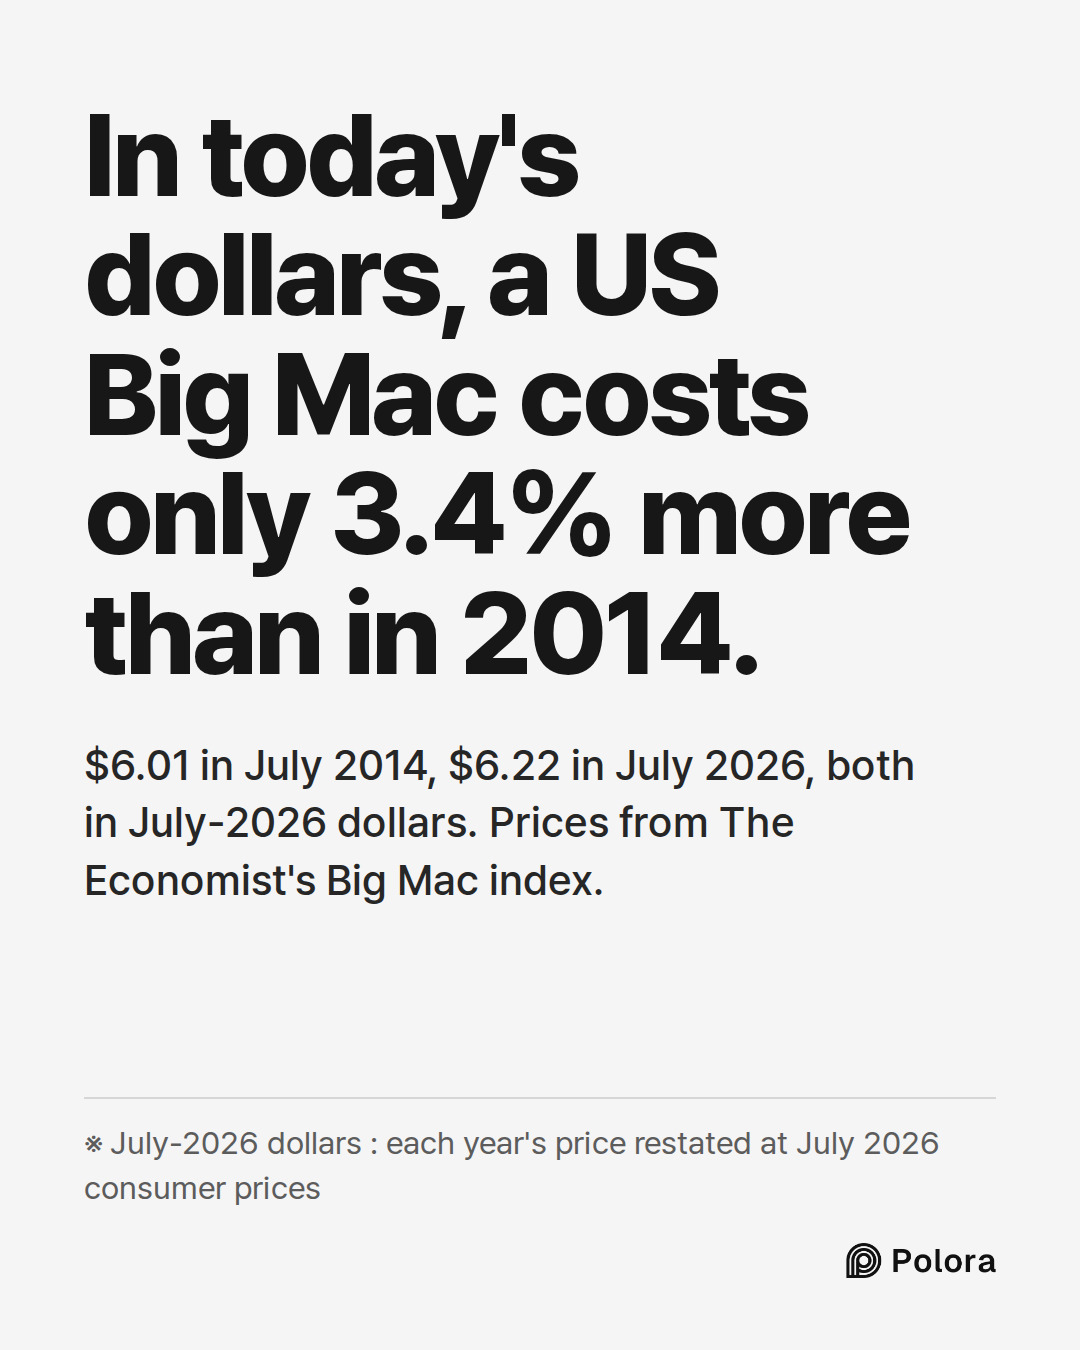
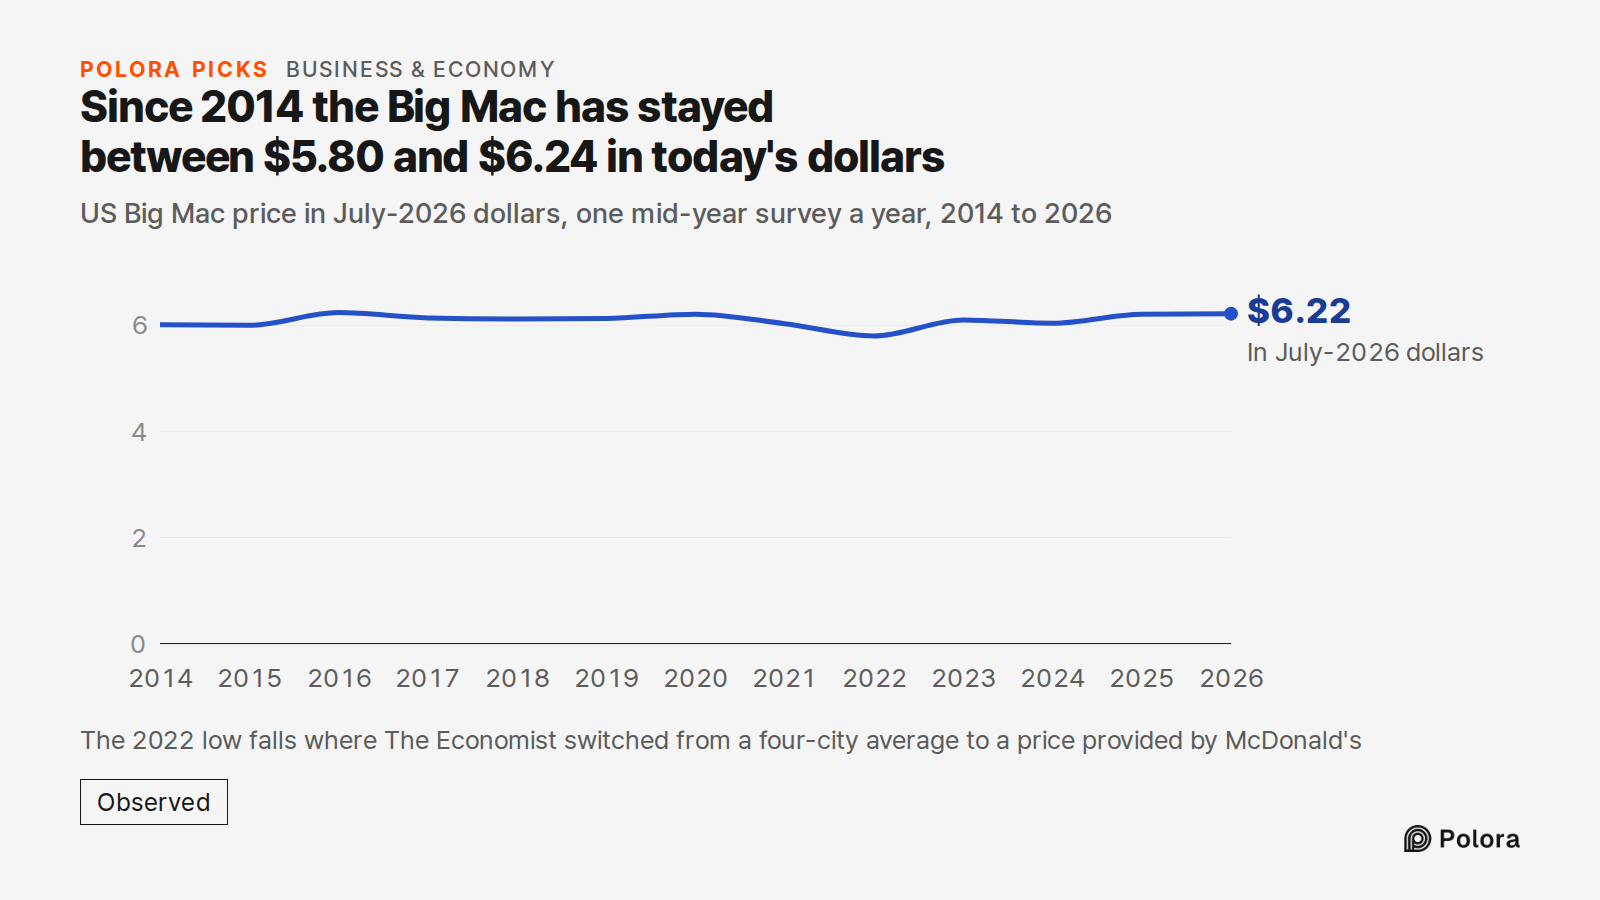
In July-2026 dollars, the July 2014 Big Mac cost $6.01 and the July 2026 one $6.22, 3.4% more. In none of the yearly mid-year surveys since 2014 has the adjusted price strayed more than 3.9% from its 2014 level; it ranged between $5.80 and $6.24.
The 2022 dip, and a change in how the price is measured
The largest dip since 2014 comes in 2021 and 2022, when inflation surged. Between July 2021 and July 2022 the menu price rose 4.5% while consumer prices rose 8.5%, so in real terms the Big Mac got cheaper. Its adjusted price fell 6.6% from July 2020 to July 2022, to $5.80, the lowest since 2014. Over the following four years it rose 7.2% after inflation, back to $6.22.
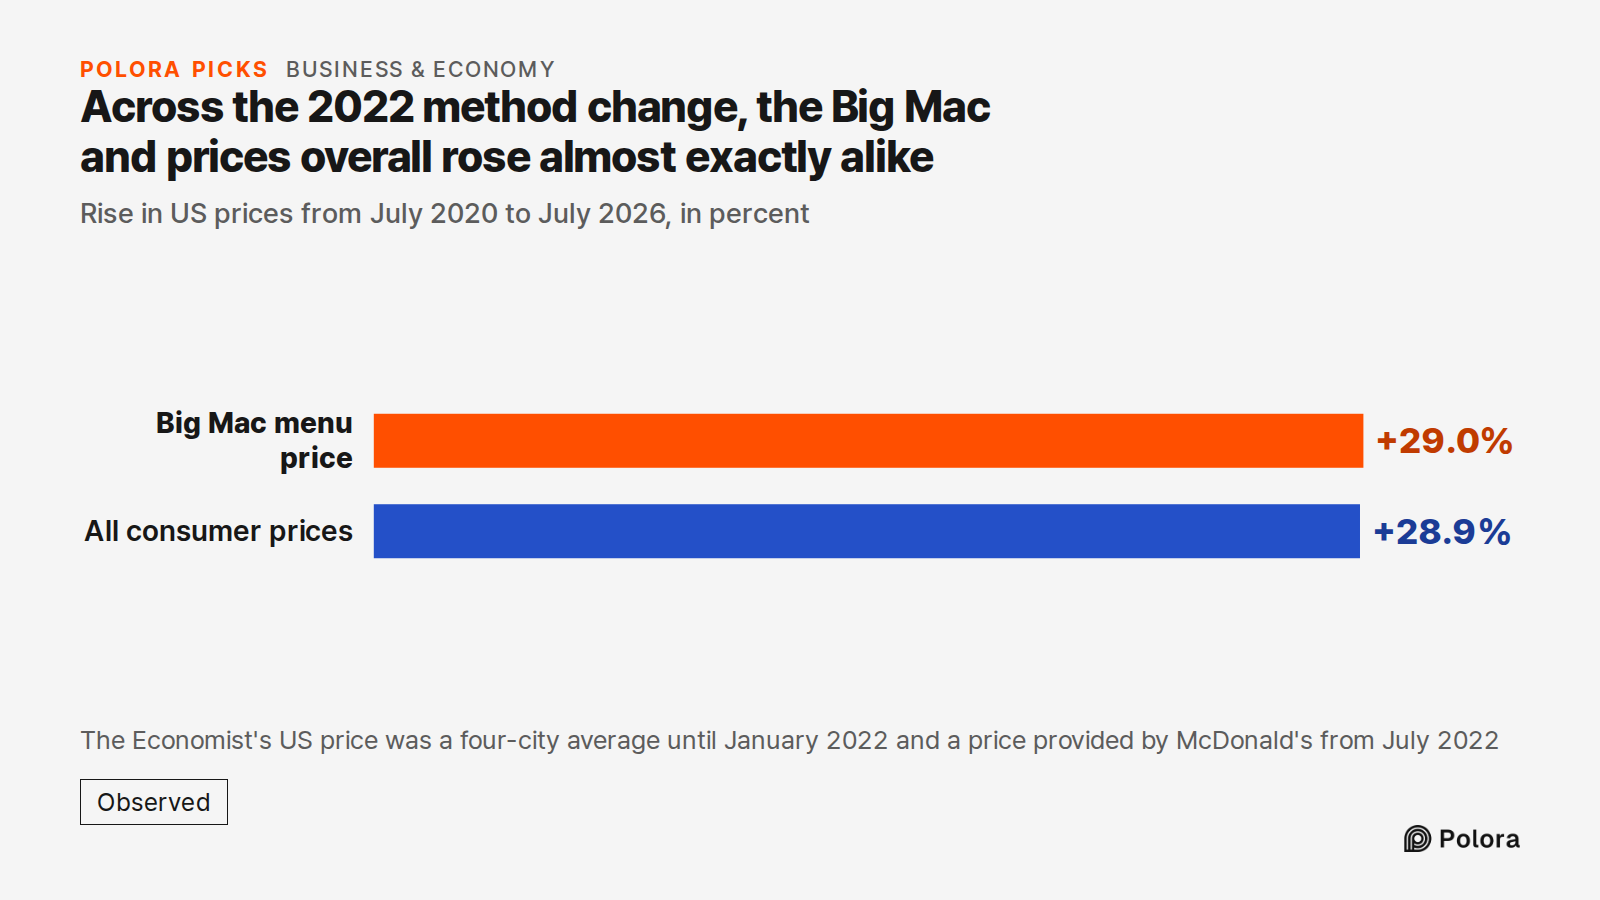
That low point falls exactly where the series changes method. Until January 2022, The Economist's US price was an average of the price in four major US cities; from July 2022 it uses a price provided by McDonald's. The two methods may not give the same level, and the data cannot say how much of the 2022 dip, or of the rebound, comes from the switch rather than from prices. Over a longer stretch that also spans the switch, the two stay almost level : from July 2020 to July 2026 the Big Mac rose 29.0%, and consumer prices 28.9%.
Against the cost of eating out, the Big Mac got cheaper
The CPI used above tracks a representative basket of goods and services bought by urban consumers, which the Bureau of Labor Statistics describes as running "from food items to automobiles to rent." A narrower comparison is with eating out. The government's price index for food away from home rose 59% from July 2014 to July 2026, faster than the Big Mac's 45%. Measured against what eating out costs in general, the Big Mac is about 9% cheaper than in 2014. Between 2005 and 2014, by contrast, it outpaced that index too : measured against it, its price rose about 29%.
So whether the Big Mac has "kept up" depends on the yardstick. Against all consumer prices, it has held steady since 2014. Against the cost of food away from home, it has fallen behind.
What this does and does not show
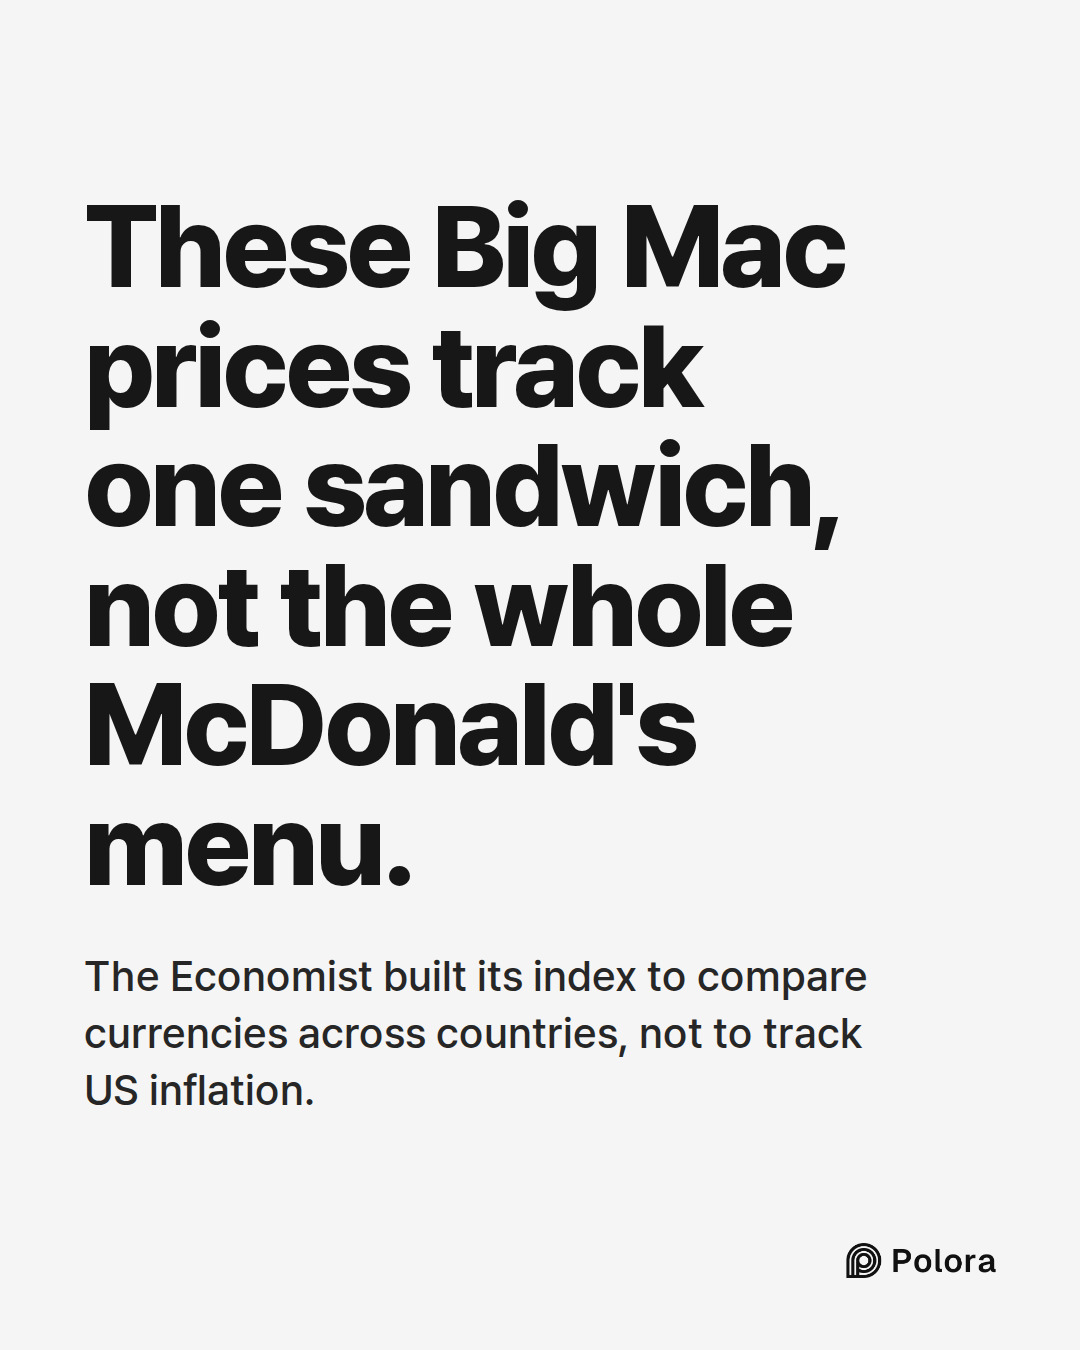
This is one sandwich, recorded once or twice a year, not a meal deal and not the McDonald's menu as a whole. Prices also differ from one restaurant to the next : as Restaurant Business has reported, McDonald's franchisees set their own prices based on local conditions, and McDonald's has published its own national average Big Mac price, which differs from The Economist's figure. The Economist built its index, first published in 1986, to compare currencies across countries, not to track US inflation; using its US price over time is a different use of the same numbers.
The data show when the Big Mac's price rose faster or slower than other prices. They do not show why : costs, wages, competition and pricing decisions are not in these numbers.
How the numbers were made
The Big Mac prices are The Economist's US prices from its Big Mac index data, using one mid-year survey a year (April to July). Each price is converted into July-2026 dollars with the US Bureau of Labor Statistics' Consumer Price Index for All Urban Consumers, all items, not seasonally adjusted, taken at the month of each survey. The restaurant comparison uses the same index's food-away-from-home component, at the same months. Using every survey date, January ones included, gives the same broad shape; the highest adjusted price since 2014 is then the January 2026 survey, at $6.28, 4.5% above July 2014. Calculations by Polora.
- The Economist, Big Mac index data and methodology (CC BY 4.0)
- US Bureau of Labor Statistics, Consumer Price Index for All Urban Consumers, all items, not seasonally adjusted, via FRED, Federal Reserve Bank of St. Louis
- US Bureau of Labor Statistics, Consumer Price Index for All Urban Consumers, food away from home, via FRED, Federal Reserve Bank of St. Louis
- US Bureau of Labor Statistics, Consumer Price Index frequently asked questions
- Restaurant Business, "McDonald's hits back about its prices"
- Wikipedia, Big Mac Index