Two lines that crossed
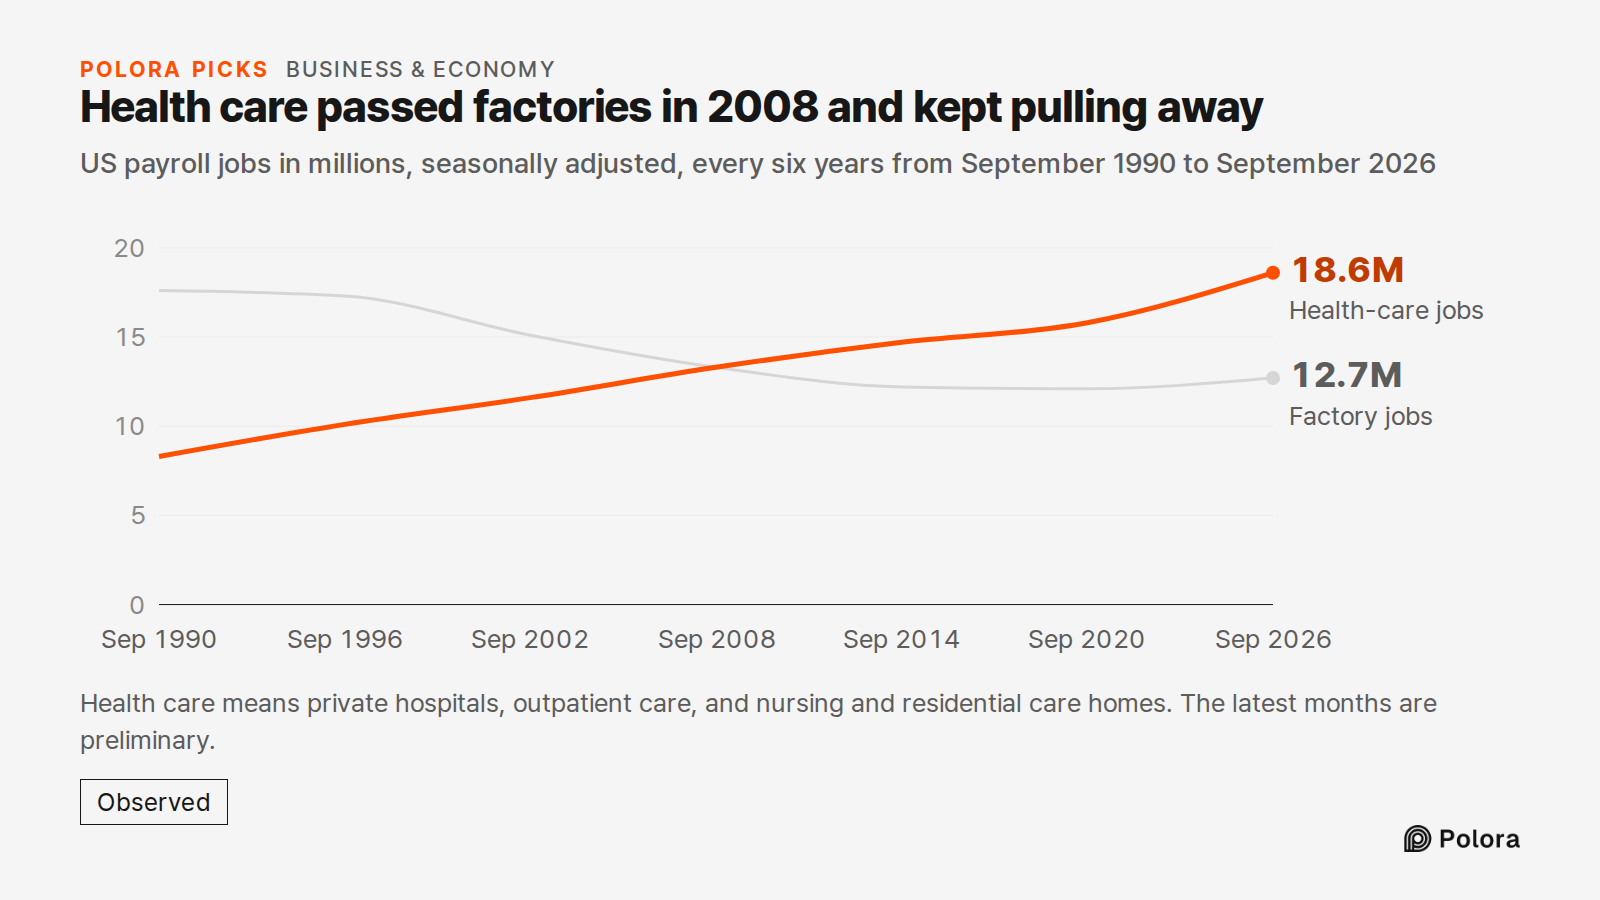
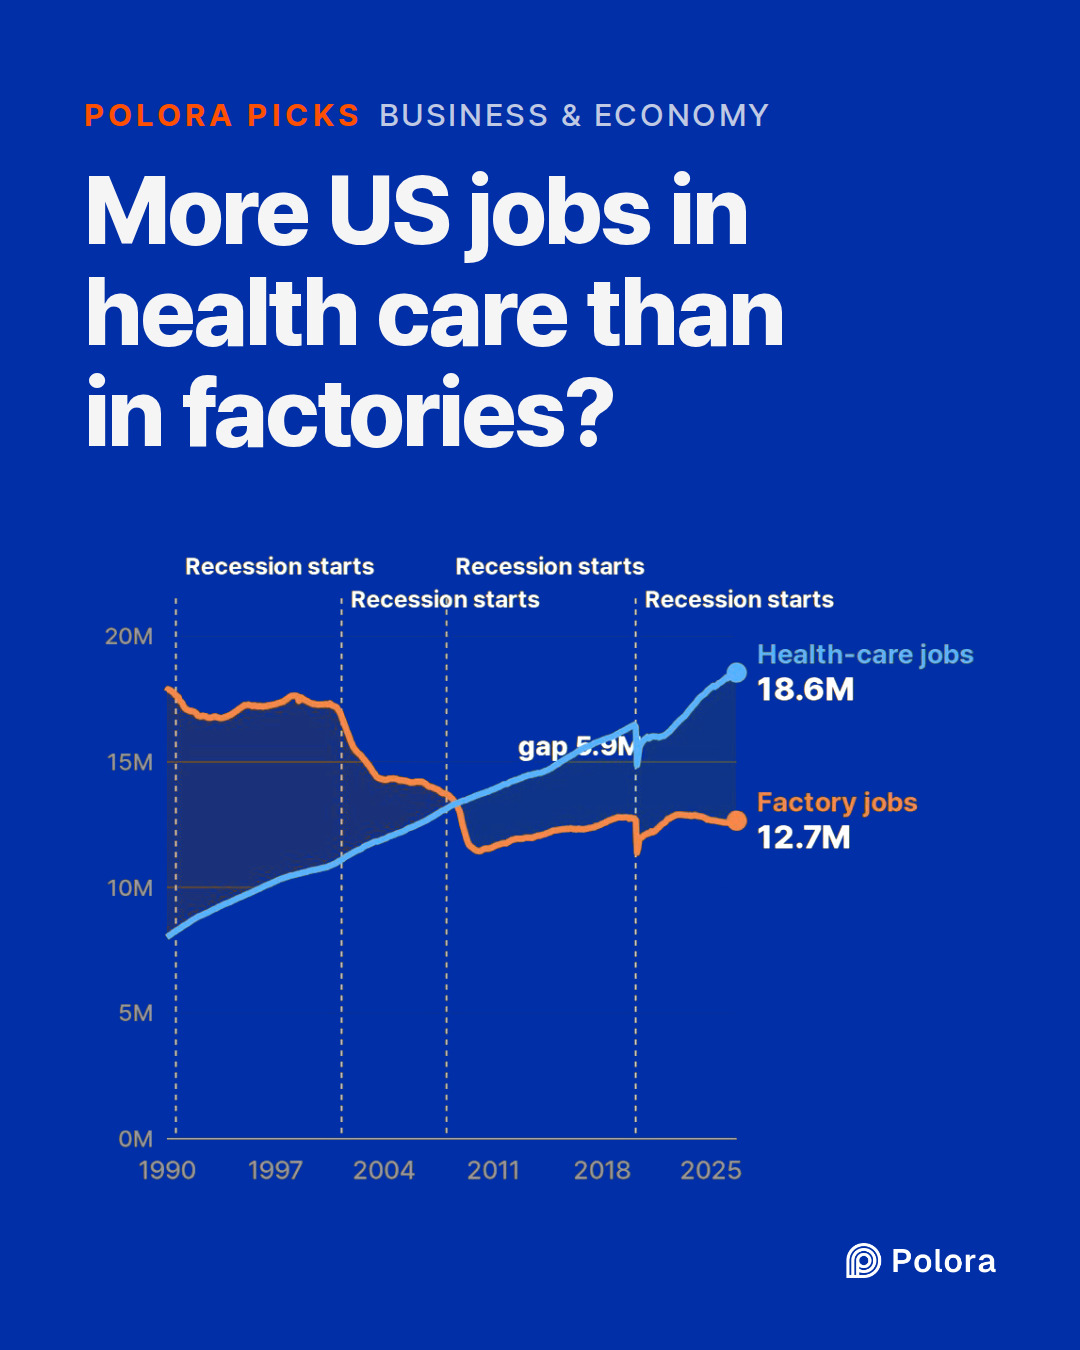
In January 1990, manufacturing had 17.8 million jobs and health care 8.0 million, a ratio of 2.2 to 1. Manufacturing then accounted for 16.3% of all nonfarm payroll jobs, private and government; health care for 7.3%.
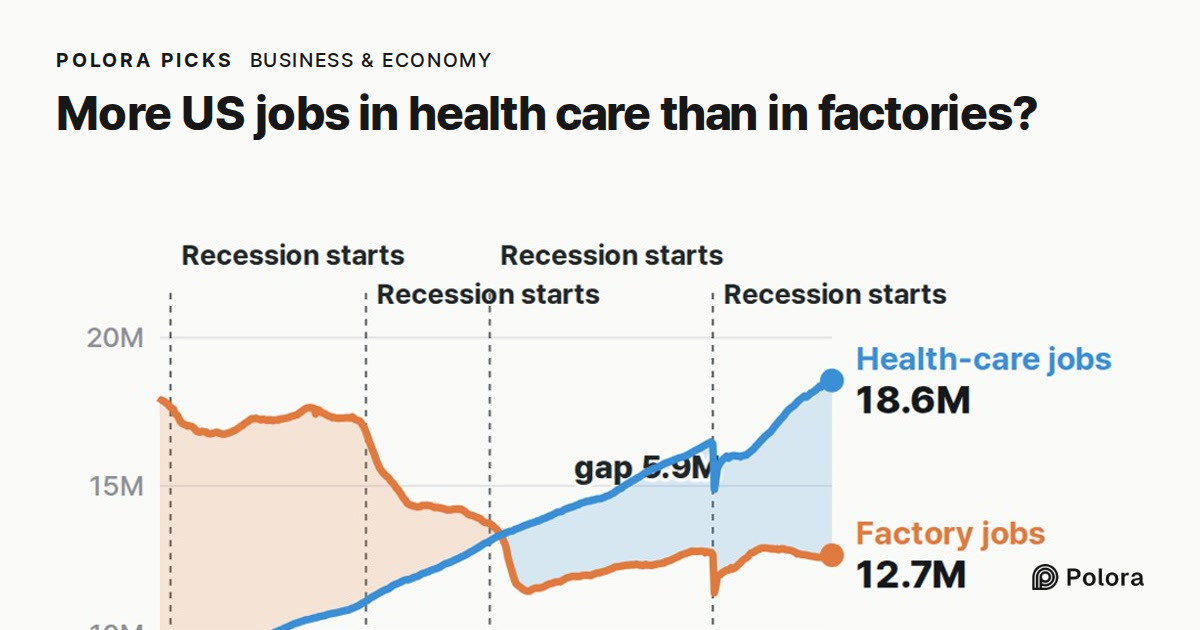
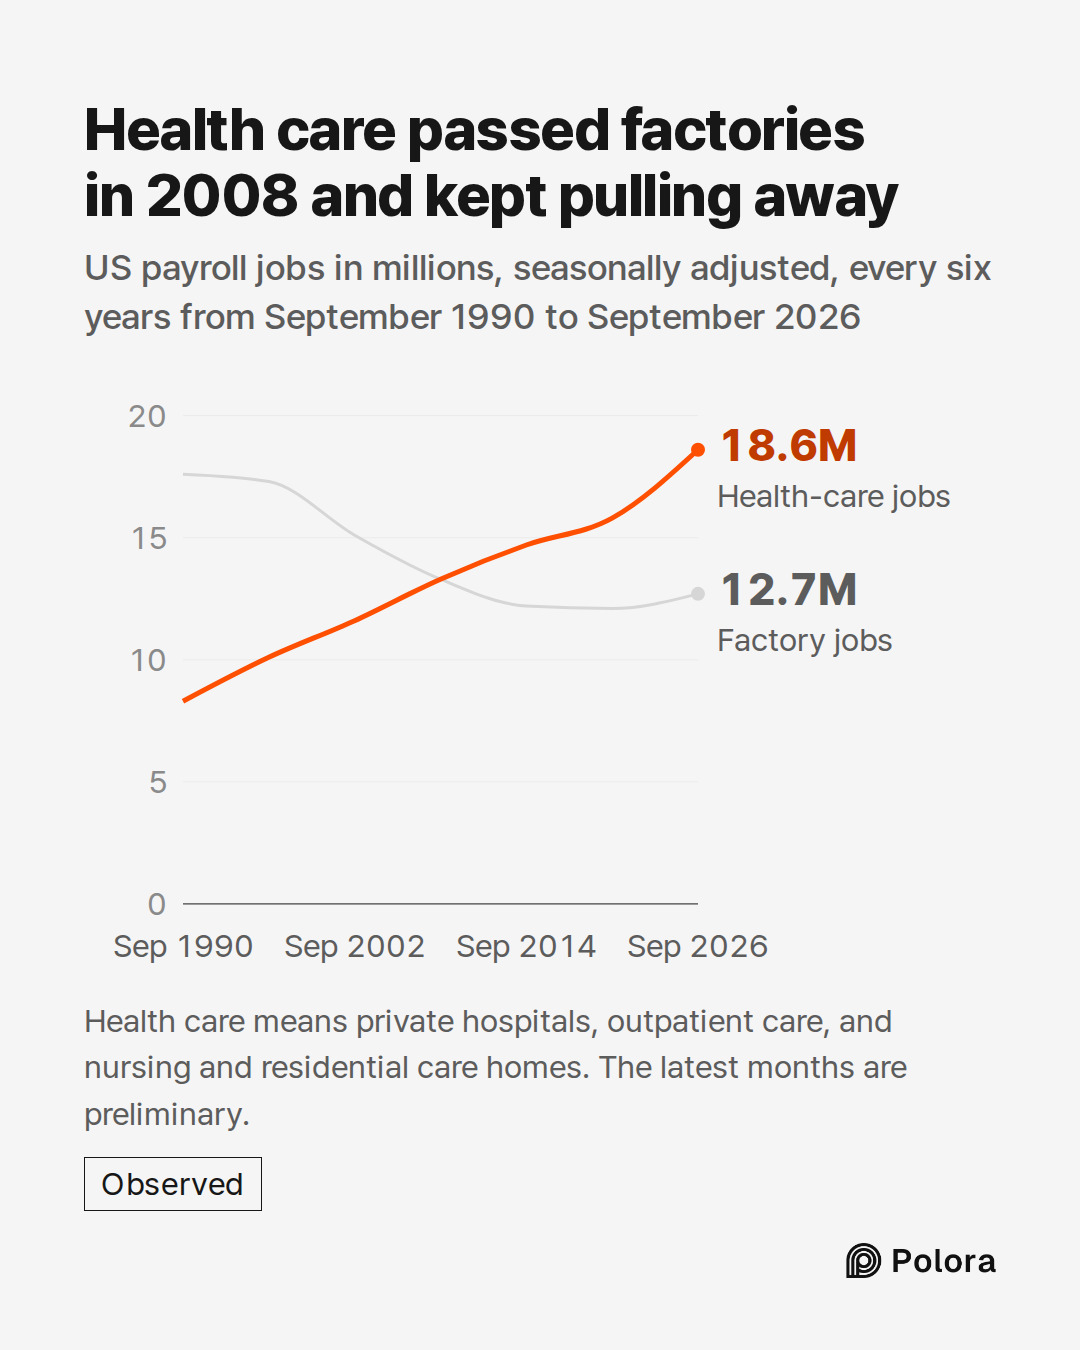
By then, factory employment was already well past its high point : it peaked at 19.6 million in June 1979. It drifted lower through the 1990s, then fell much faster after 2000. From 17.2 million in December 2000, it dropped to 11.4 million by February 2010, a loss of 5.7 million jobs in a little over nine years. Health care kept growing, with only rare, small monthly dips, and the two lines crossed during the Great Recession. In August 2008 factories were still ahead by about 12,000 jobs. In September 2008 health care led by 82,400, and it has led in every month since.
The numbers come from the Bureau of Labor Statistics' monthly survey of employers, the same survey behind the jobs report each month. It counts payroll jobs, seasonally adjusted, and files each workplace under its main activity, so every job on a manufacturing workplace's payroll counts as a factory job, whatever the worker does there. Someone on the payroll of two workplaces is counted at each. "Health care" here means the private sector's hospitals, outpatient care such as doctors' offices, and nursing and residential care homes. Government employment is counted separately, and social assistance, such as services for older people and people with disabilities, is left out.
Why factories shed jobs
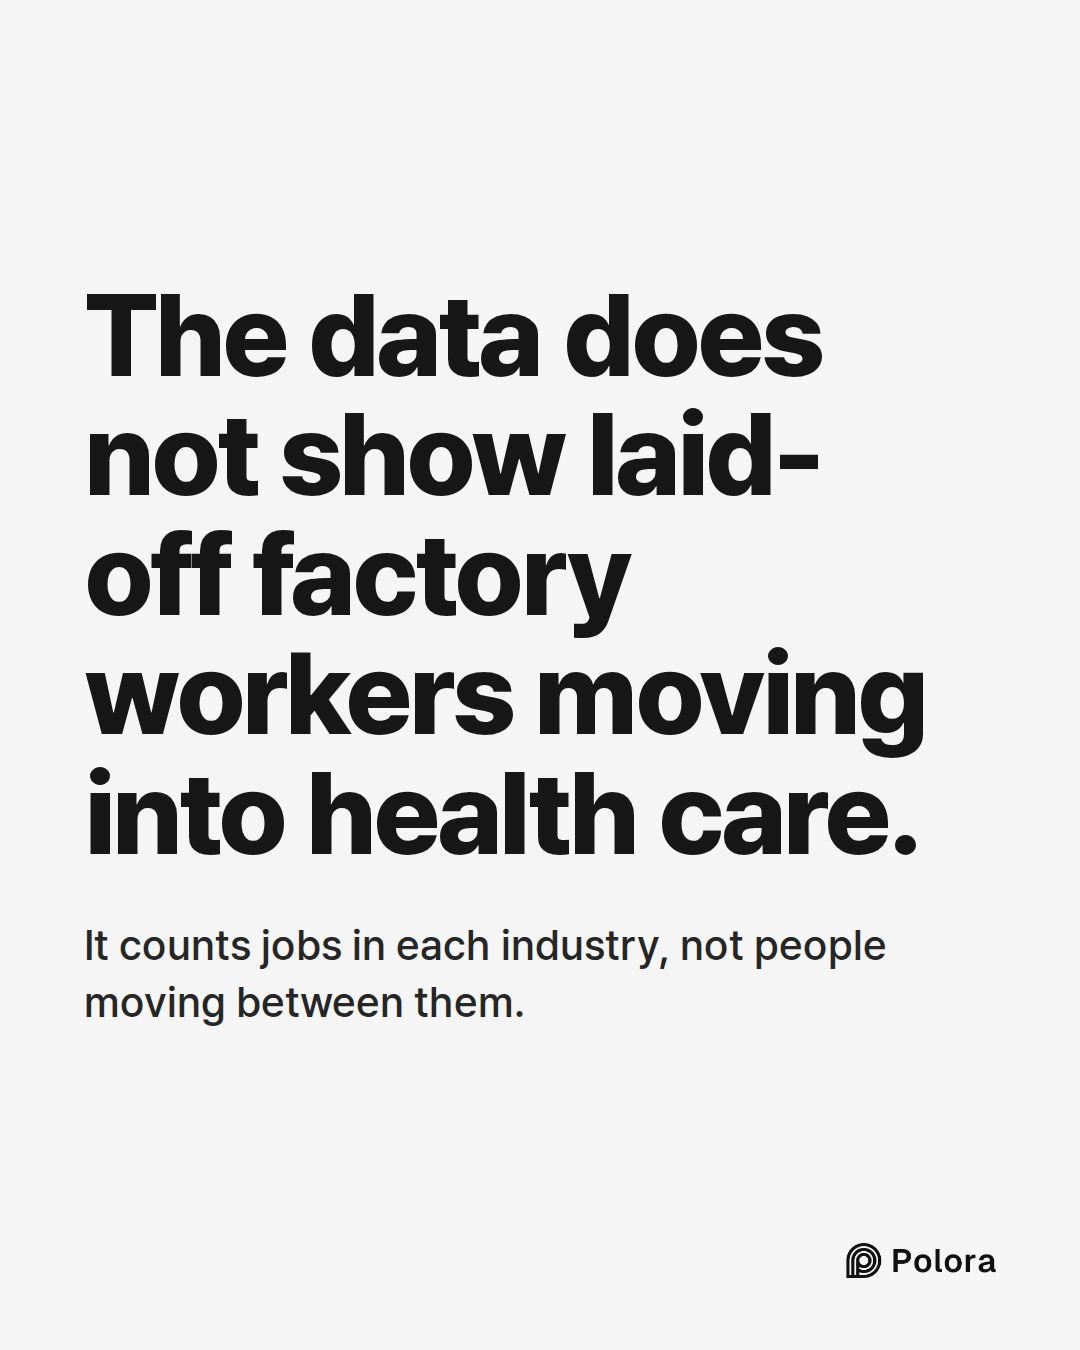
There is no simple answer. A 2021 article in the BLS's Monthly Labor Review says factory job loss in the early 2000s "has no single explanation", but notes that China was granted permanent normal trade relations with the United States in 2000, a change "often cited as a key factor" in the decade's decline. The same article explains that factory output did not fall the way employment did, because labor productivity rose : companies needed fewer workers to make the same amount. These two lines do not show that laid-off factory workers moved into health care; the data counts jobs in each industry, not people moving between them.
The gap opens up
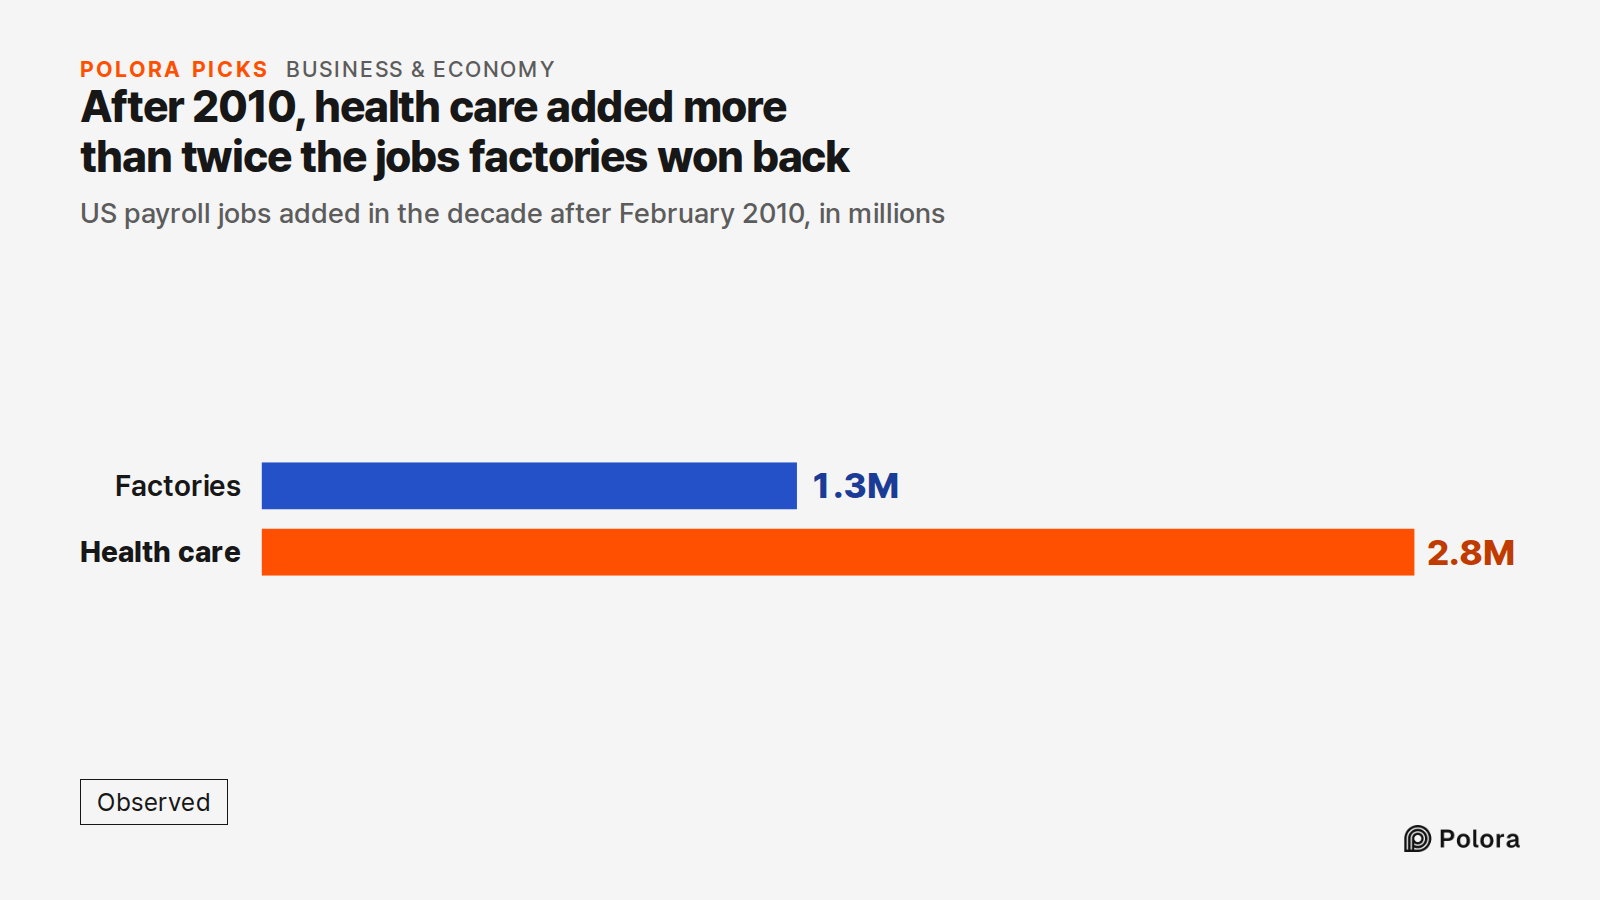
February 2010 was the factories' lowest point between 1990 and the pandemic. In the decade from there, factories won back 1.3 million jobs, while health care added 2.8 million, more than twice as many. Health care's growth was not perfectly smooth : of the 440 month-to-month changes since 1990, it fell in 12, and only three of those came before 2020. By yearly averages, it shrank in just one of the full years from 1990 to 2025 : 2020.
Then Covid arrived. From February to April 2020, health care lost 1.6 million jobs and factories lost 1.4 million. Health care lost more jobs, so the gap briefly narrowed, though in percentage terms factories fell slightly harder, 10.7% against 9.7%. Both had regained their February 2020 level by 2022 : factories in June, health care in October. Since then they have moved apart again. Factory jobs have slipped back below their pre-pandemic level, by 91,000 in September 2026, while health care has climbed well above its own.
Where things stand
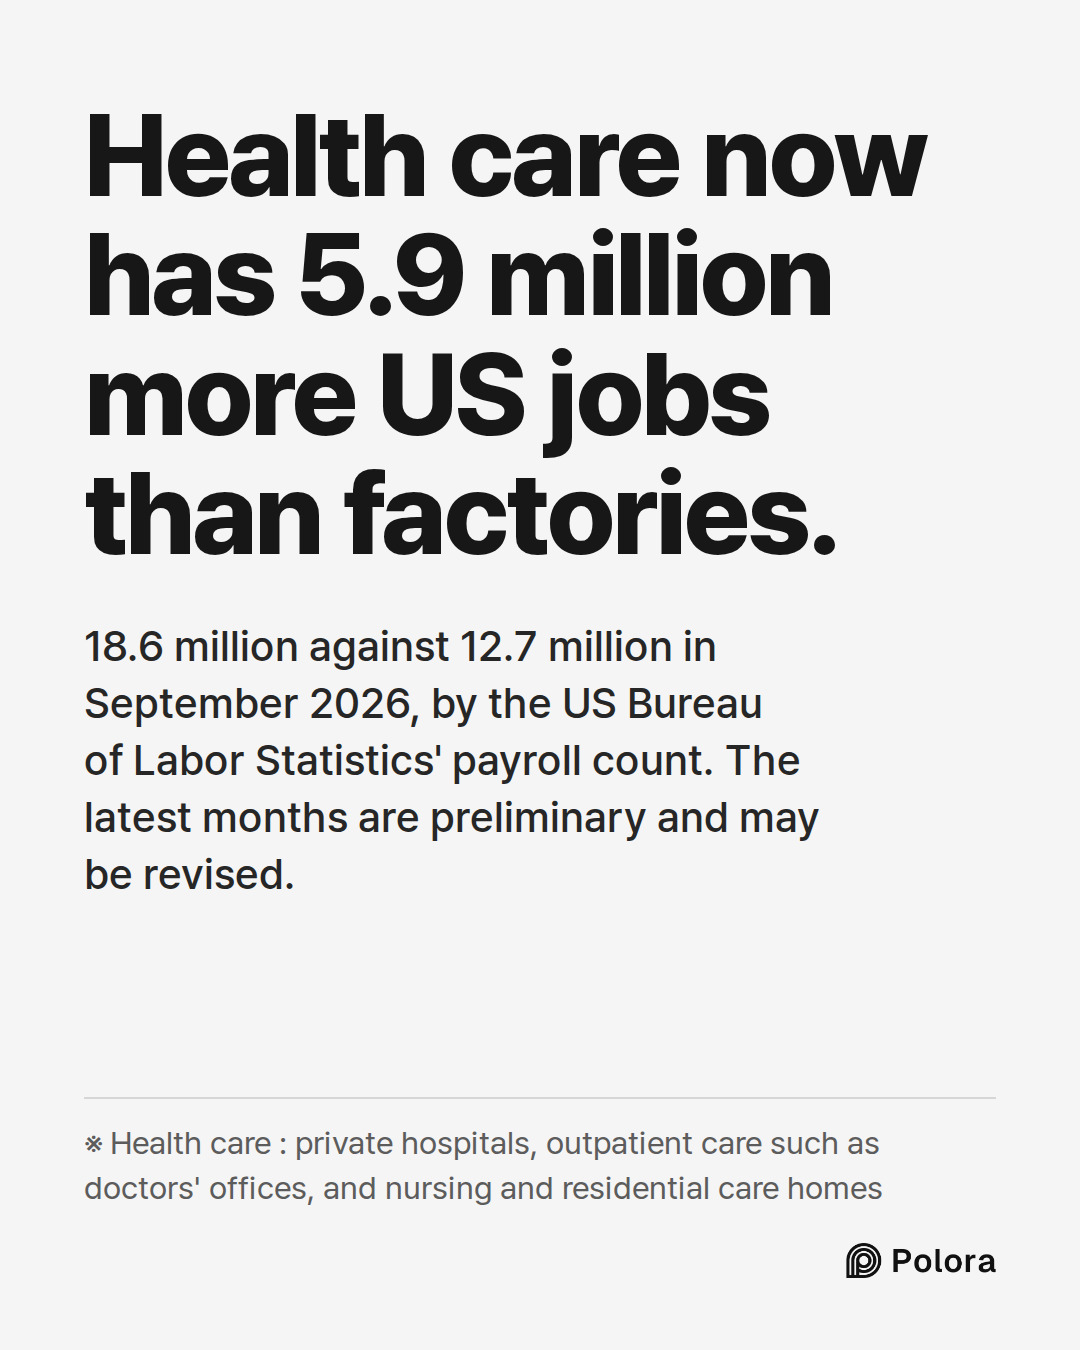
In September 2026, health care had 18.6 million jobs, 2.3 times its 1990 count. Manufacturing had 12.7 million, 5.1 million fewer than in 1990. The gap, 5.9 million, is the widest in any month since the health-care series began in 1990. Health care is now 11.7% of all nonfarm payroll jobs, and manufacturing 8.0%.
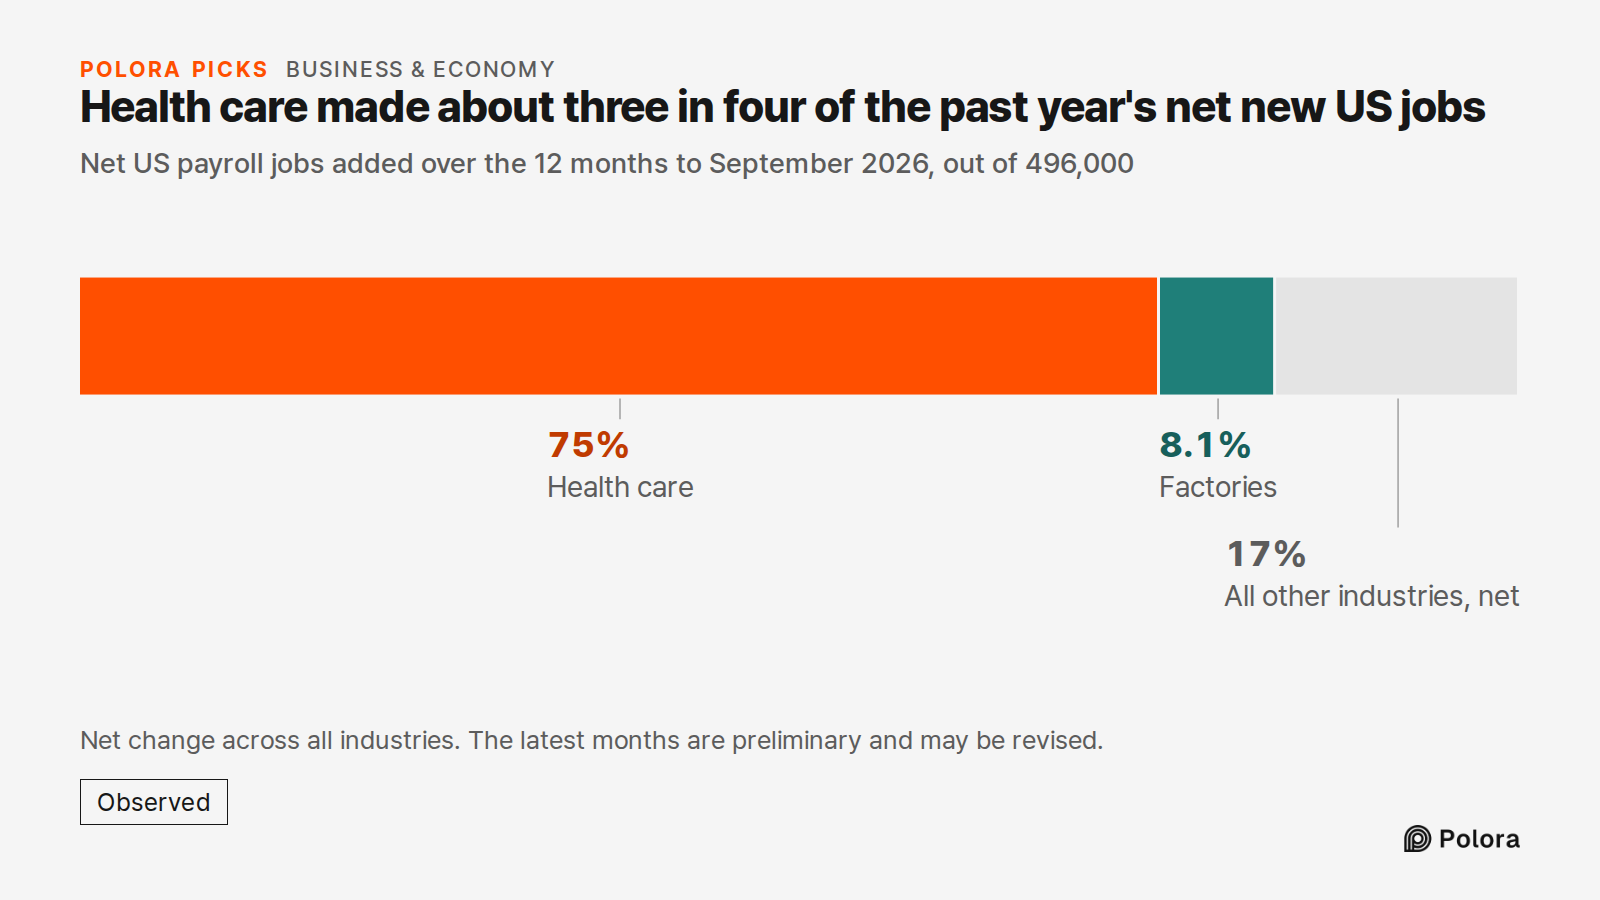
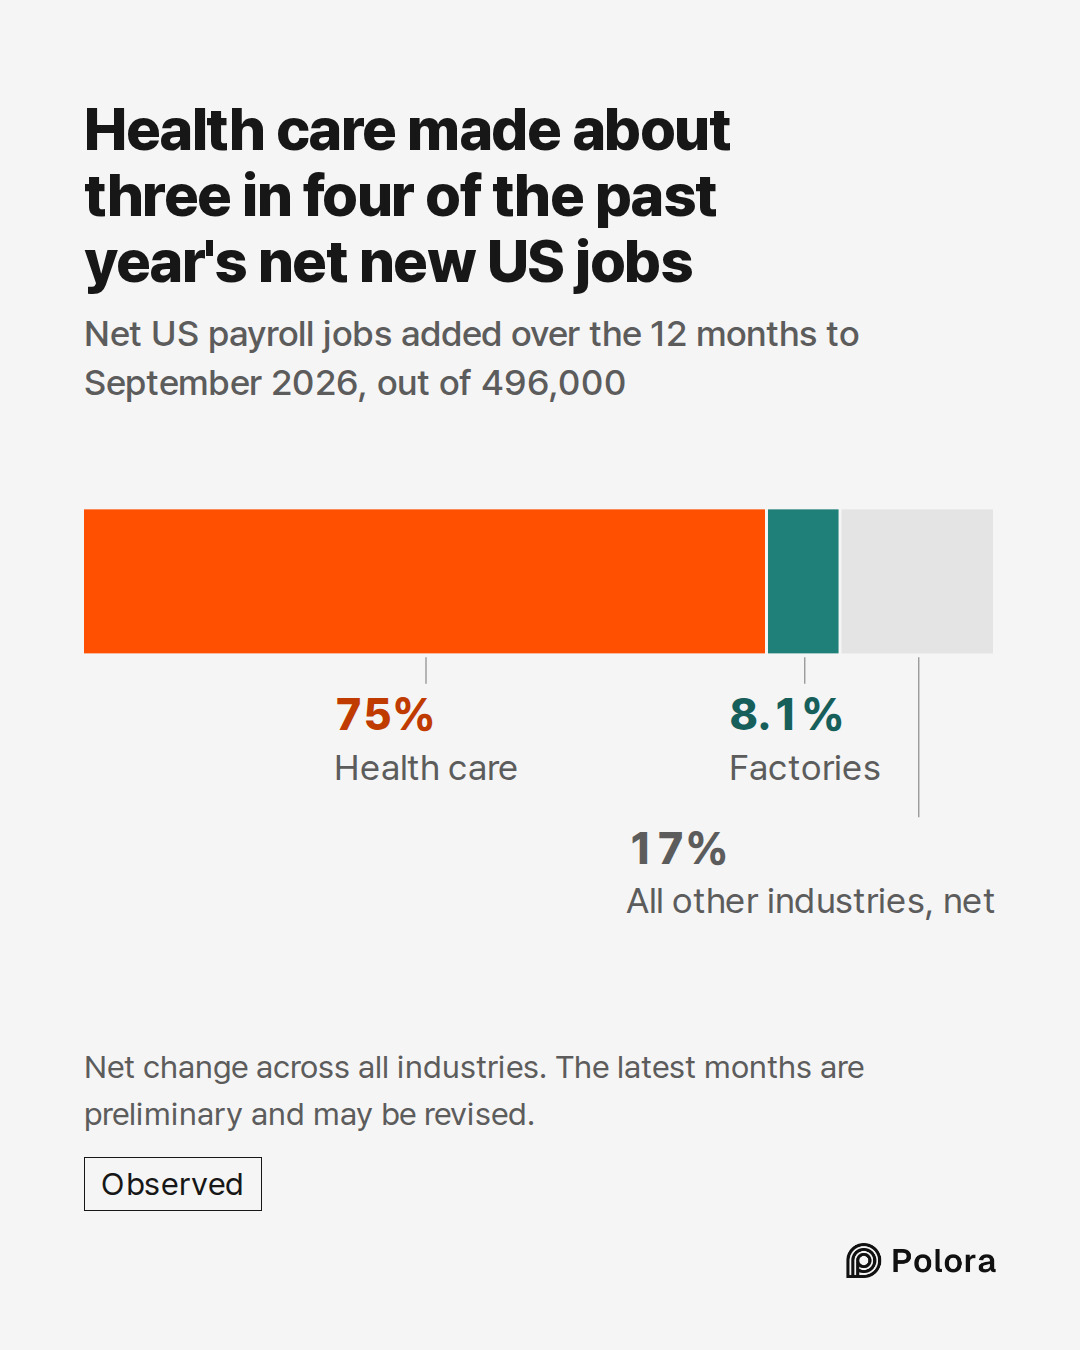
The past year shows the same pattern. Over the 12 months to September 2026, the US added a net 496,000 payroll jobs. Health care alone added 372,000 of them, about three in every four, while factories added 40,000.
The BLS marks the latest months as preliminary, and its figures are subject to revision, so the most recent numbers may still change.
What the definition changes
Where you draw the line around "health care" matters for the date of the crossing, not for the direction. If social assistance is counted too, as the BLS does in its wider health care and social assistance sector, that group passed manufacturing earlier, in January 2004, and had 24.0 million jobs in September 2026.
What comes next
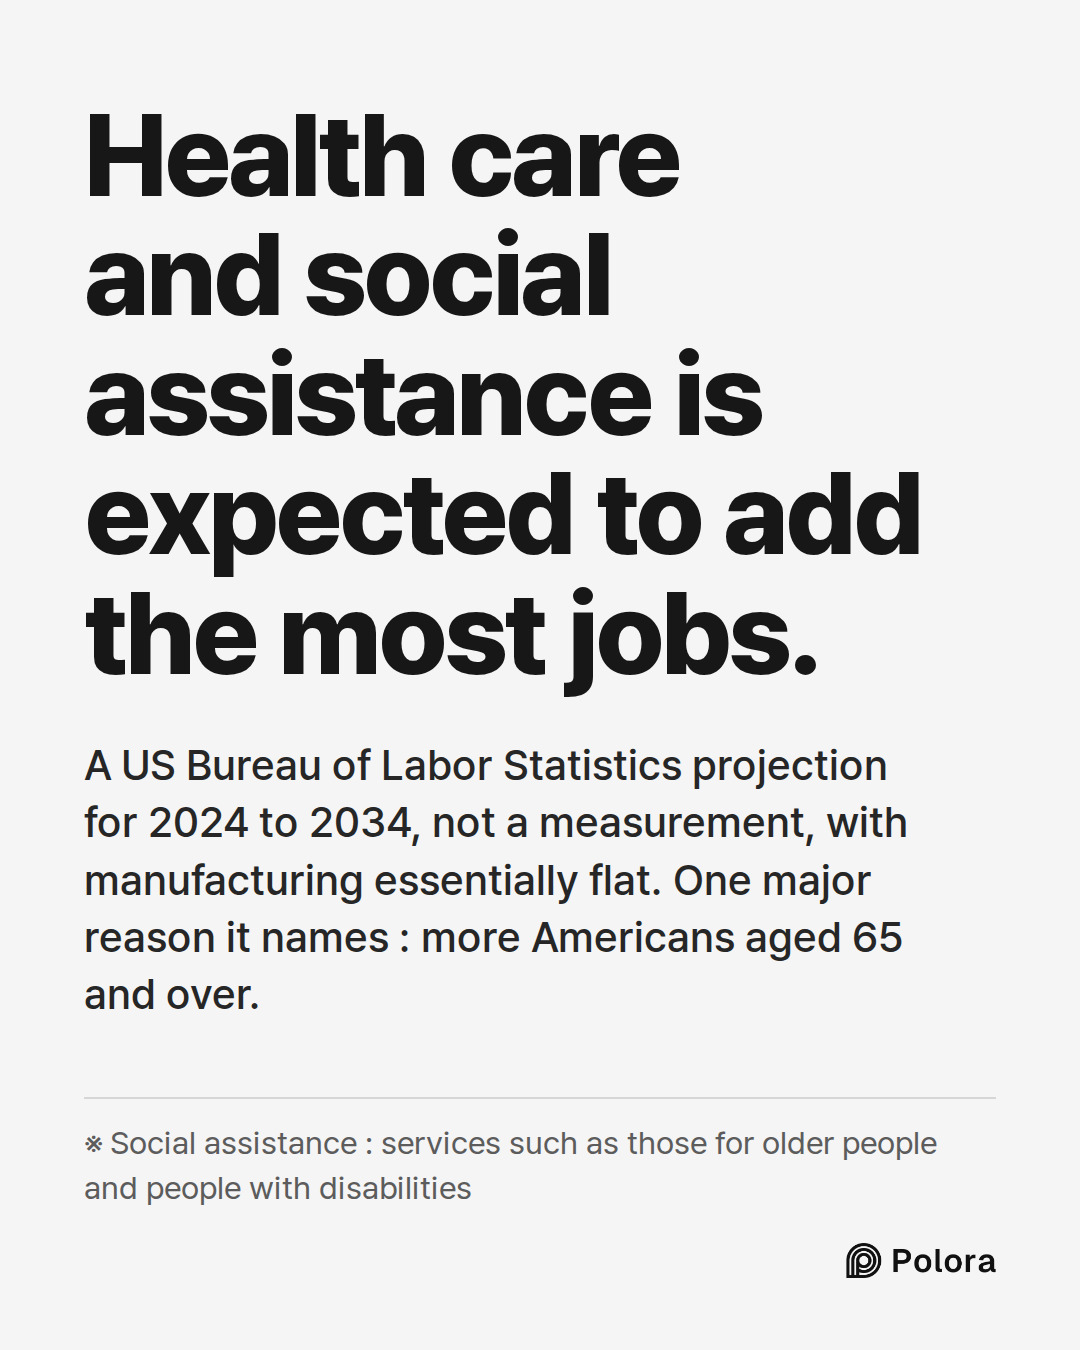
Health care and social assistance is also where the BLS expects the most growth. In its projections for 2024 to 2034, as summarized in a January 2026 Monthly Labor Review article, health care and social assistance is the fastest-growing of all sectors and adds more jobs than any other, while manufacturing employment stays essentially flat. The BLS names the growing number of Americans aged 65 and over as one major reason, because older adults have more health problems, along with the growing burden of chronic disease. These are projections, not measurements, and they cover the wider sector rather than the health-care-only line above. They also group industries a little differently : for example, the projections' government category leaves out state and local government hospitals.
- [U.S. Bureau of Labor Statistics, All Employees, Manufacturing (MANEMP), via FRED, Federal Reserve Bank of St. Louis]
- [U.S. Bureau of Labor Statistics, All Employees, Health Care (CES6562000101), via FRED]
- [U.S. Bureau of Labor Statistics, All Employees, Health Care and Social Assistance (CES6562000001), via FRED]
- [U.S. Bureau of Labor Statistics, All Employees, Total Nonfarm (PAYEMS), via FRED]
- [BLS, Employment Situation, Table B-1: Employees on nonfarm payrolls by industry sector]
- [BLS Handbook of Methods, Current Employment Statistics: Concepts]
- [NBER, US Business Cycle Expansions and Contractions]
- [BLS, Industries at a Glance: Health Care and Social Assistance, NAICS 62]
![Sources 8 : fred.stlouisfed.org · [U.S. Bureau of Labor Statistics, All Employees, Manufacturing (MANEMP), via FRED, Federal Reserve Bank of St. Louis], fred.stlouisfed.org · [U.S. Bureau of Labor Statistics, All Employees, Health Care (CES6562000101), via FRED], fred.stlouisfed.org · [U.S. Bureau o](https://media.cdn.polora.ai/picks/2026/10/pickrun_c61135d0de9c439d/ne75l81HKbVsXeLC-slide-08--are-there-now-more.jpg)