The pay line and the price lines
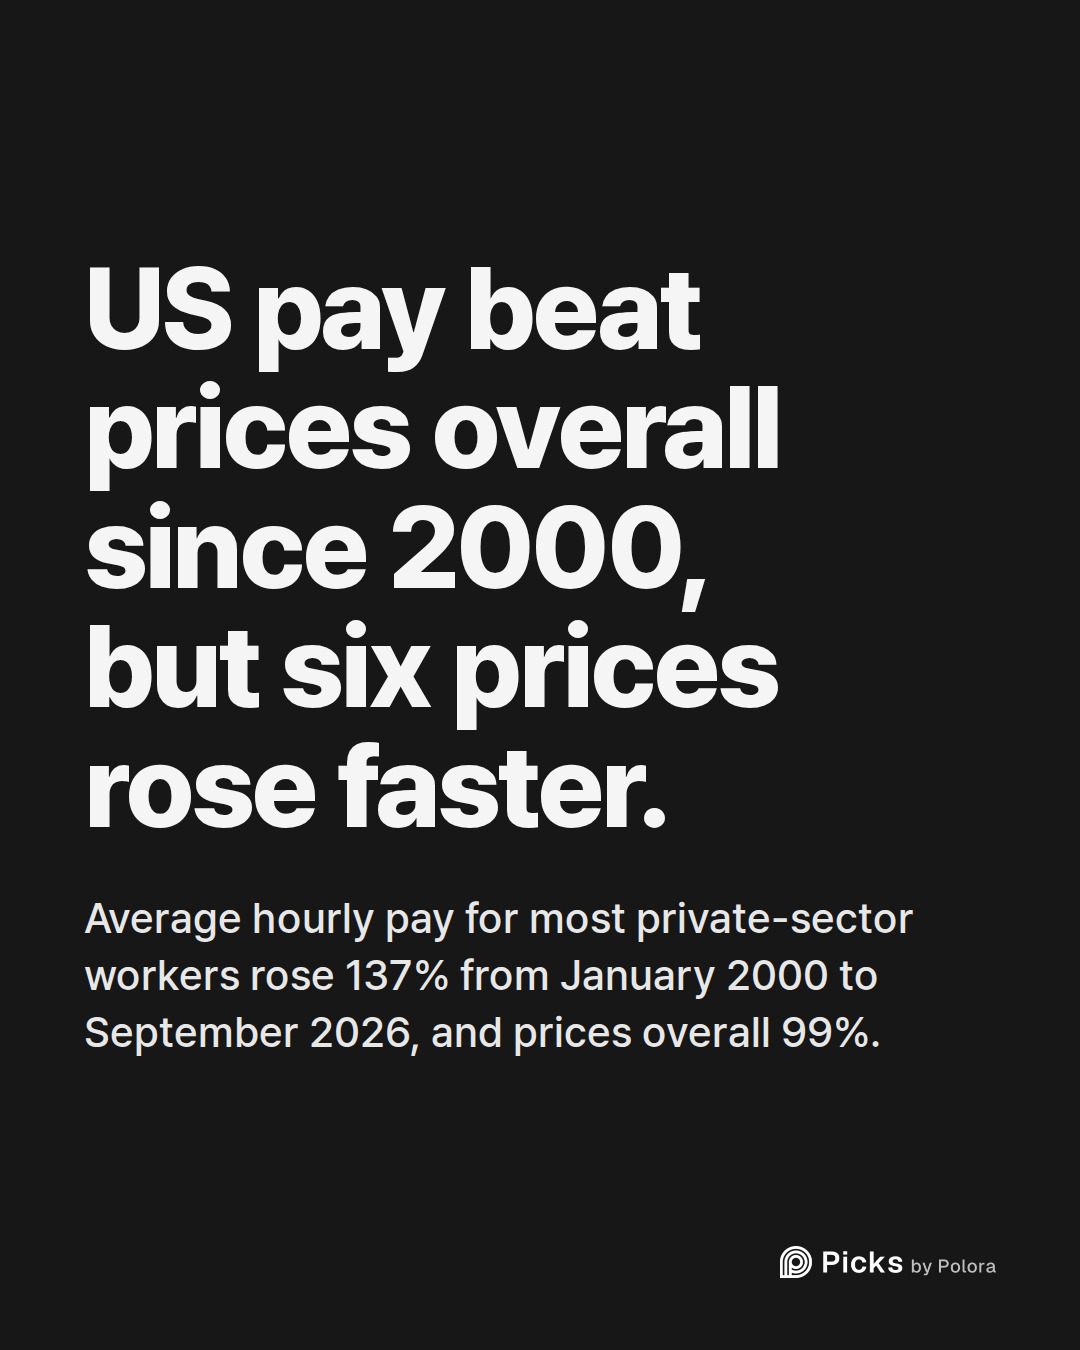
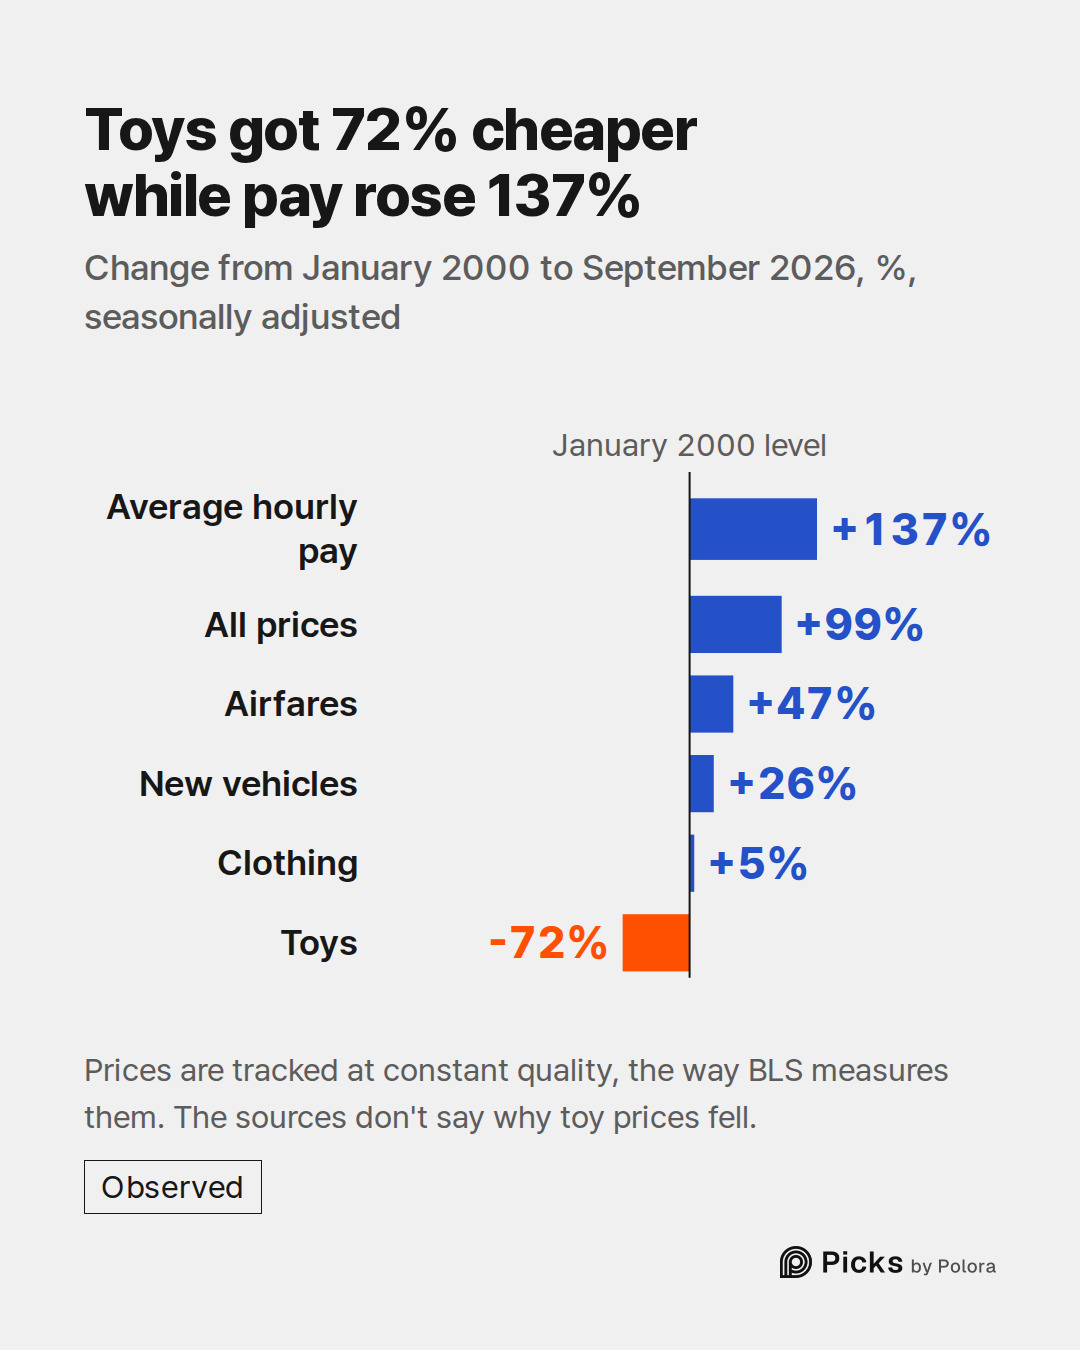
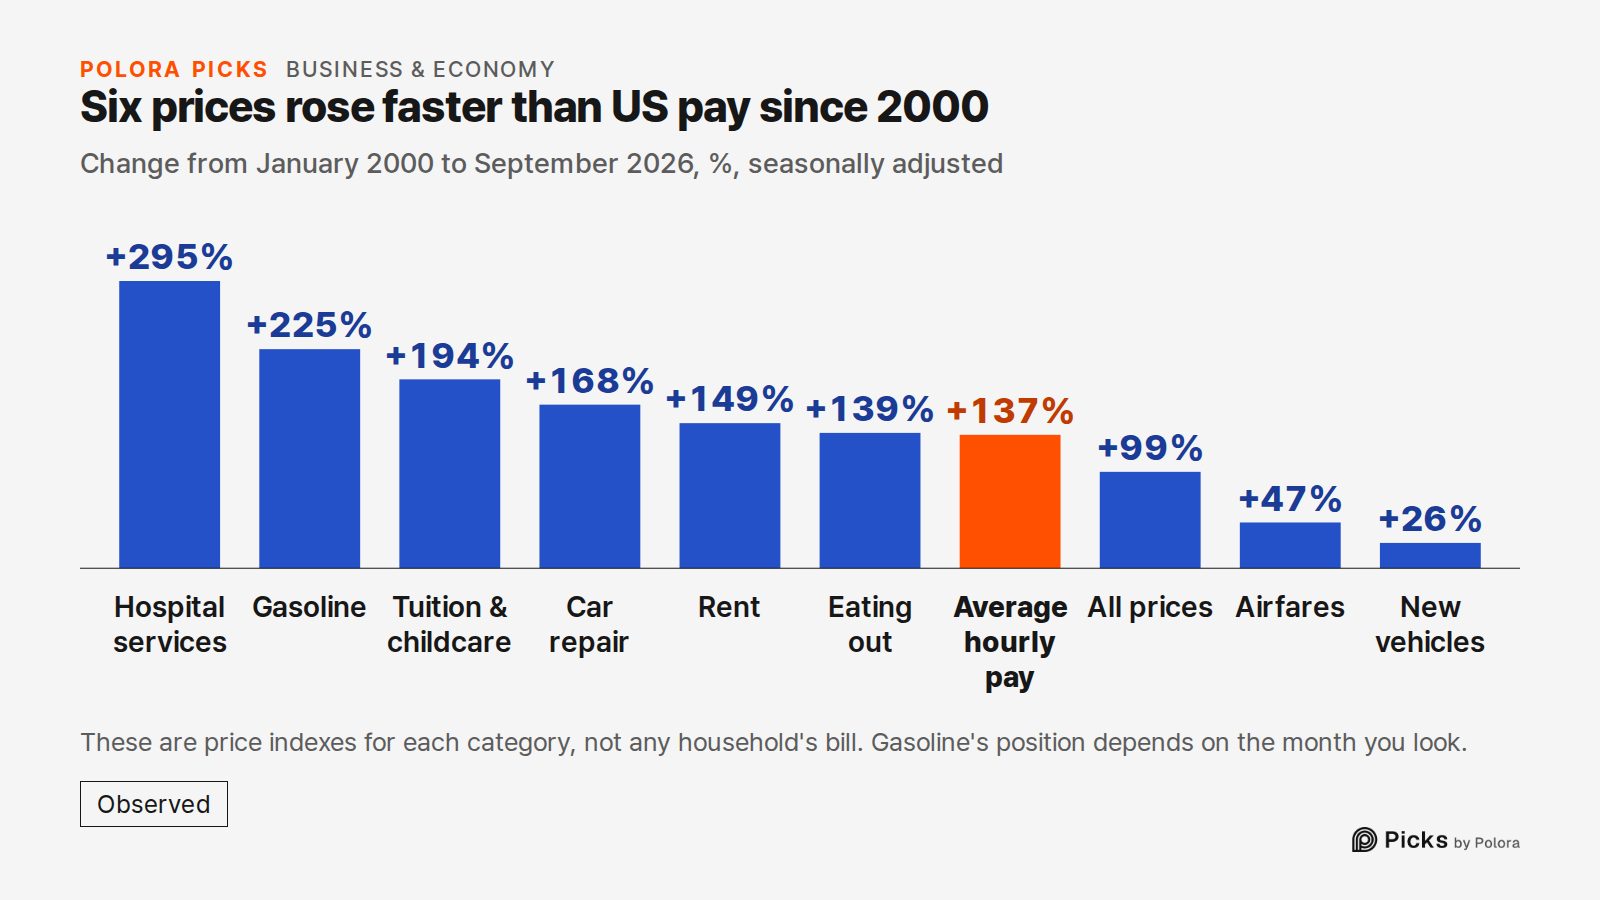
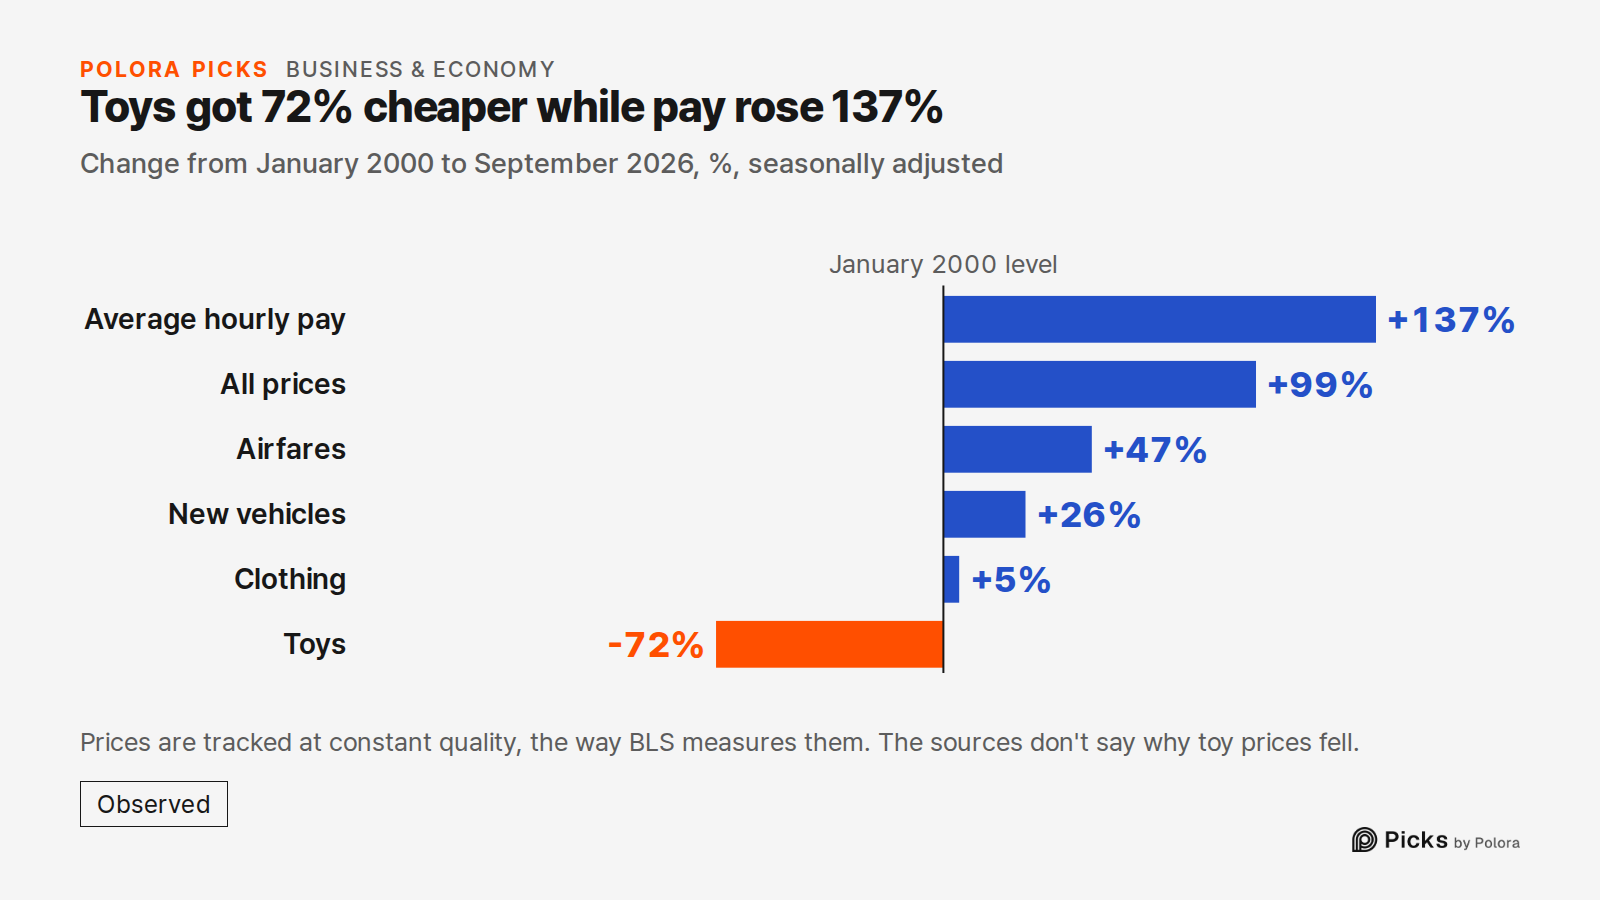
In January 2000, production and nonsupervisory workers in the private sector earned $13.74 an hour on average. In September 2026 it was $32.60, a rise of 137%. Over the same months, the Consumer Price Index for all urban consumers, the government's measure of what a typical basket of goods and services costs, rose 99%.
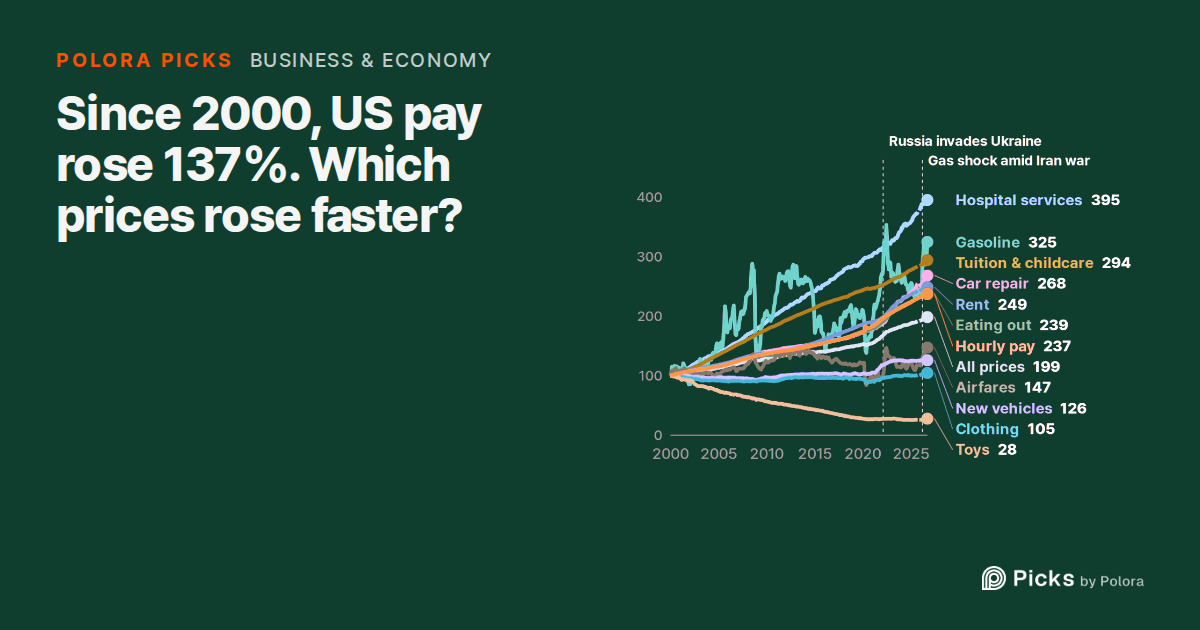
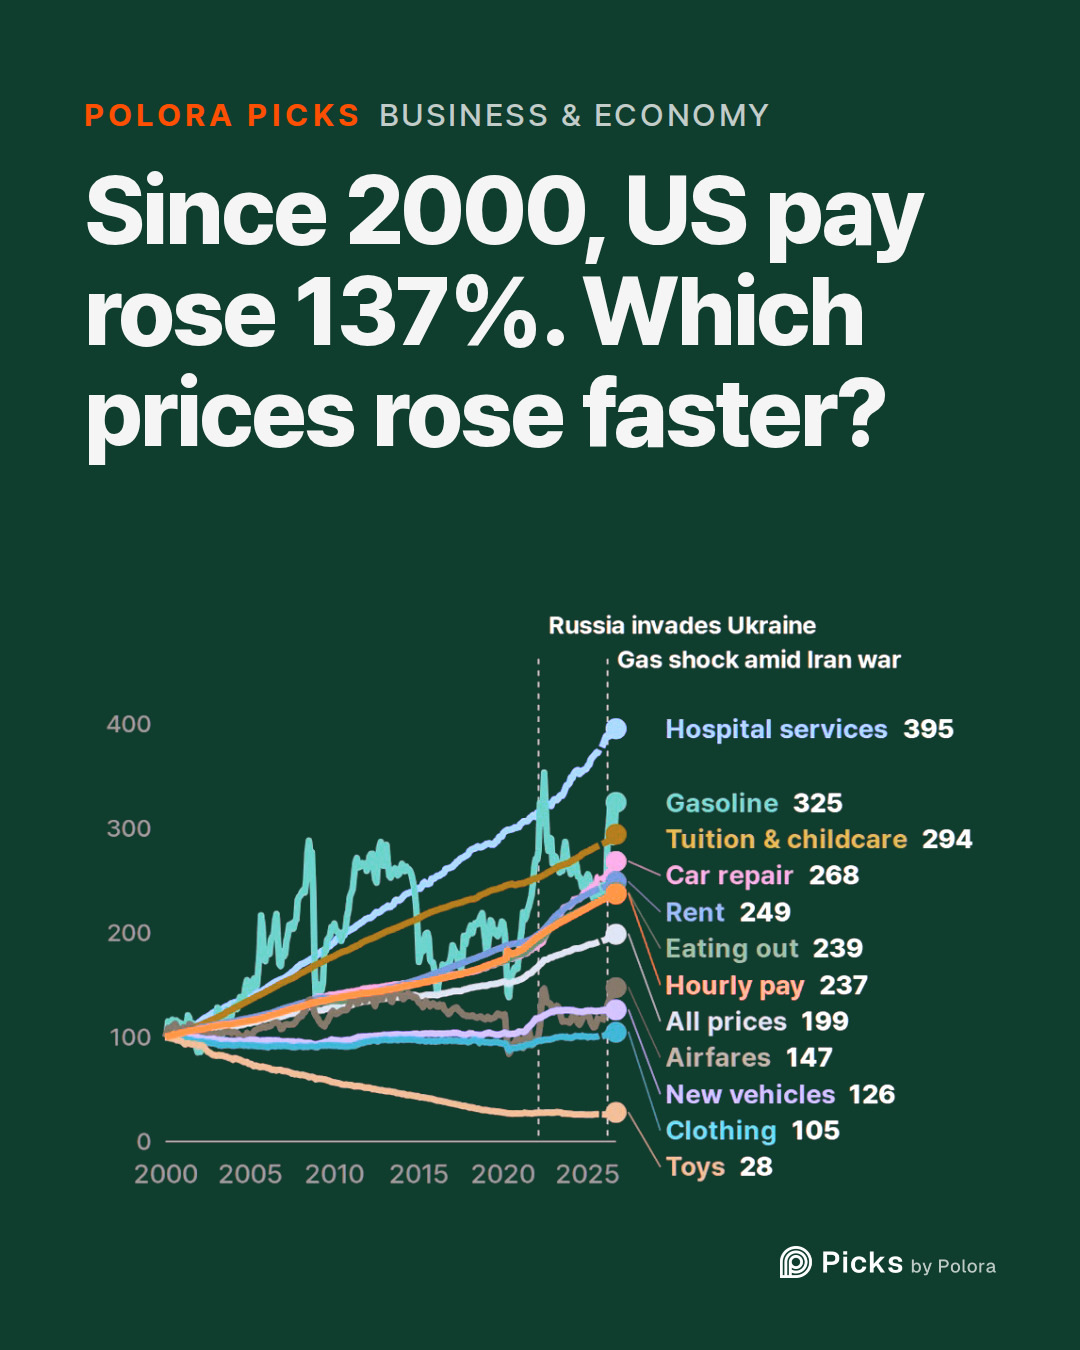
The film that comes with this piece puts every series at 100 in January 2000 and lets them run. That way it shows how much each one changed, not what it costs. Pay is one of the lines, but it is not a price. It is the line every price is measured against. A price line that ends above pay got more expensive faster than pay grew, and one that ends below it got relatively cheaper.
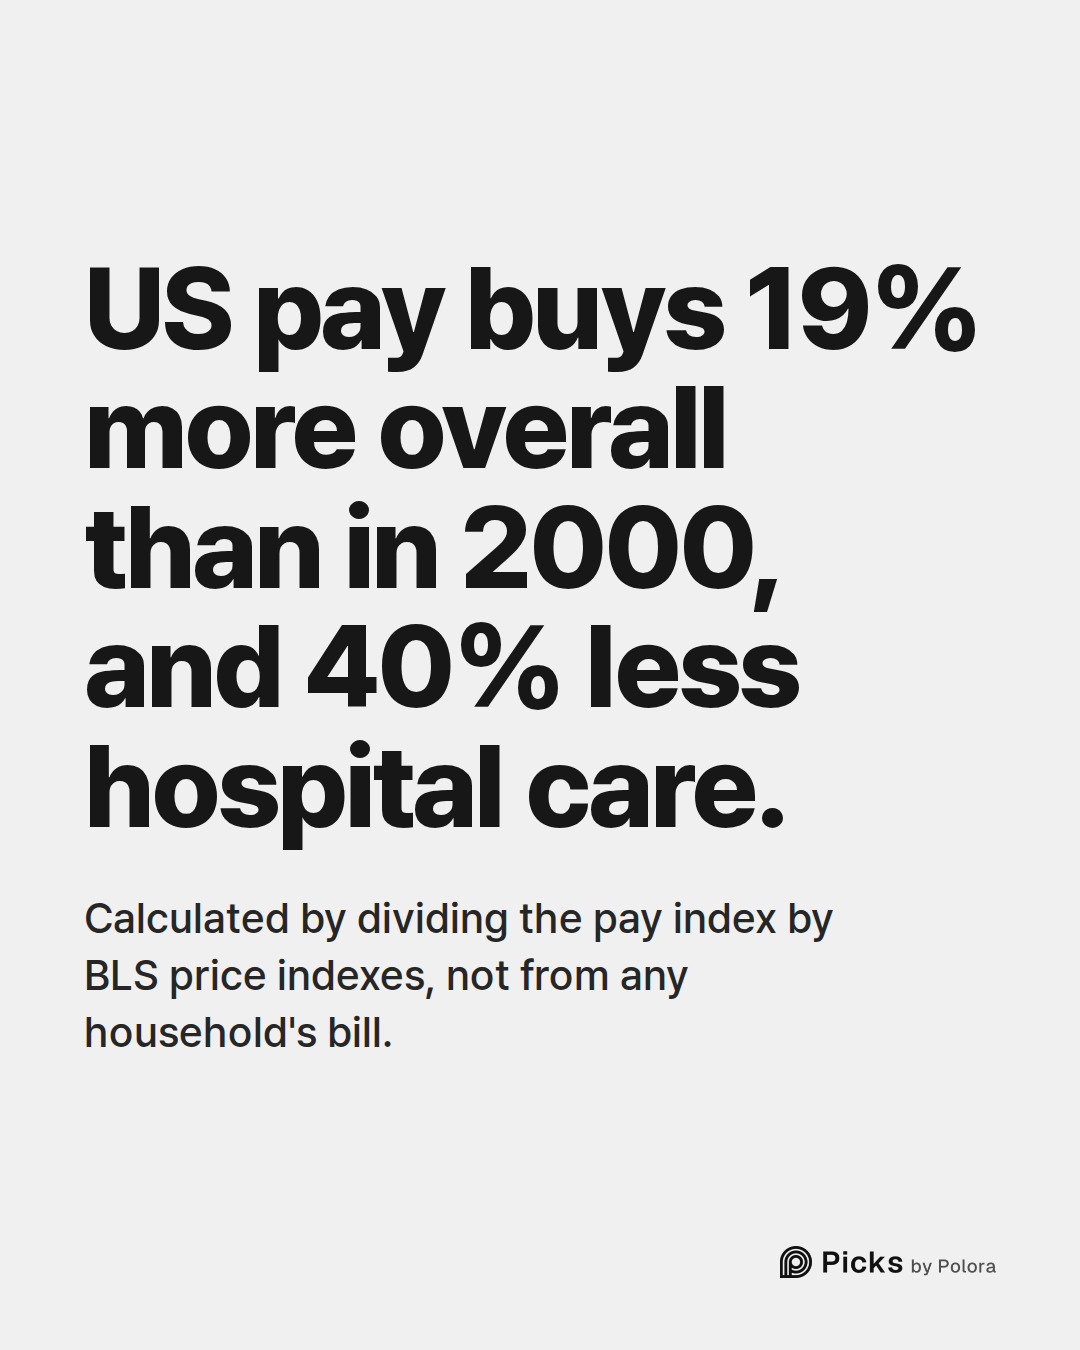
Overall, the pay index beat the price index. Divide the pay index by the all-items price index, and average pay in September 2026 bought 19% more of the whole basket than it did in 2000. After January 2000, the starting point, pay was ahead of overall prices in every month with data except March 2000, when it trailed by 0.2%.
Six lines that beat pay
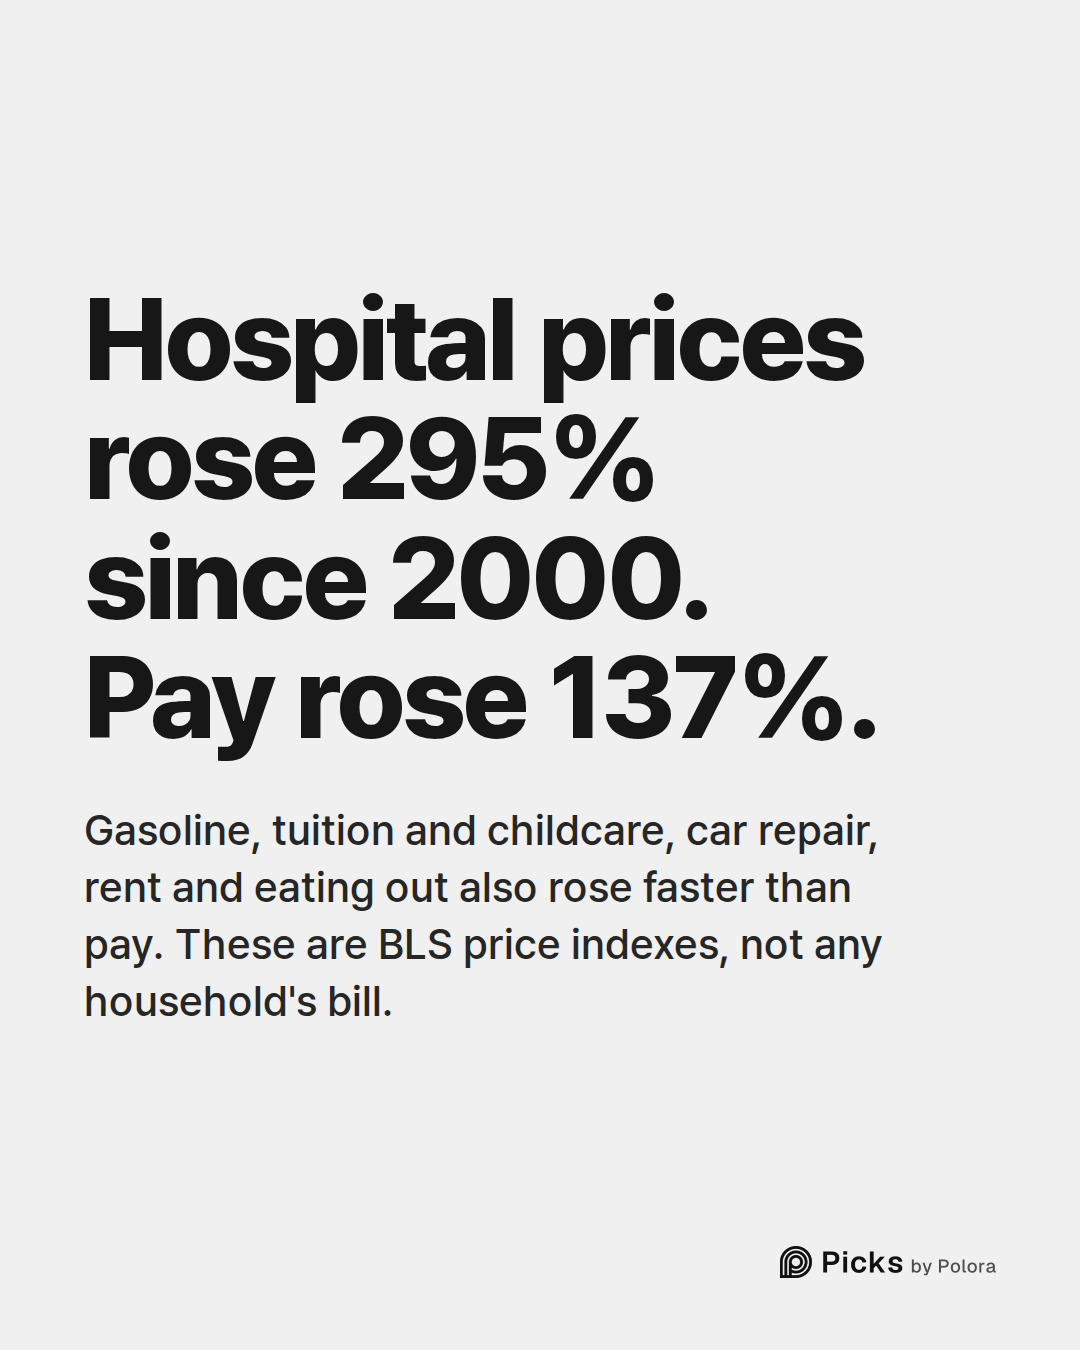
Six of the eleven price lines in the film rose faster than pay. Hospital and related services rose the most, by 295%, nearly four times their 2000 level. Tuition, other school fees and childcare, which the US Bureau of Labor Statistics (BLS) measures as one category, rose 194%. Car maintenance and repair rose 168%, rent of a primary residence 149%, and food away from home 139%. The sixth, gasoline, has a story of its own, told below. These are price indexes for each category, not any household's actual bill.
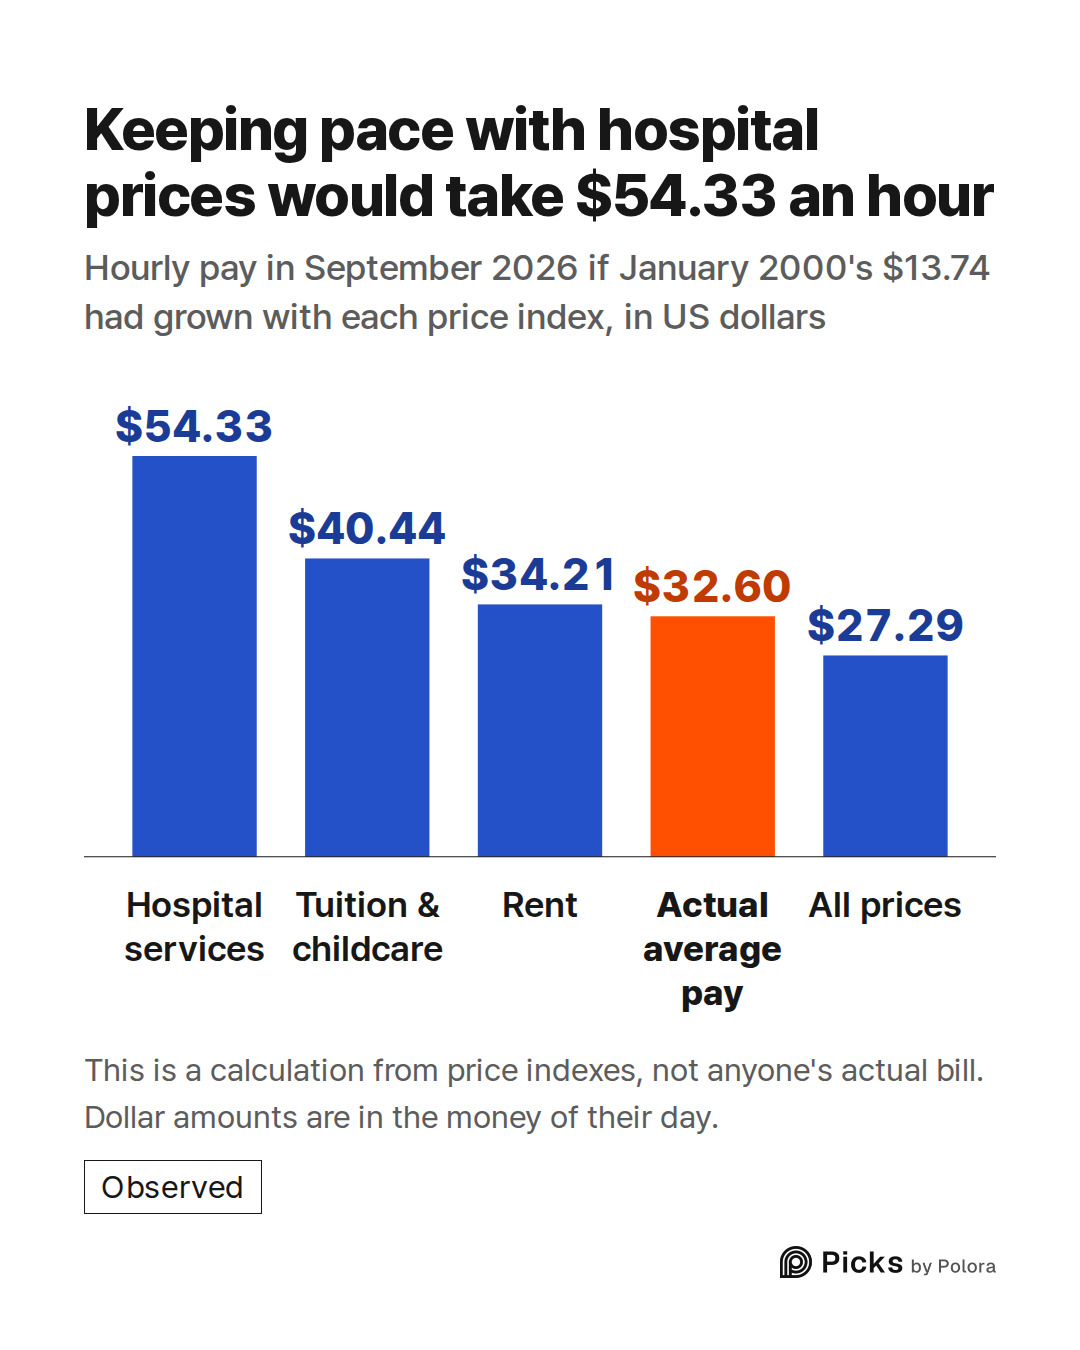
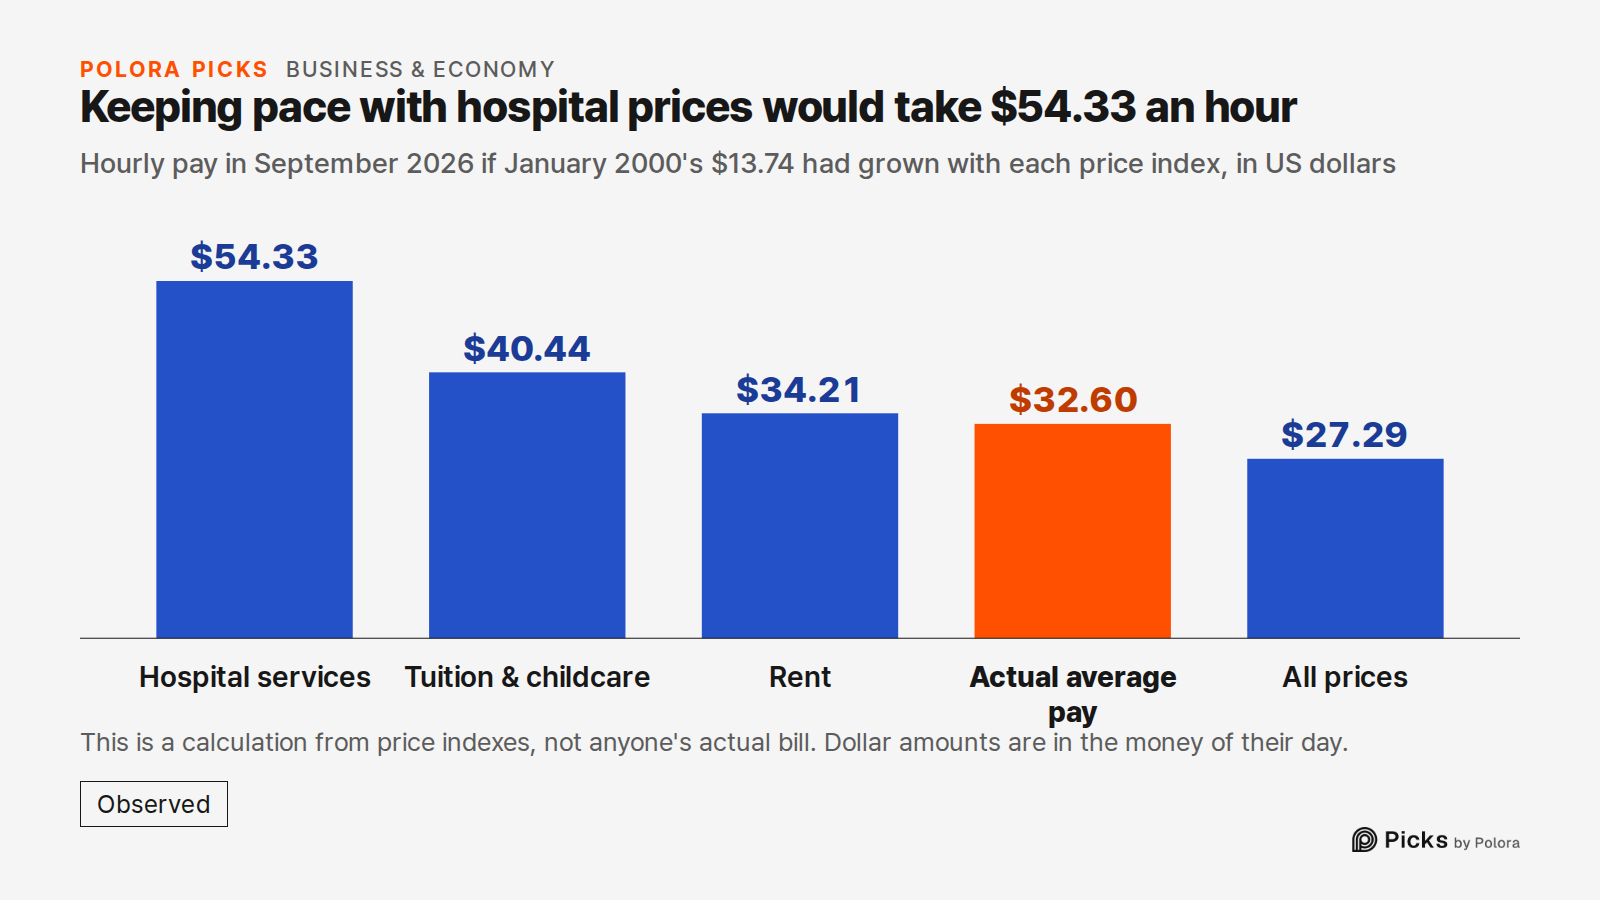
Here is another way to read those numbers. Pay that had grown only as fast as overall prices would be $27.29 an hour in September 2026. To keep pace with hospital services, it would have needed to reach $54.33. For tuition and childcare it would be $40.44, and for rent $34.21. Measured against hospital services, today's average pay buys 40% less than in 2000. Against tuition and childcare, it buys 19% less.
Hospital services and tuition and childcare moved above the pay line in the first months of 2000 and have stayed above it in every month with data since. Rent took a detour. It slipped under pay in February 2010, crossed back in 2012, and has been above it in every month with data since May 2012. Car repair has been above pay since September 2022.
Gasoline, the line that swings
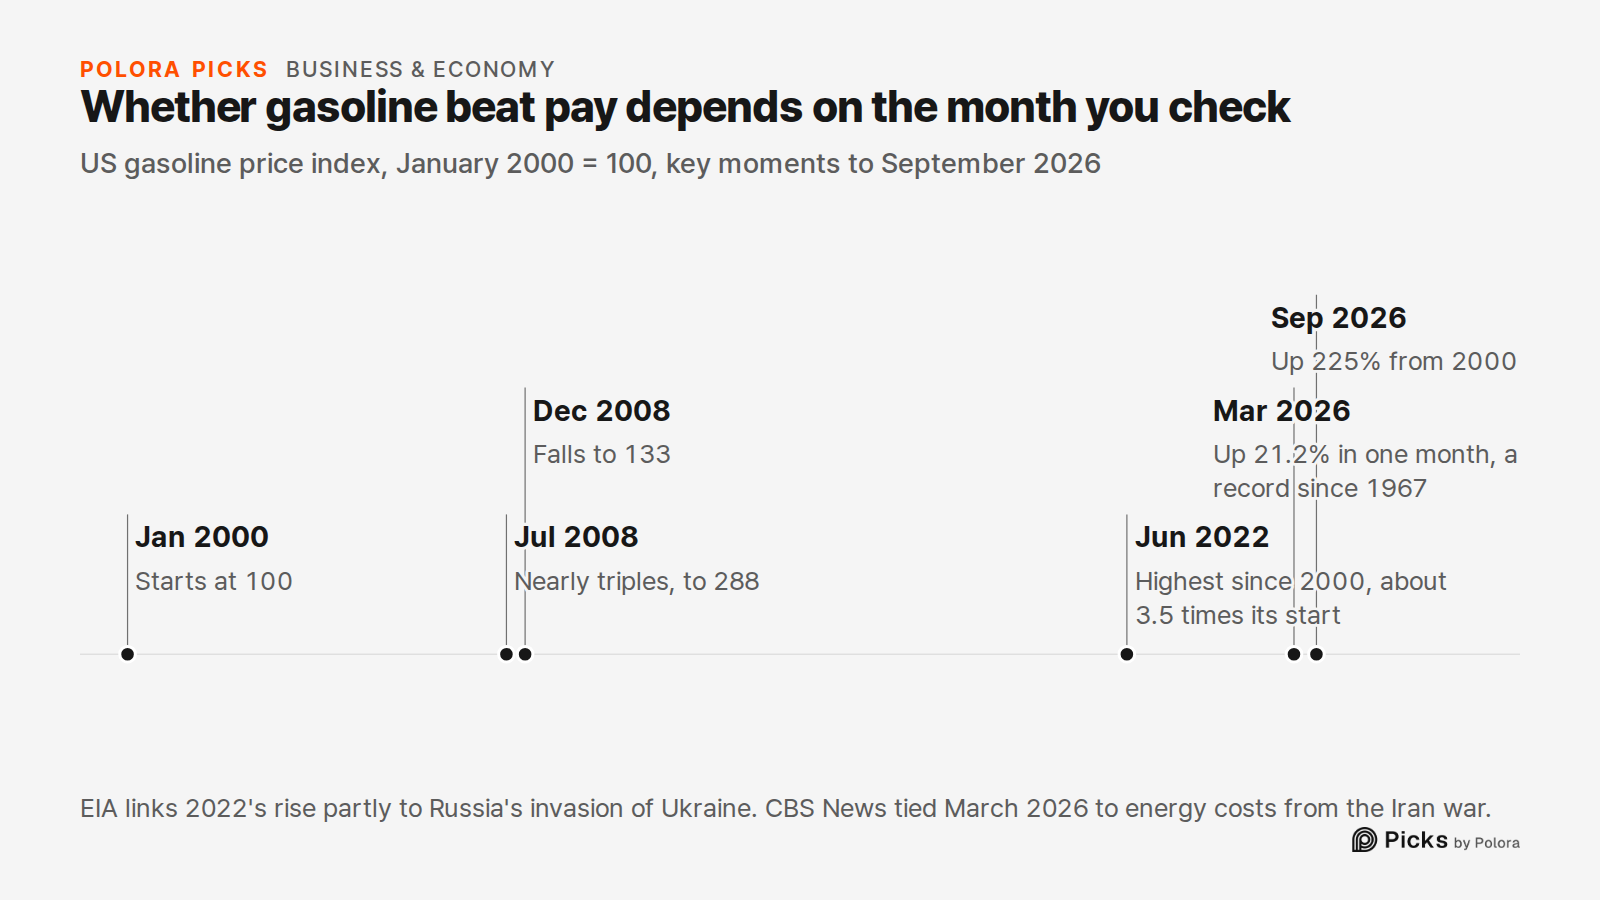
Gasoline also ends September 2026 above pay, up 225% from its 2000 level, but its position depends on when you look. It nearly tripled by July 2008, reaching 288 on the 2000 = 100 scale, then fell to 133 by December. It fell again in 2020. In June 2022 it reached its highest level since 2000, about 3.5 times its starting point. The US Energy Information Administration (EIA) says Russia's full-scale invasion of Ukraine in late February 2022 contributed to rising crude oil prices that year. EIA also points to low gasoline inventories and refinery conditions behind that year's higher pump prices. Gasoline has stayed above the pay line since January 2021.
In March 2026 the gasoline index jumped 21.2% in a single month. BLS called it the largest monthly increase since the series was first published in 1967. CBS News reported that inflation ran hot that month because of higher energy costs tied to the Iran war, which began on February 28 and constrained the flow of crude through the Strait of Hormuz.
The lines that went the other way
Not everything outran pay. Airfares rose 47% and new vehicles 26%. Clothing ended September 2026 just 5% above its 2000 level, and in December 2019 it was still 6% below. Toys fell 72%, and the toy index was already 72% below its 2000 level by 2019. Divide the pay index by the toy index, and average pay now buys 8.5 times as many toys as in 2000, measured the way BLS measures them, not by counting purchases.
The Consumer Price Index tries to follow the price of the same thing over time. When a product is replaced by a better version, BLS separates the part of the price change that comes from the improvement, so a better product at the same price counts as cheaper. For many clothing items it does this with statistical "hedonic" models, and for new vehicles with cost-based adjustments. BLS's current list shows no special adjustment method for toys, games and hobbies. So the sources here don't show that quality adjustment explains the toy line, and they don't say why toy prices fell.
What the pay line is, and isn't
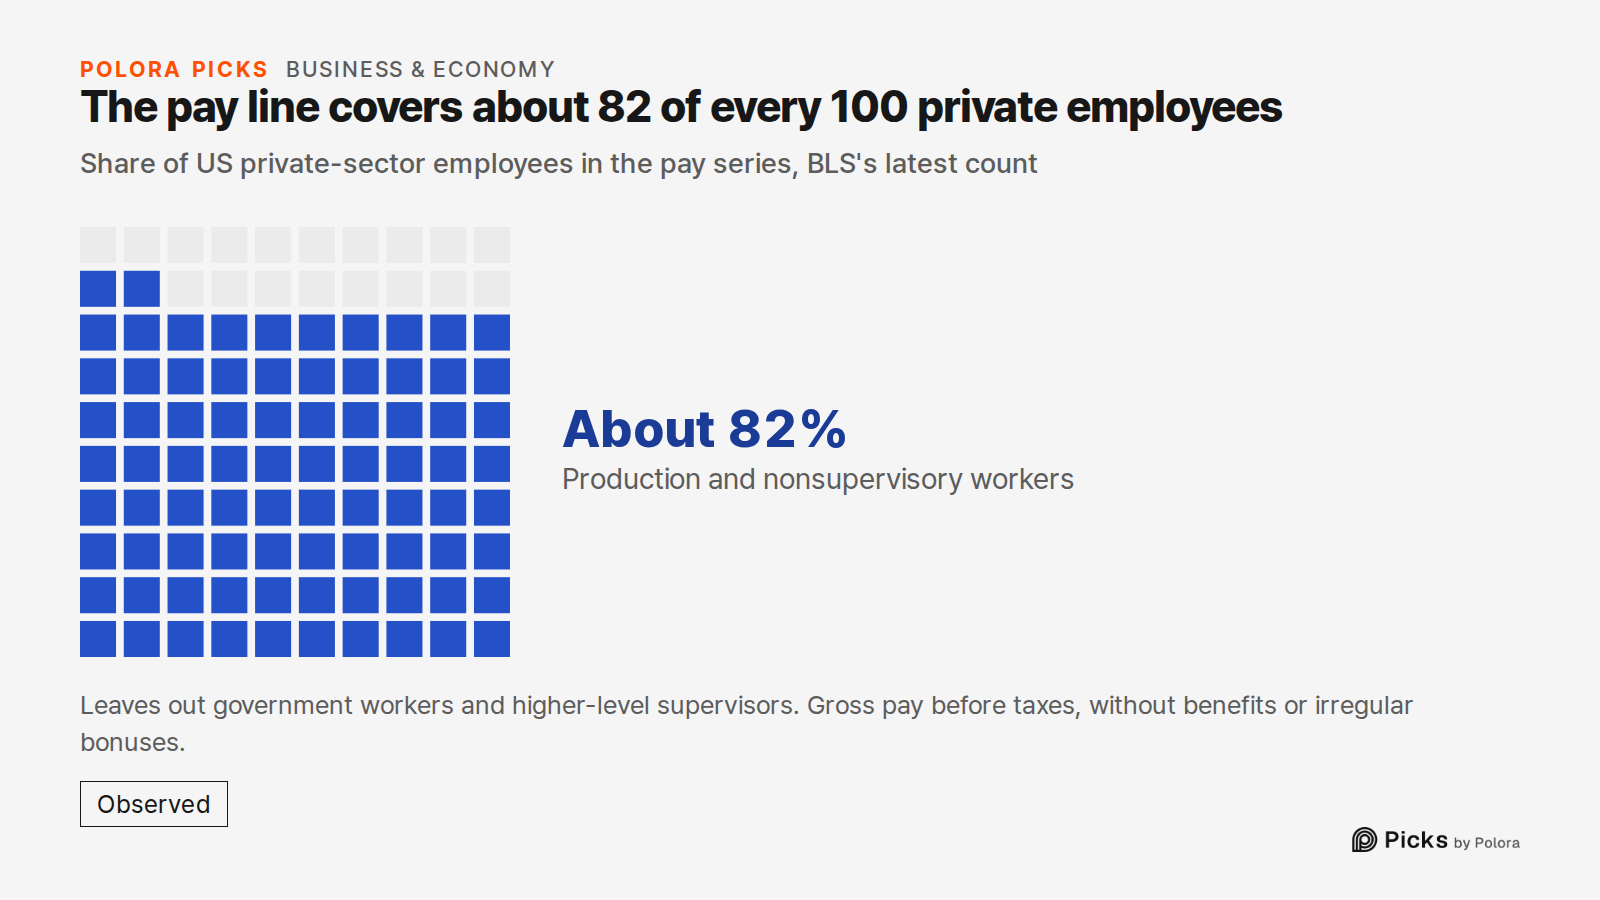
The pay series is average hourly earnings of production and nonsupervisory employees on private payrolls. BLS defines these as workers in goods industries who do production work, and workers in service industries who are not above the working-supervisor level. That group makes up about 82% of private employees in BLS's latest count. The series leaves out government workers, as well as managers and supervisors above the working-supervisor level. It is gross pay before taxes, and it excludes benefits and irregular bonuses.
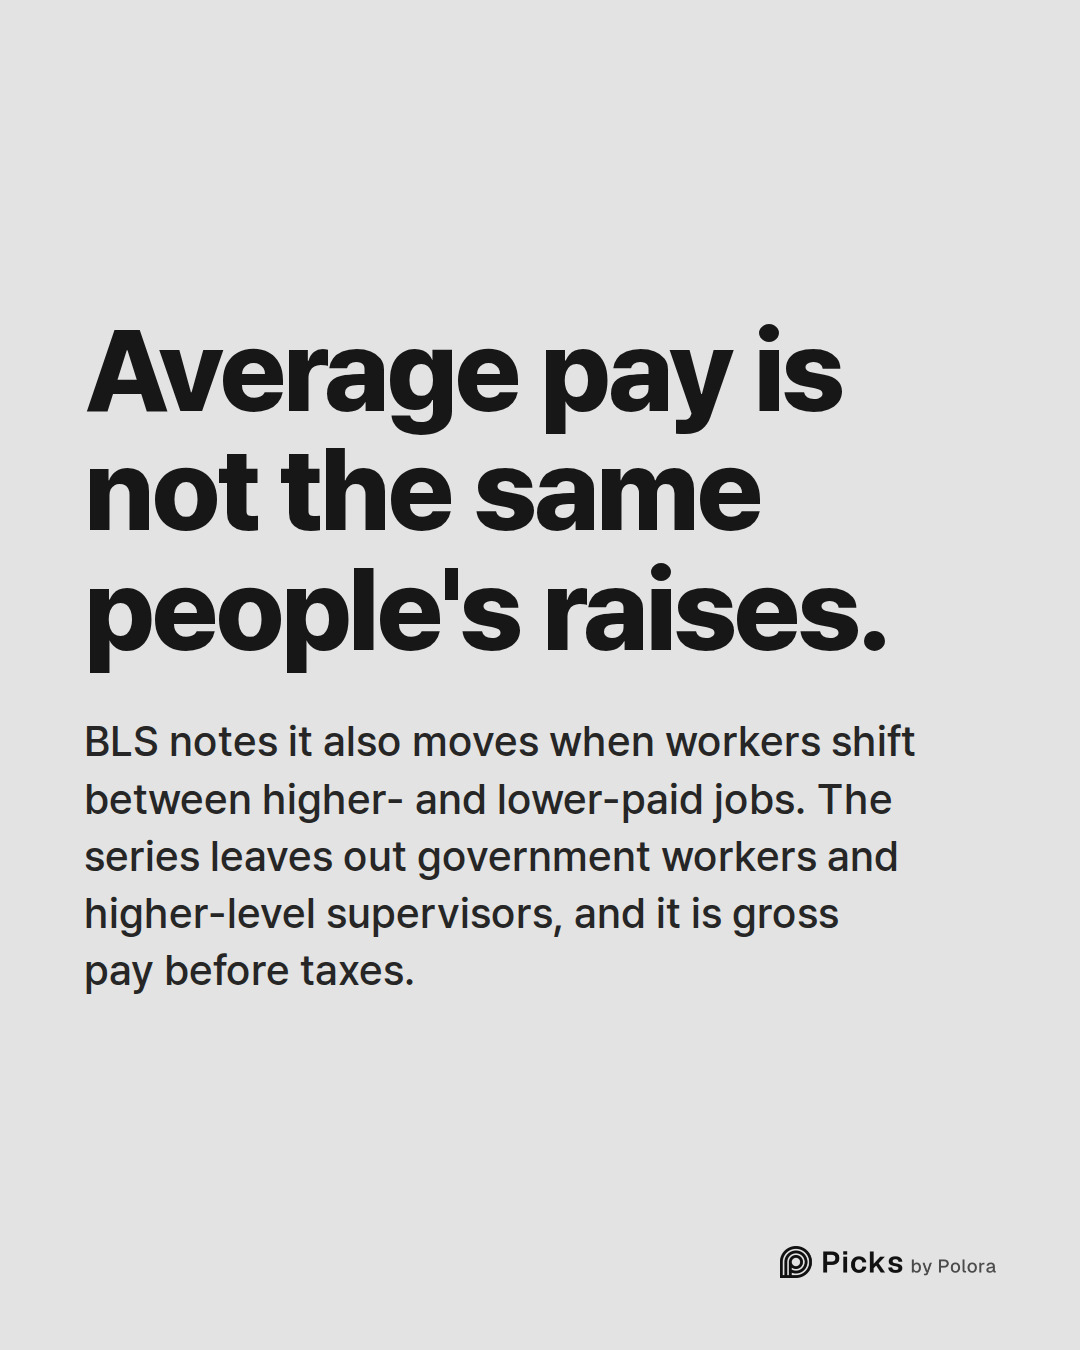
Because it is an average, BLS notes, it also moves when workers shift between higher- and lower-paid jobs, not only when people get raises. In April 2020 this series jumped 4.2% in one month, from $24.12 to $25.14. Writing about a different measure, inflation-adjusted pay for all private employees over the year to April 2020, BLS said that rise largely reflected the loss of lower-paid jobs. It did not say how much of this particular jump that explains. So a price line ending above or below pay compares a price index with an average of earnings, not the pay of the same people over more than 26 years.
Two smaller caveats. The federal government shutdown meant BLS could not collect its usual price survey for October 2025. BLS published no October 2025 value for most of these items, and the lines here leave that month empty. Gasoline and new vehicles do have an October 2025 value. And seasonally adjusted figures can still be revised, for example when BLS updates its seasonal factors.
How this was made
Every series comes from the US Bureau of Labor Statistics, through the Federal Reserve Bank of St. Louis's FRED database. All are monthly and seasonally adjusted, from January 2000 to September 2026. Each series was divided by its January 2000 value and multiplied by 100. The "buys more" and "buys less" figures divide the pay index by a price index. The "pay that would have kept pace" figures multiply January 2000's $13.74 by each price index's change. Dollar amounts are in the money of their day. The only adjustment for prices is the comparison with the price indexes themselves.
- [US Bureau of Labor Statistics, average hourly earnings of production and nonsupervisory employees, total private (via FRED)]
- [US Bureau of Labor Statistics, Consumer Price Index for all urban consumers, all items and item indexes (via FRED)]
- [BLS, Consumer Price Index news release, March 2026]
- [CBS News, CPI report shows inflation surged in March as Iran war drove up energy costs]
- [US Energy Information Administration, U.S. retail gasoline prices rose in summer but ended 2022 lower than start of 2022]
- [BLS, Quality adjustment in the CPI]
- [BLS, Frequently asked questions about hedonic quality adjustment in the CPI]
- [BLS, Current Employment Statistics: concepts]