Two sportswear brands, swapped
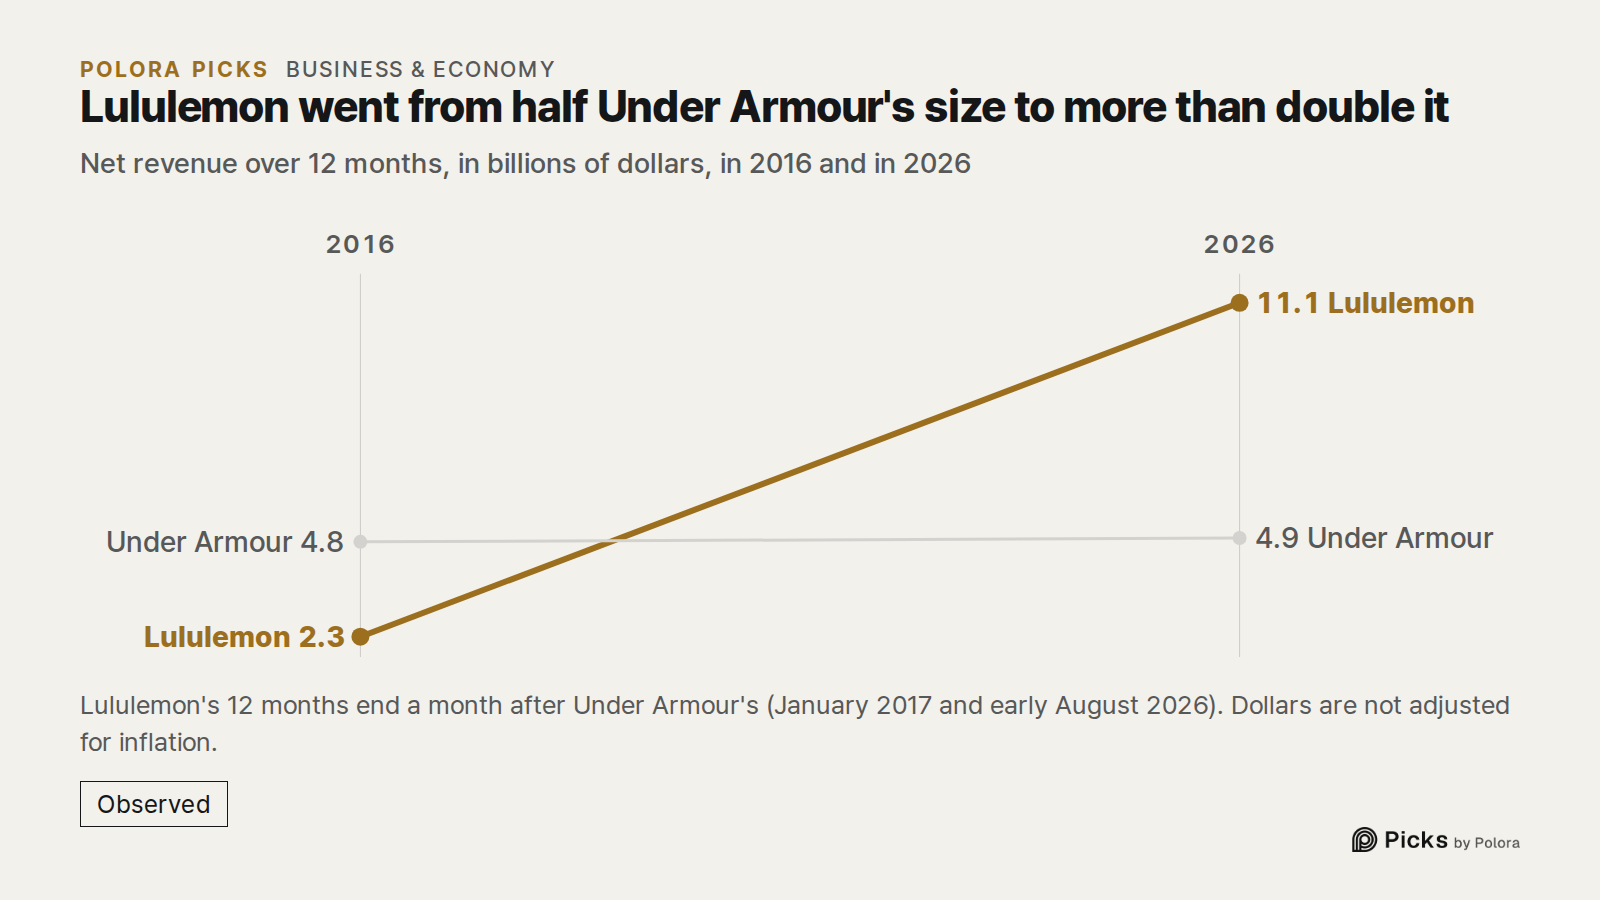
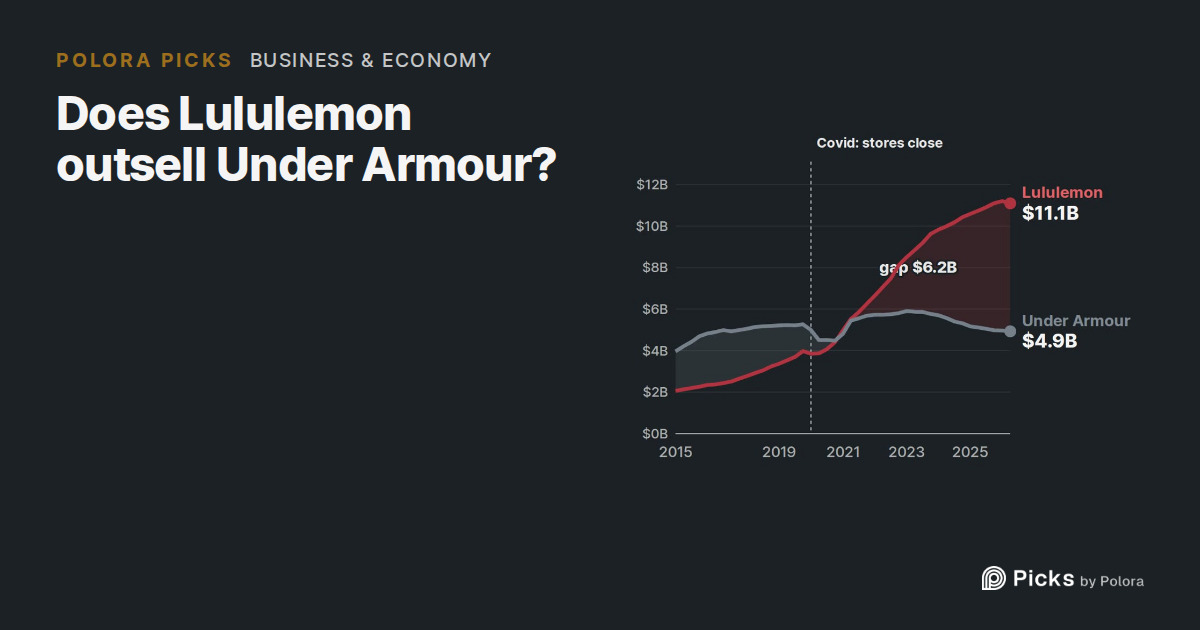
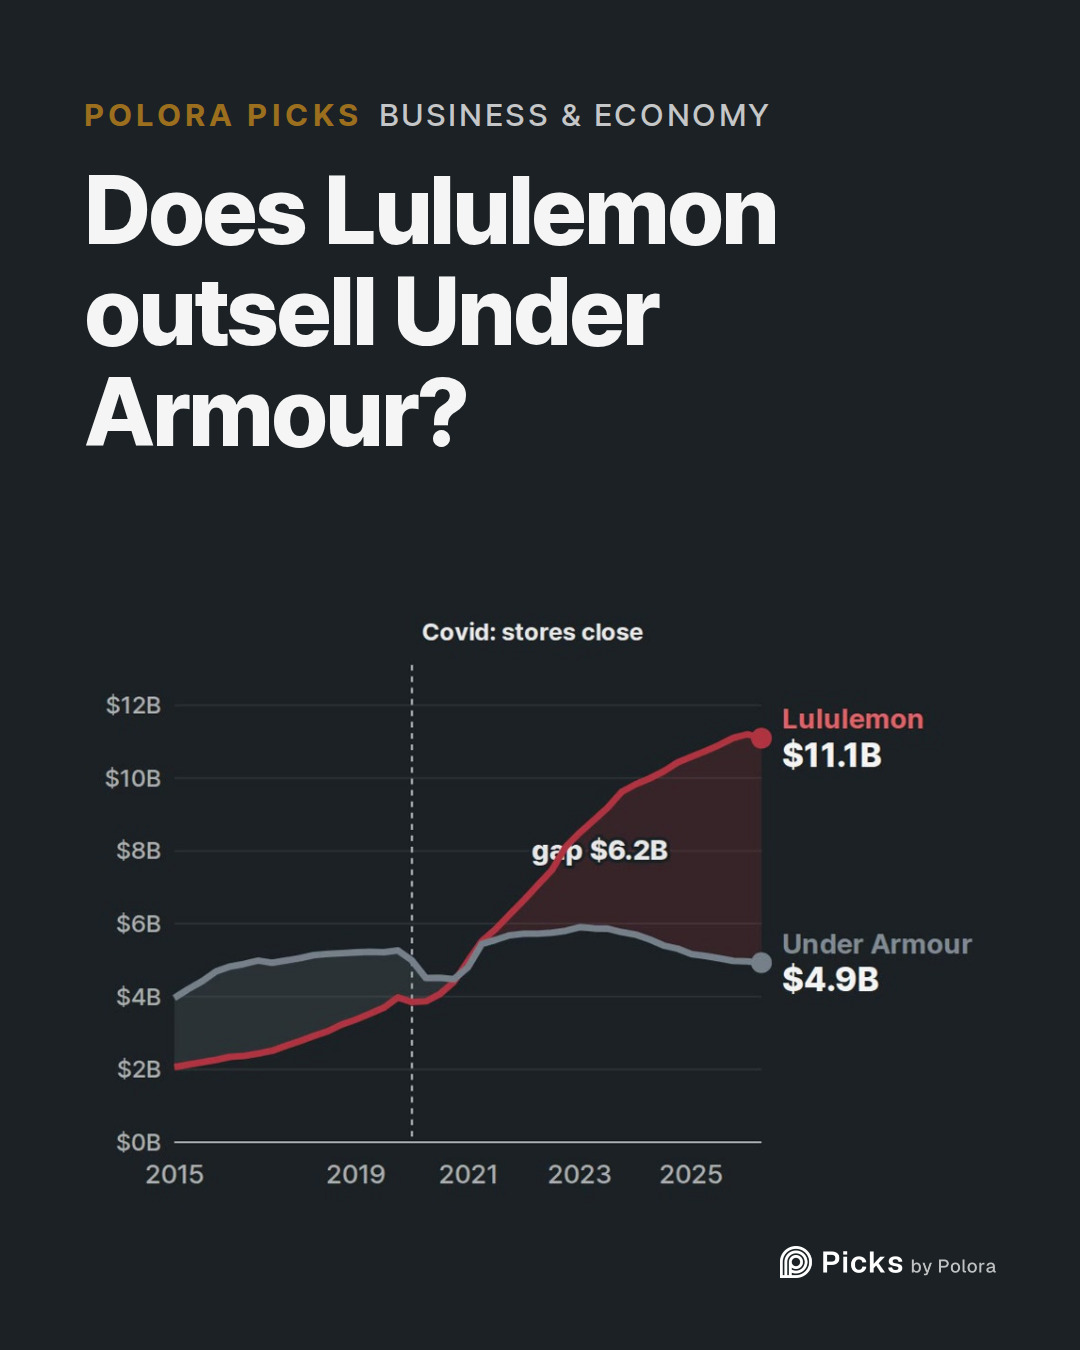
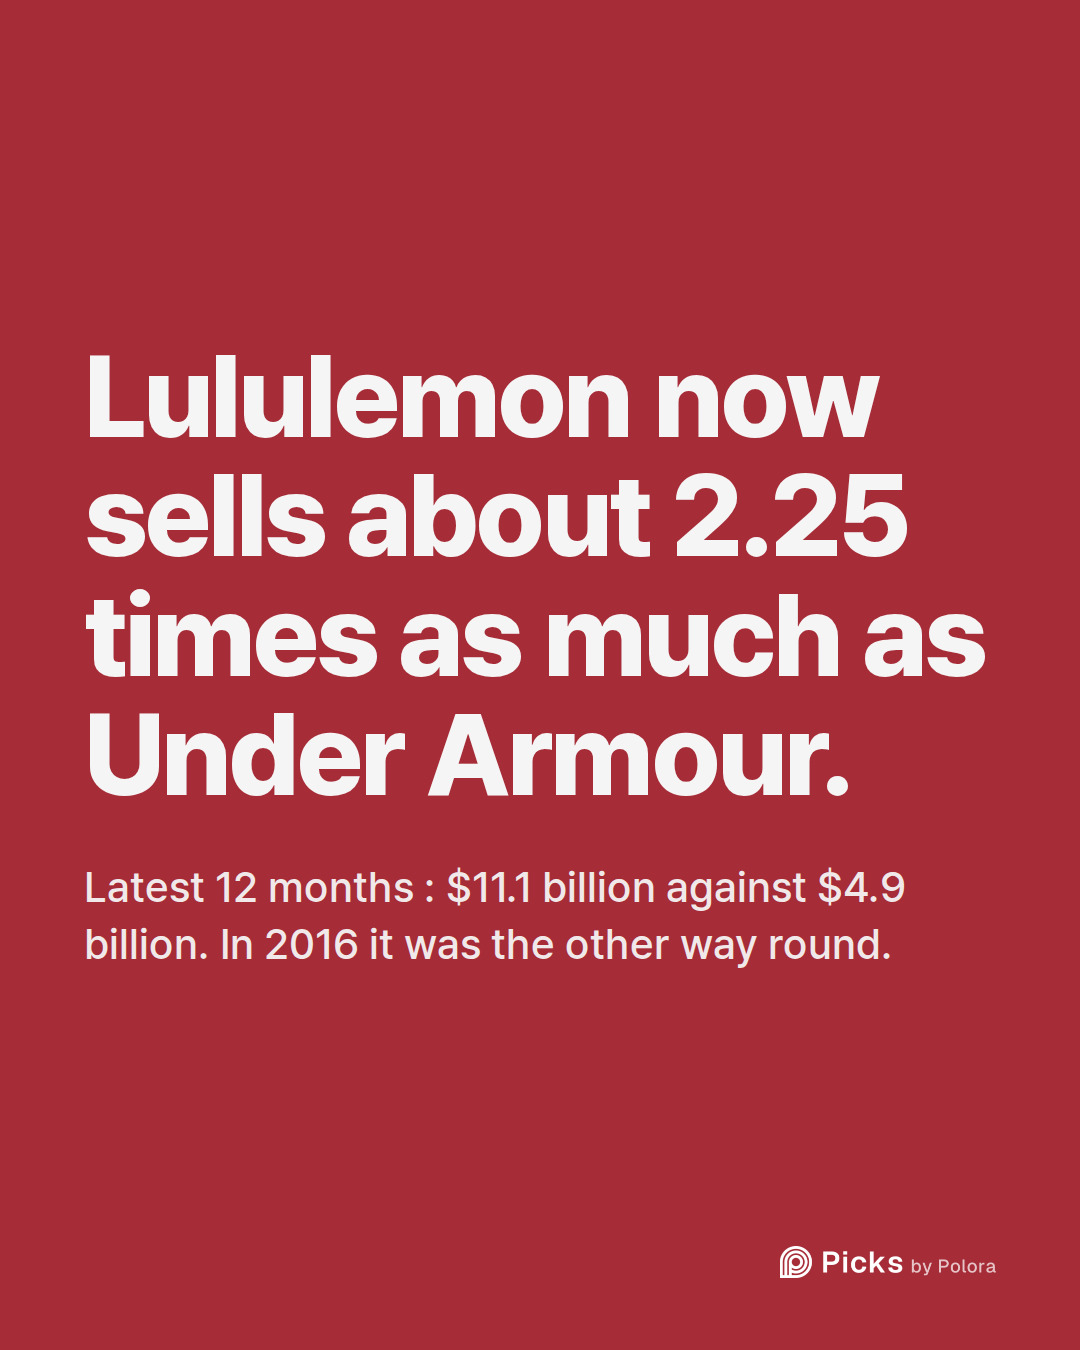
Ten years ago, Under Armour outsold Lululemon by a wide margin. In the 12 months to December 2016 it had $4.8 billion in sales. Lululemon had $2.3 billion in its fiscal year to January 2017. Today the order is reversed. Over its latest 12 months, which end in early August 2026, Lululemon sold $11.1 billion. Under Armour sold $4.9 billion over the 12 months to June 2026, the period that lines up with Lululemon's. That makes Lululemon's sales about 2.25 times Under Armour's.
The years when one stood still
From the end of 2016 to the end of 2019, Under Armour's 12-month sales barely moved, staying between about $4.8 billion and $5.3 billion. Over the same stretch Lululemon's 12-month sales rose every quarter, from $2.3 billion in the year to January 2017 to $4.0 billion in the year to early February 2020. The gap was already closing before the pandemic.
The pandemic, and the crossing
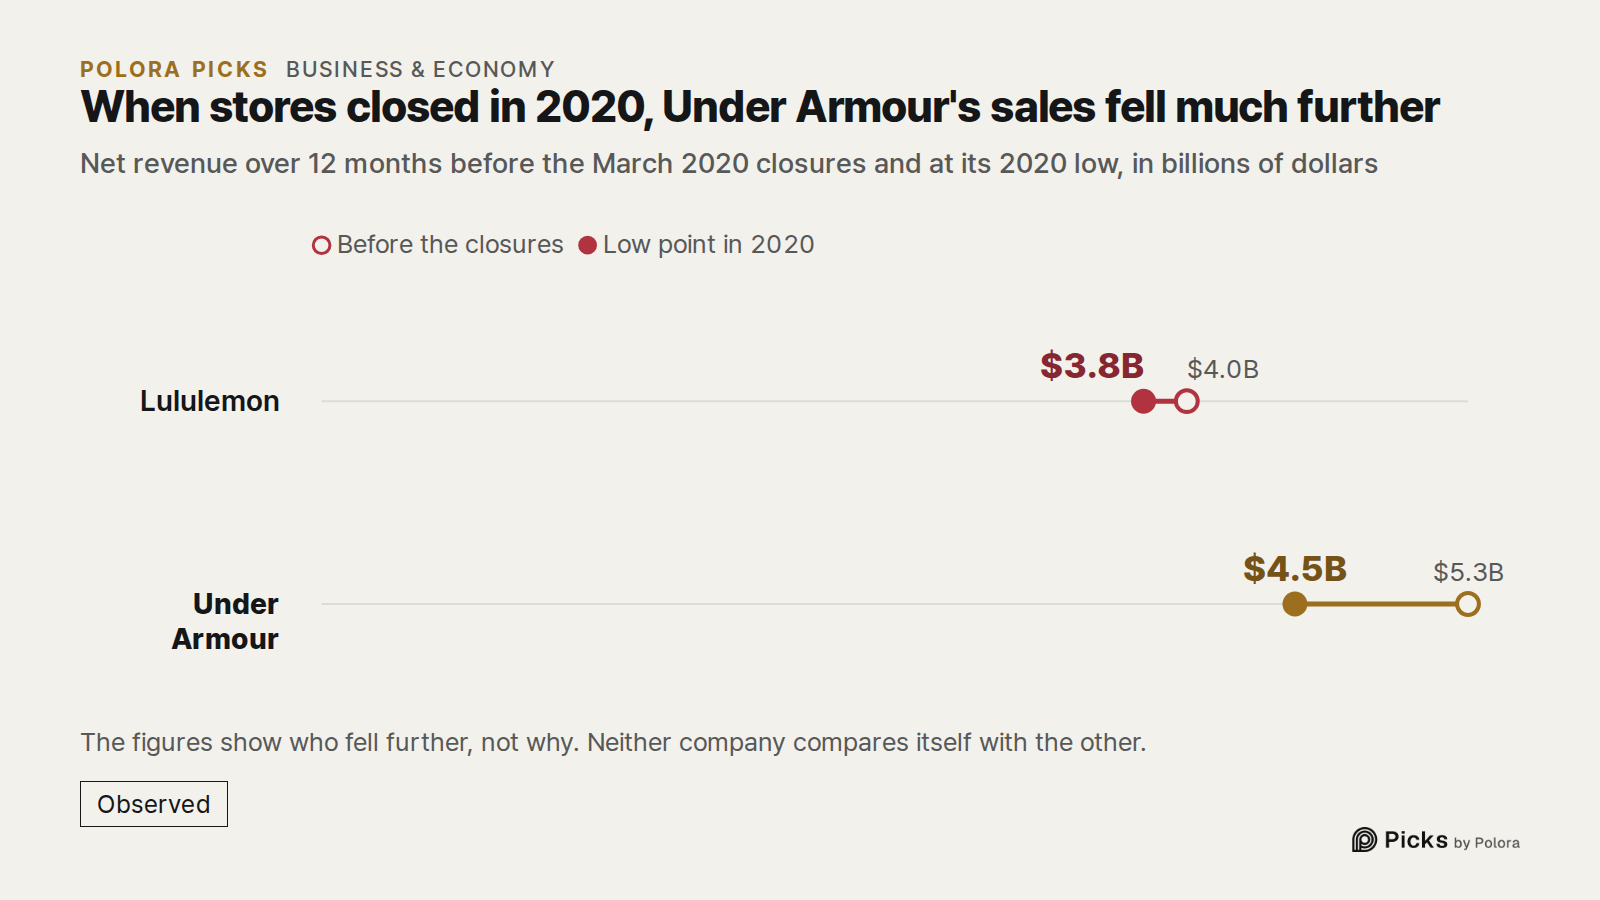
In March 2020 both companies closed their stores in North America, as each says in its report for that quarter. Both lost sales, but not equally. Lululemon's 12-month sales slipped from $4.0 billion to $3.8 billion and were back up to $4.4 billion in the 12 months to January 2021. Under Armour's fell from $5.3 billion to $4.5 billion and stayed there through the end of 2020. In the same report, Under Armour said many of the retailers that stock its products had closed too, which delayed or cancelled their orders. Neither company compares itself with the other, so the figures show who fell further, not why.
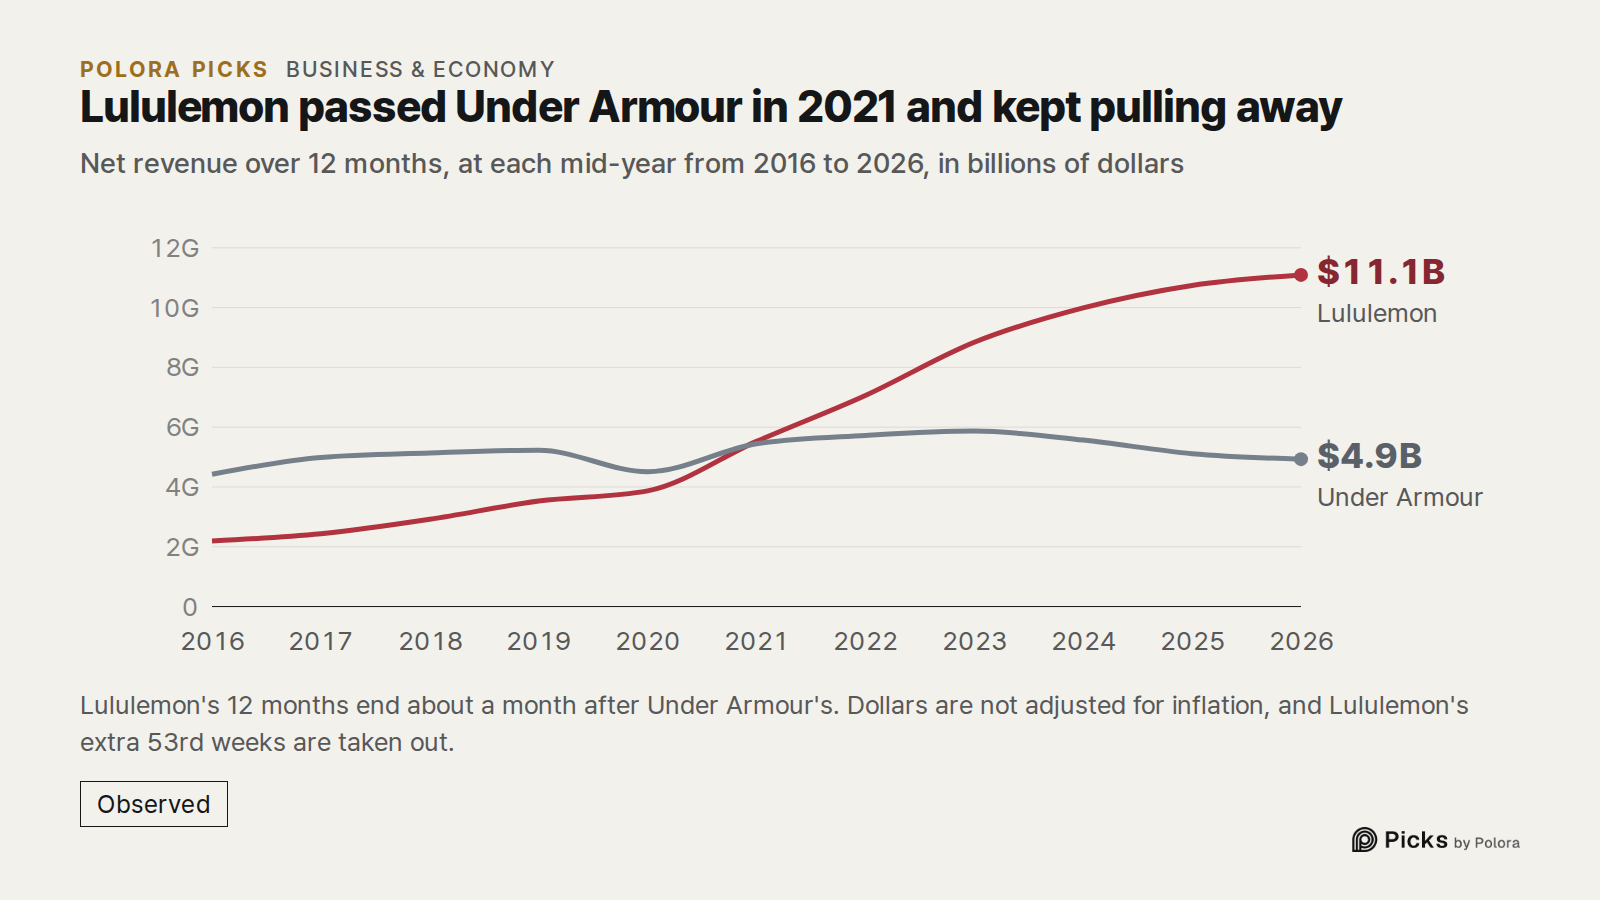
Lululemon recovered first. In the 12 months that ended in the spring of 2021 it sold $4.98 billion, against Under Armour's $4.80 billion, and it has stayed ahead at every quarter since.
Under Armour's peak, Lululemon's run
Under Armour also recovered, and its sales peaked at $5.9 billion in the 12 months to March 2023. That figure is in dollars of the day, not adjusted for inflation, so it is a high point in dollars and not necessarily in what those dollars could buy. Since then its sales have shrunk year after year. Lululemon kept growing. Its 12-month sales passed $10 billion in 2024, reaching $10.2 billion in the year to late October, and kept rising into 2026. The two had swapped places : in 2016 Under Armour's sales were about twice Lululemon's, and by 2025 Lululemon's were more than twice Under Armour's.
Lululemon's first sales drop since the pandemic
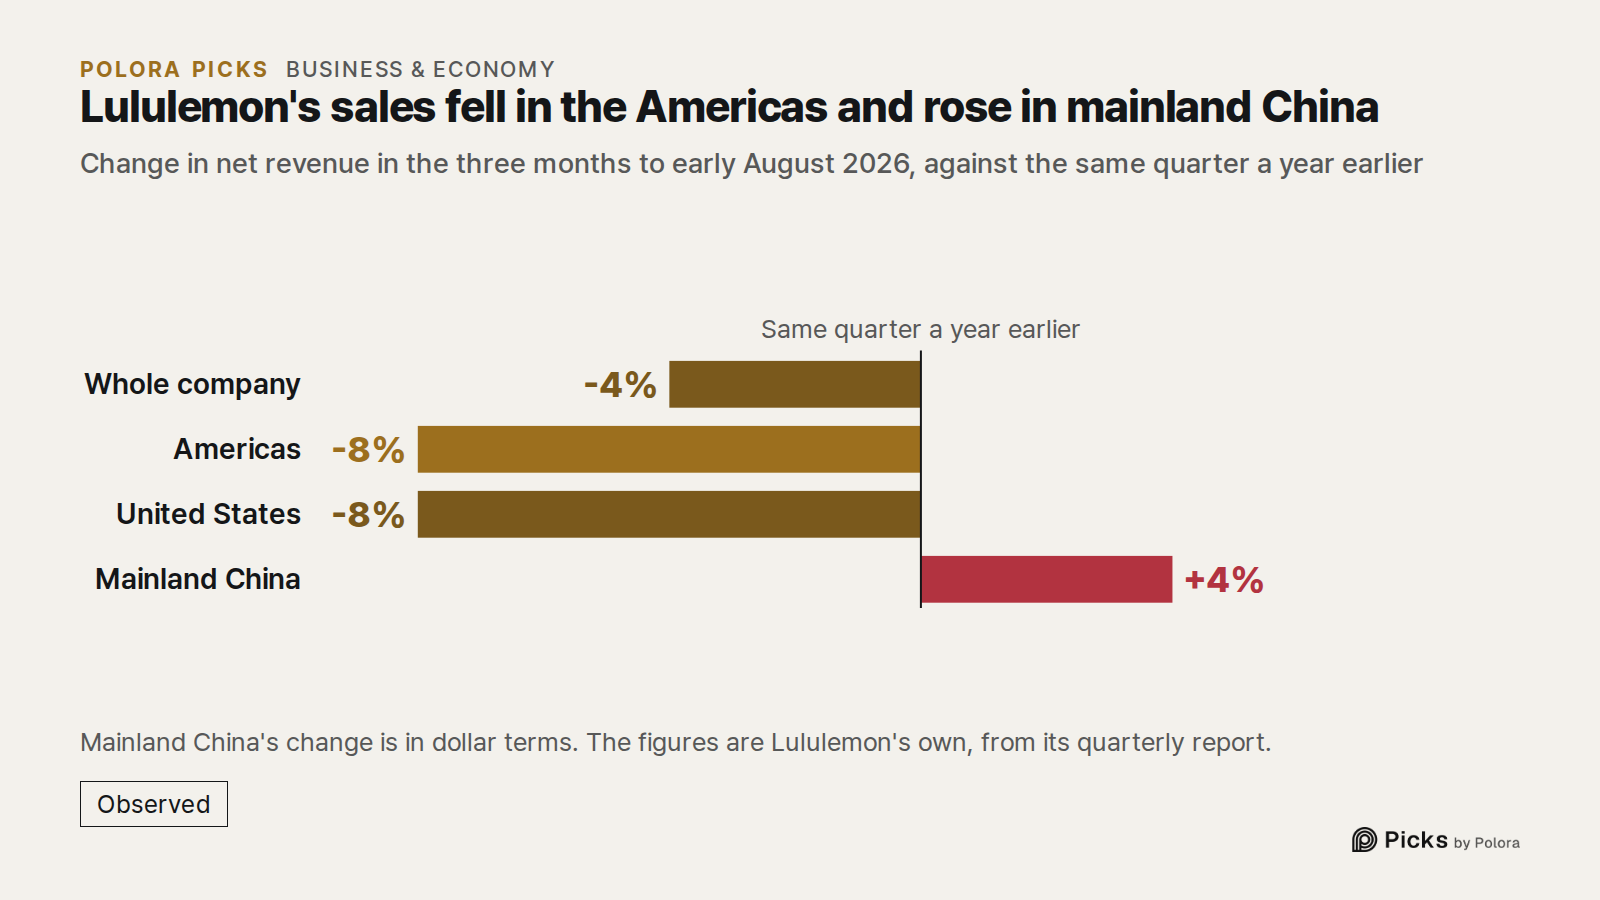
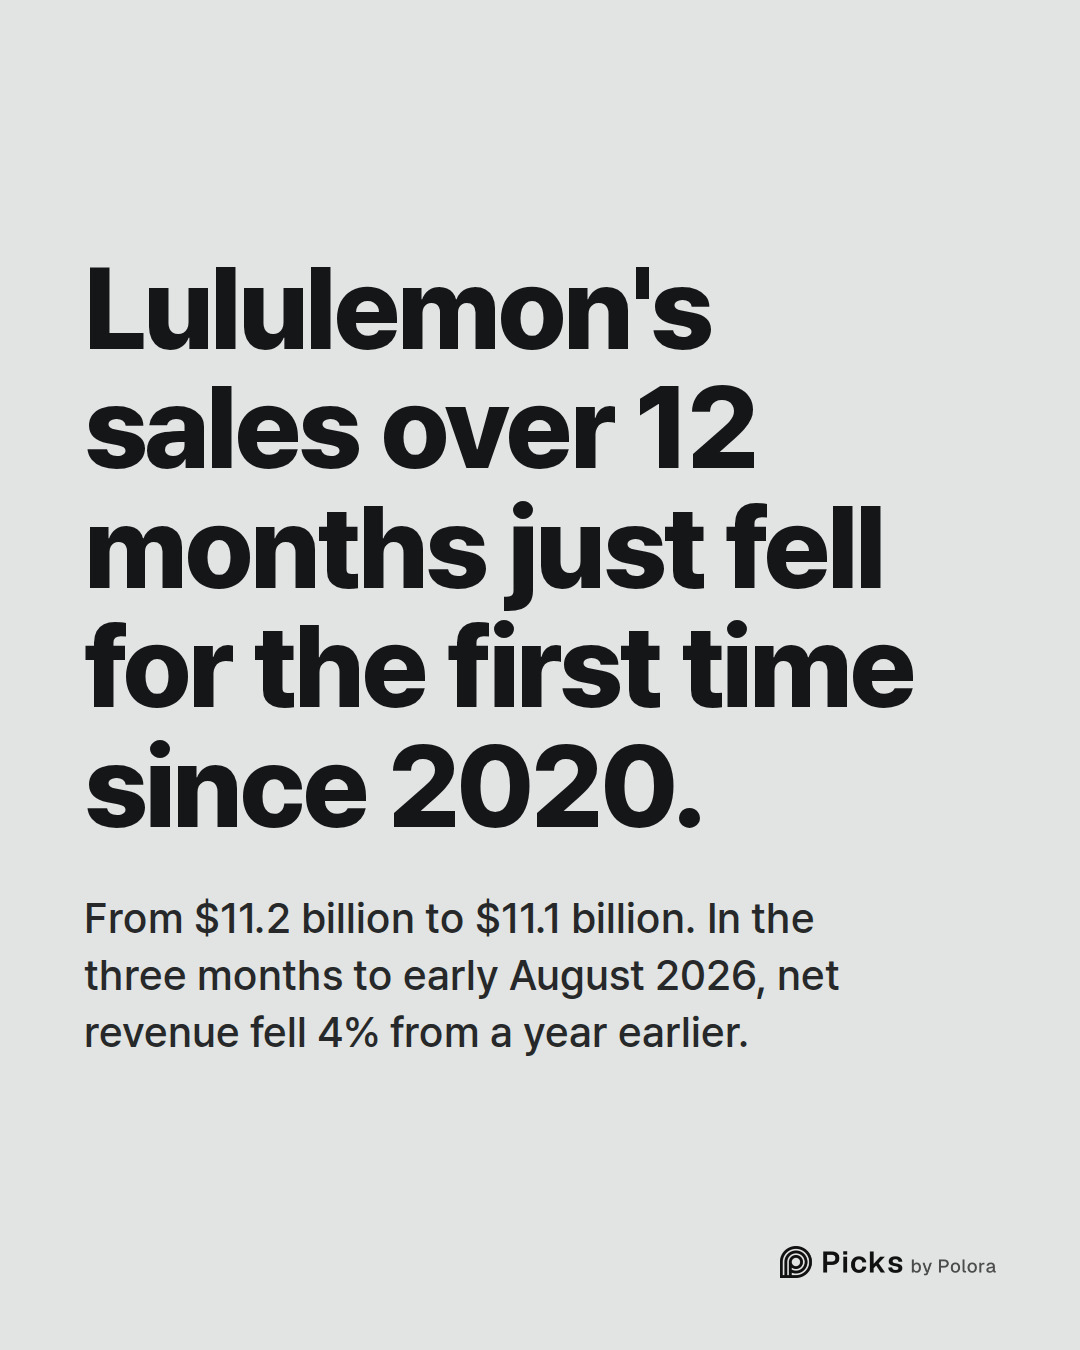
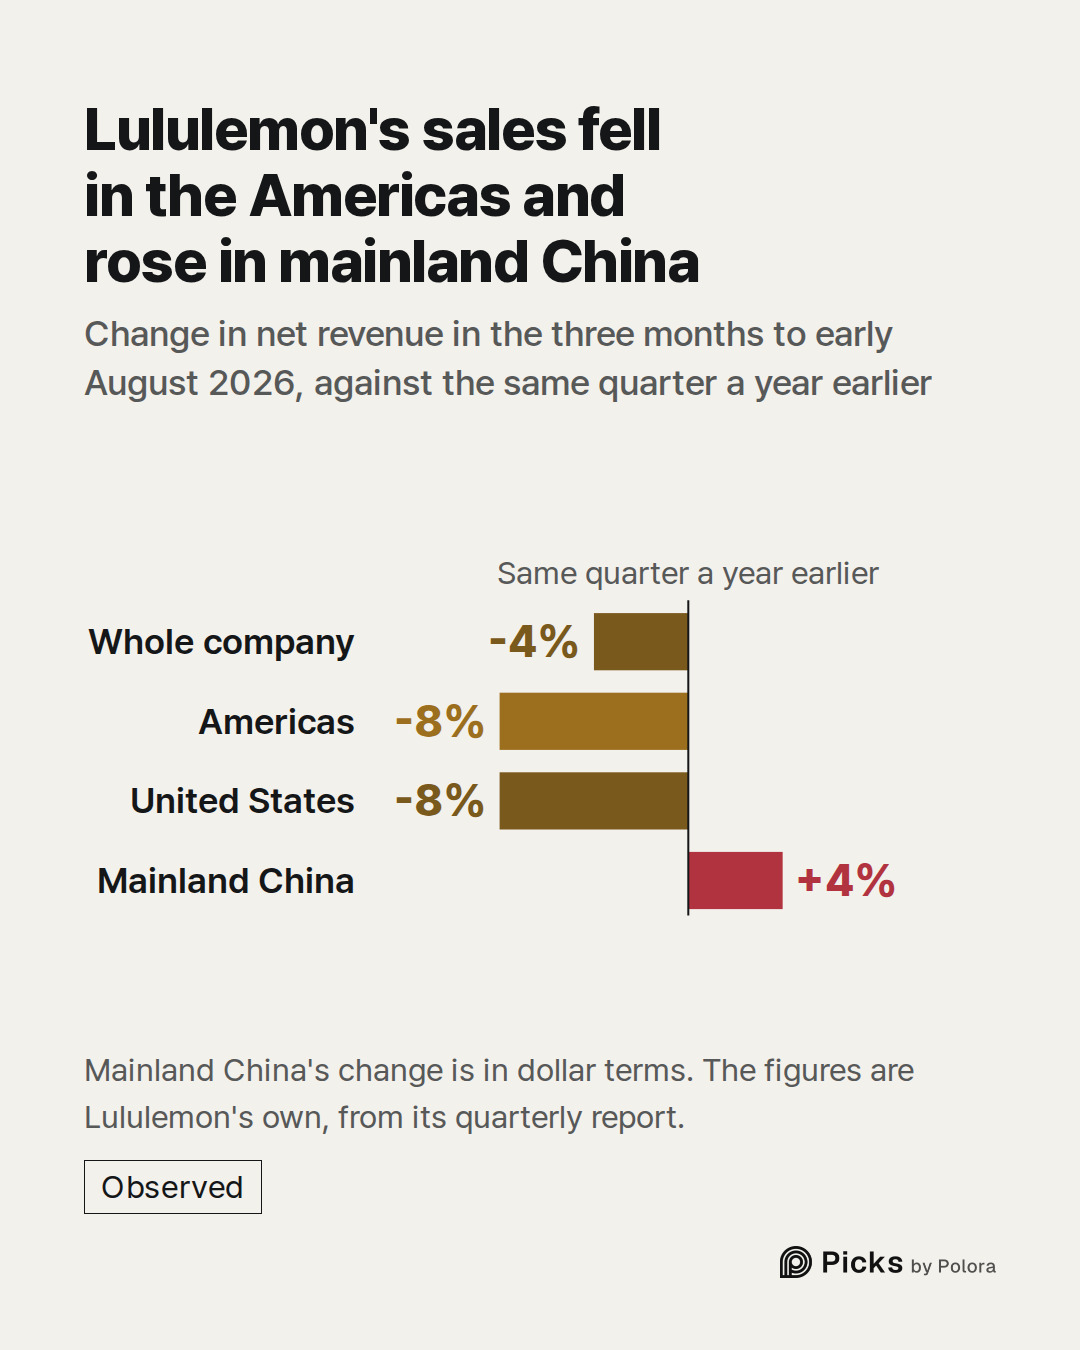
Lululemon's 12-month sales peaked at $11.2 billion in the year to early May 2026. Three months later they were $11.1 billion, the first drop in the 12-month total since 2020. That is a small dip on a yearly scale, and it comes from a single quarter : in the three months to early August 2026, net revenue fell 4% from a year earlier.
Lululemon's quarterly report puts the fall on one region : the decrease was "primarily due to decreased Americas net revenue". Compared with the same quarter a year earlier, sales in the Americas fell 8%, and in the United States alone they also fell 8%, while sales in mainland China rose 4% in dollar terms. To explain the Americas, the company reports fewer shoppers coming in, a smaller share of them buying, and smaller orders on average. It says it has started an action plan to get sales there growing again.
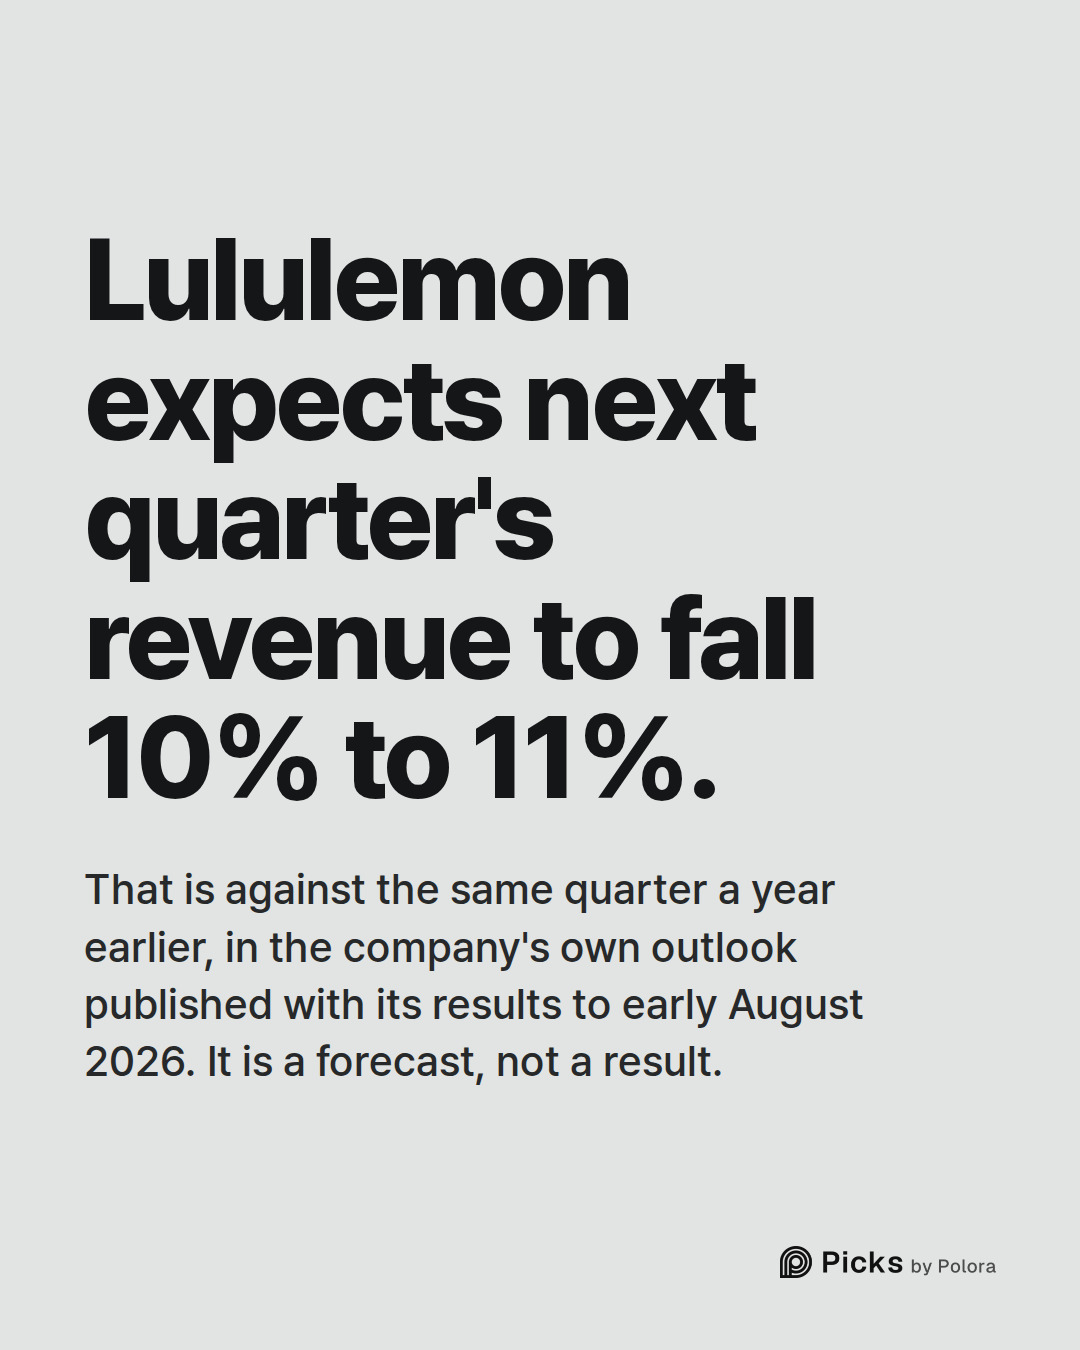
The company expects the next quarter to be weaker. Its own outlook, published with the quarter's results, is for third-quarter revenue to fall 10% to 11% from a year earlier. That is a forecast, not a result, and the real figure will come in Lululemon's next report.
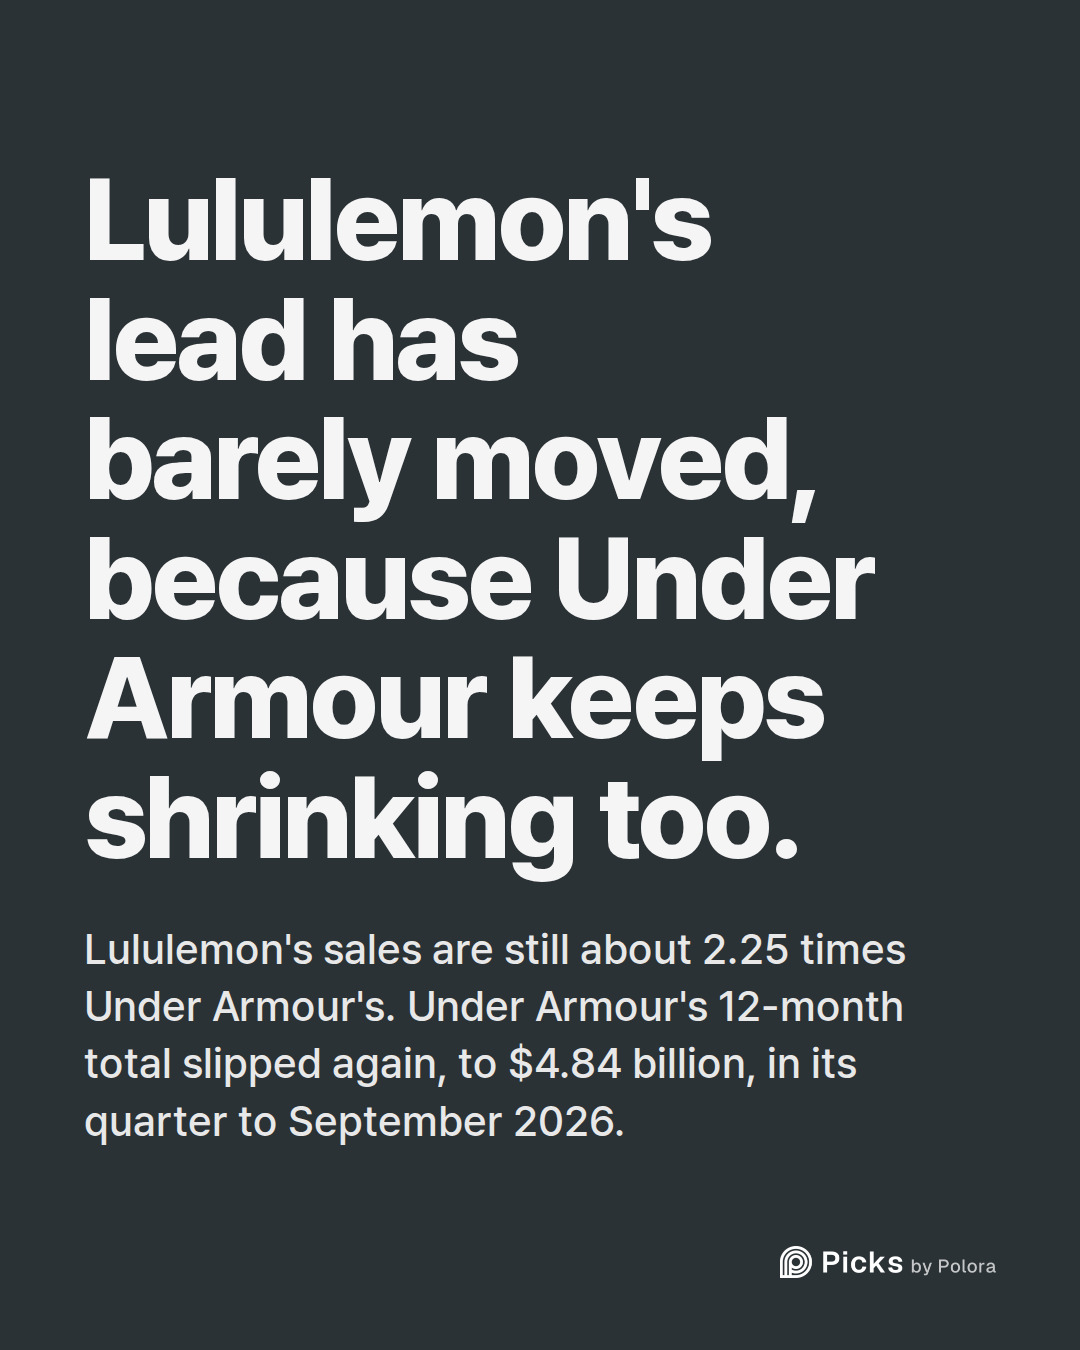
The ratio between the two has barely moved, because Under Armour's sales have kept shrinking too : Lululemon's sales are still about 2.25 times Under Armour's. Under Armour has since reported its quarter to September 2026, and its 12-month total slipped again, to $4.84 billion.
How these numbers were made
Each dollar total here is a company's net revenue over 12 months : the sum of four back-to-back quarters, as reported to the US Securities and Exchange Commission, with the one adjustment for Lululemon's extra weeks described below. Every quarter was read twice, once from the data filed with the companies' reports and again from their quarterly earnings releases. The two differ by at most a few hundred thousand dollars, which changes no figure as shown here. The percentages for Lululemon's latest quarter compare that quarter with the same quarter a year earlier, and come from its quarterly report and its earnings release. The dollars are the dollars of each year, not adjusted for inflation.
The two companies keep different calendars. Under Armour's quarters end with the calendar quarters. Lululemon's fiscal quarters end about a month after the calendar quarters, so each Lululemon 12-month total is set against Under Armour's total for the calendar quarter just before it. Lululemon's fiscal years 2018 and 2024 each had one week more than usual. To keep the years comparable, the extra week's sales that Lululemon reported were taken out : $163.2 million for the whole company in 2024, and $53.0 million in 2018. The 2018 figure covers only its stores and online sales, the only part of that extra week Lululemon published, so the 12-month totals around early 2019 still hold the rest of that week, from its outlets, wholesale and other sales, an amount Lululemon did not publish. The main points hold either way : Lululemon passes Under Armour in 2021, sells more than twice as much today, and its latest 12-month total is its first drop since 2020.
- Lululemon 10-Q for the quarter ended August 2, 2026 (SEC EDGAR)]
- Lululemon results release for the quarter ended August 2, 2026, 8-K exhibit 99.1 (SEC EDGAR)]
- Under Armour results release for the quarter ended September 30, 2026, 8-K exhibit 99.1 (SEC EDGAR)]
- Lululemon 10-Q for the quarter ended May 3, 2020 (SEC EDGAR)]
- Under Armour 10-Q for the quarter ended March 31, 2020 (SEC EDGAR)]
- Lululemon 10-K for the year ended February 3, 2019 (SEC EDGAR)]
- Lululemon 10-K for the year ended February 2, 2025 (SEC EDGAR)]
- Lululemon quarterly and yearly net revenue, XBRL company concept (SEC EDGAR)]
![Sources 8 : sec.gov · Lululemon 10-Q for the quarter ended August 2, 2026 (SEC EDGAR)], sec.gov · Lululemon results release for the quarter ended August 2, 2026, 8-K exhibit 99.1 (SEC EDGAR)], sec.gov · Under Armour results release for the quarter ended September 30, 2026, 8-K exhibit 99.1 (SEC EDGA](https://media.cdn.polora.ai/picks/2026/11/pickrun_11d30aedb54947c7/zMA6_NCBN0MJxJLx-slide-07--does-lululemon-outsell-under.jpg)