Four everyday costs that outran pay
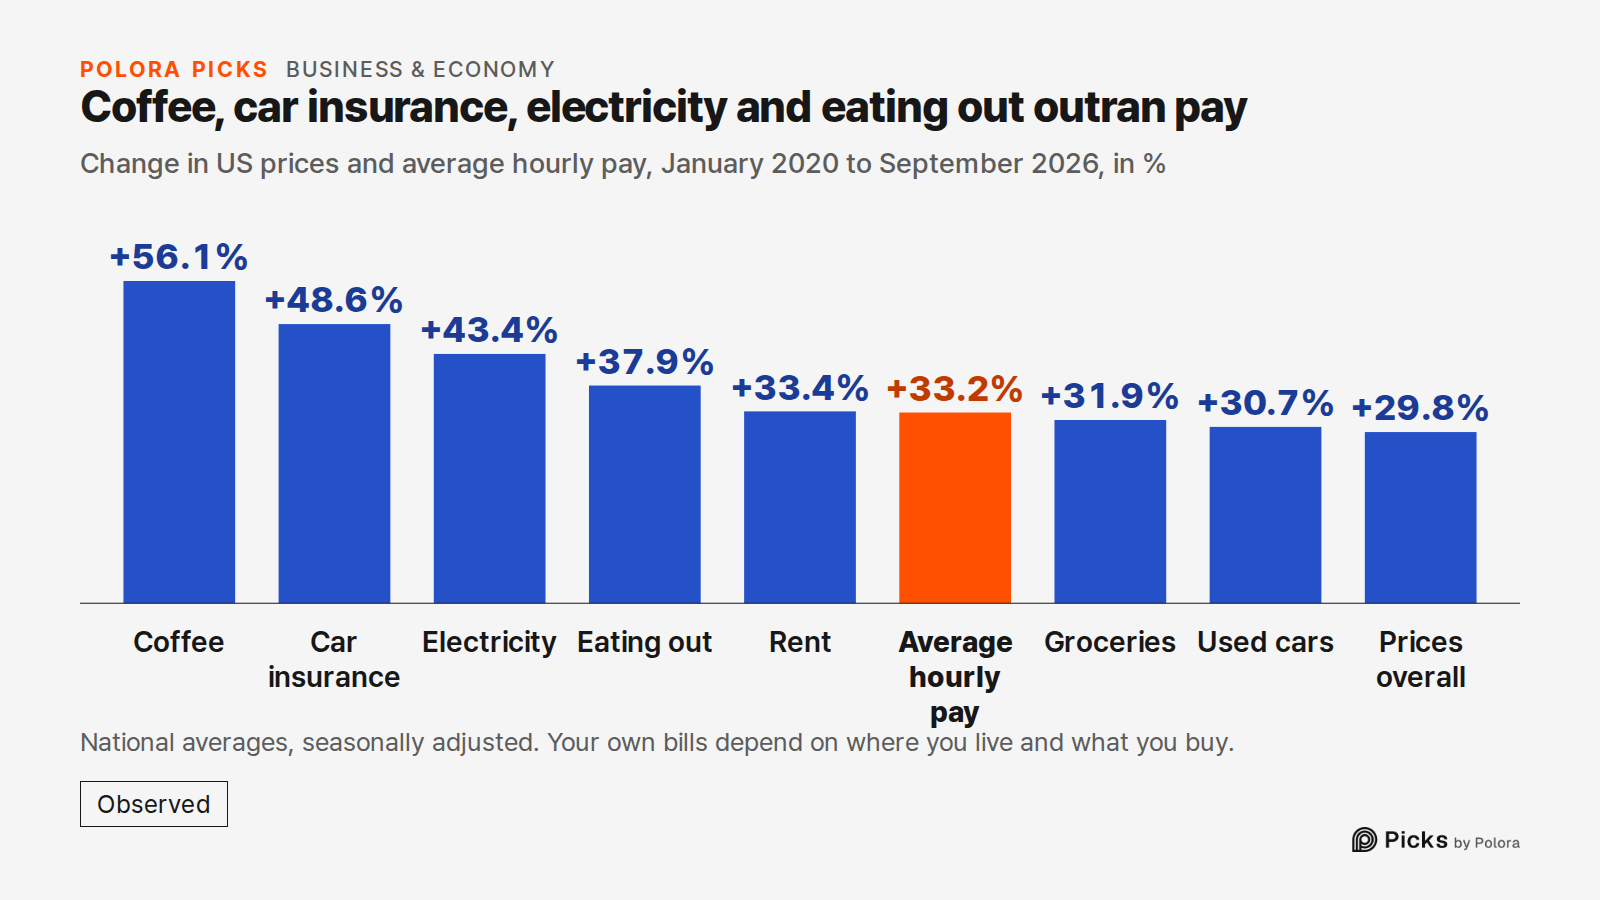
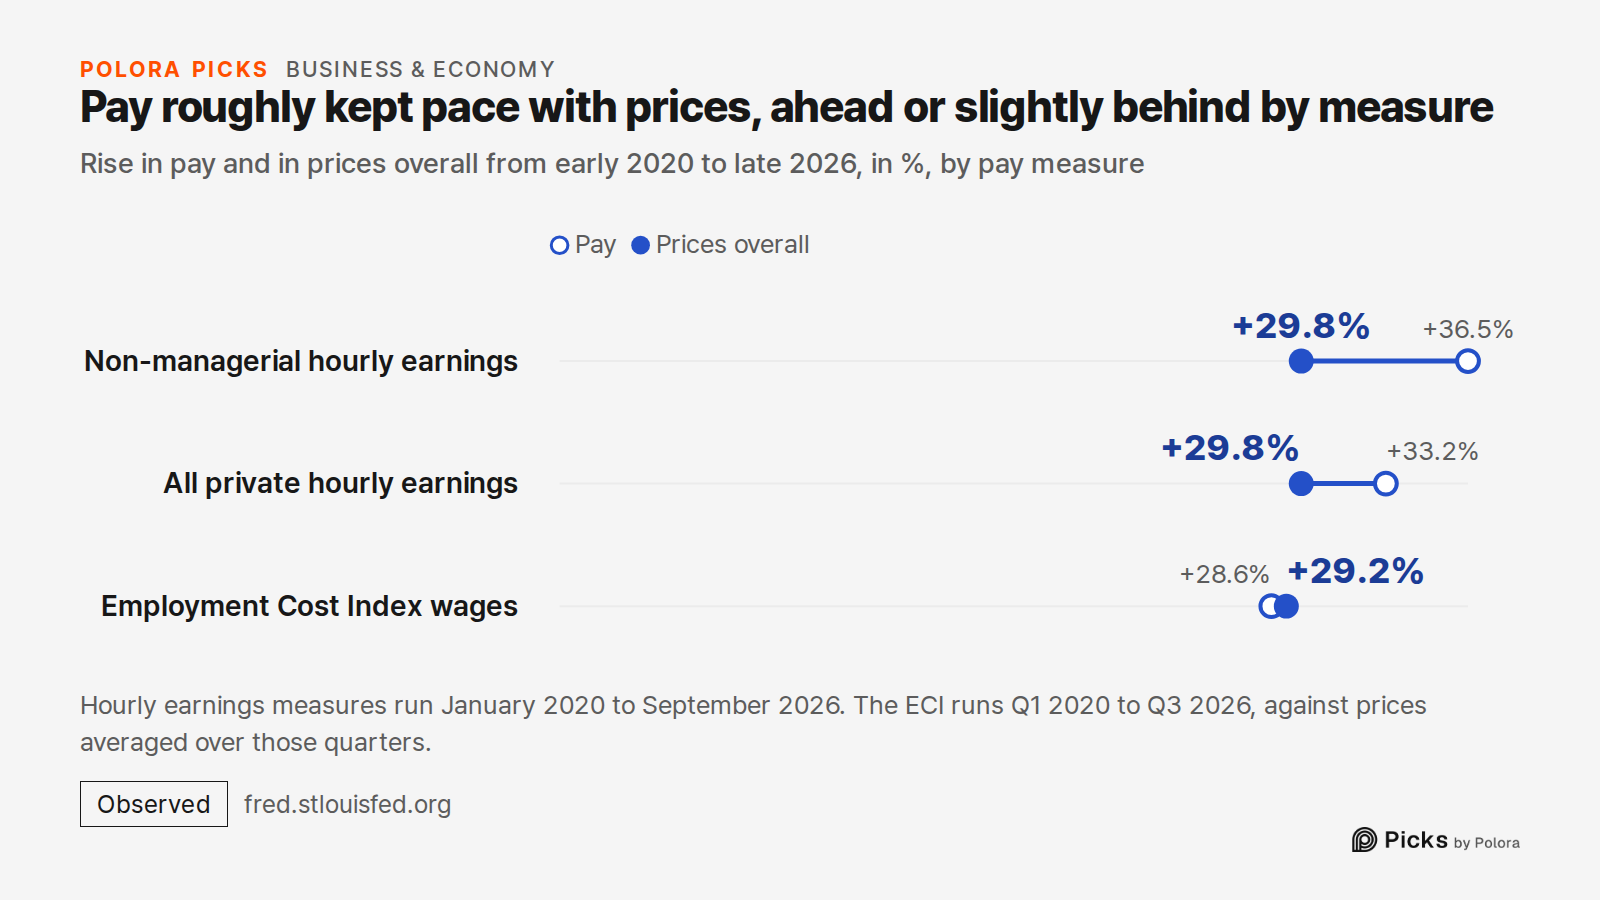
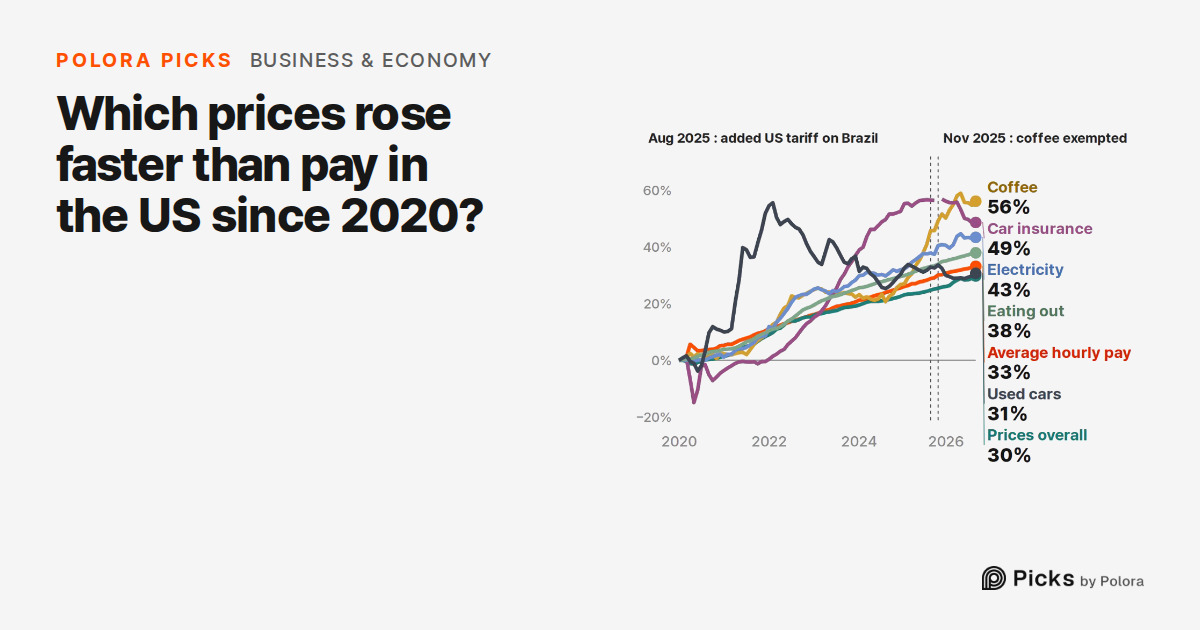
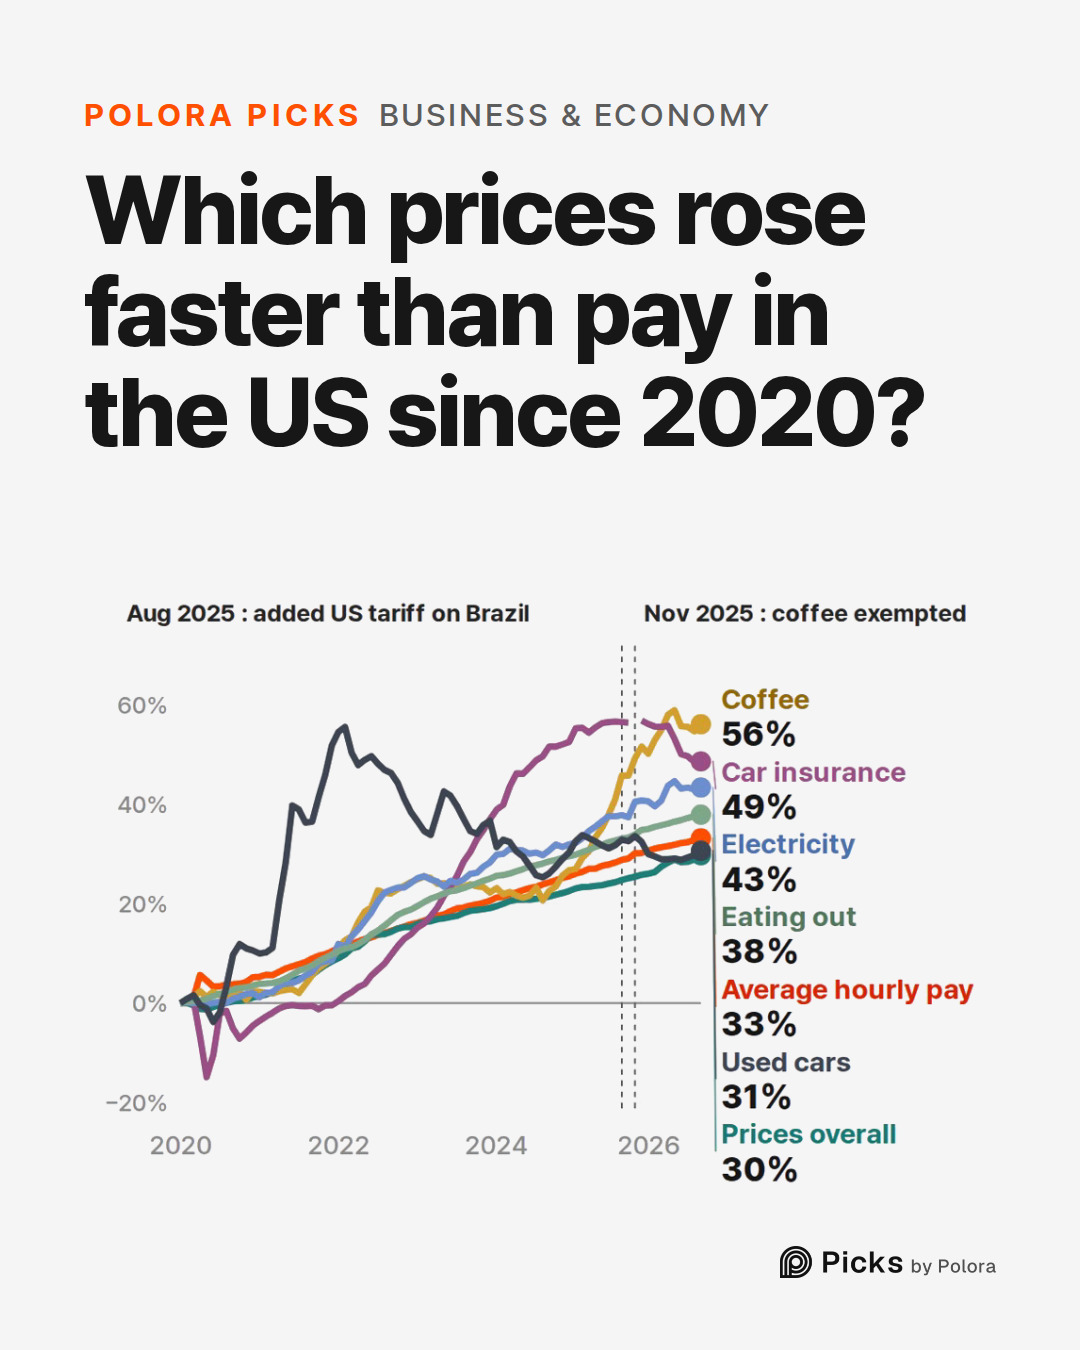
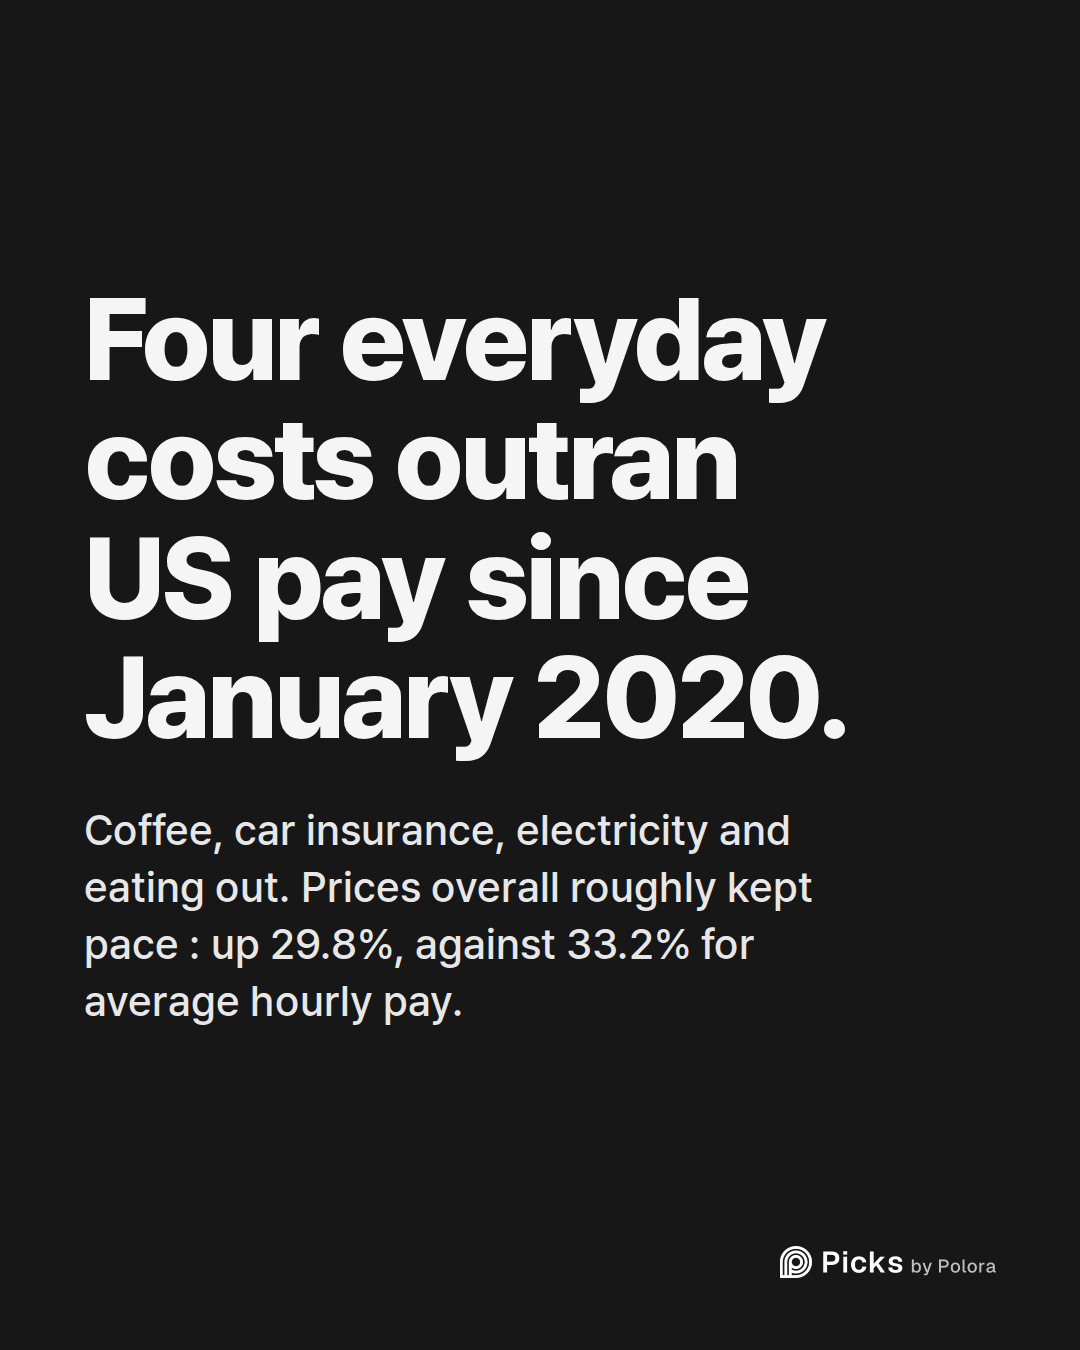
Take January 2020 as the starting line and measure everything as the change since then. By September 2026, average hourly pay for private-sector employees was up 33.2%. The Consumer Price Index, the government's measure of the average change in prices paid by urban consumers, was up 29.8%. On this measure, pay stayed slightly ahead.
Some everyday prices pulled well away from both. Coffee was up 56.1%, car insurance 48.6%, electricity 43.4% and eating out 37.9%. Rent rose 33.4% and groceries 31.9%, about level with pay. Used cars, which led the climb in 2021, ended up 30.7%, below pay.
All of these figures come from the US Bureau of Labor Statistics (BLS). They are seasonally adjusted, so the regular yearly ups and downs are taken out. None of them is adjusted for inflation, because the point is to compare them with each other. Each item is a national average. Your own bills depend on where you live and what you buy, and an index tracks how much a price changed, not how high it is.
Why average pay jumped in spring 2020
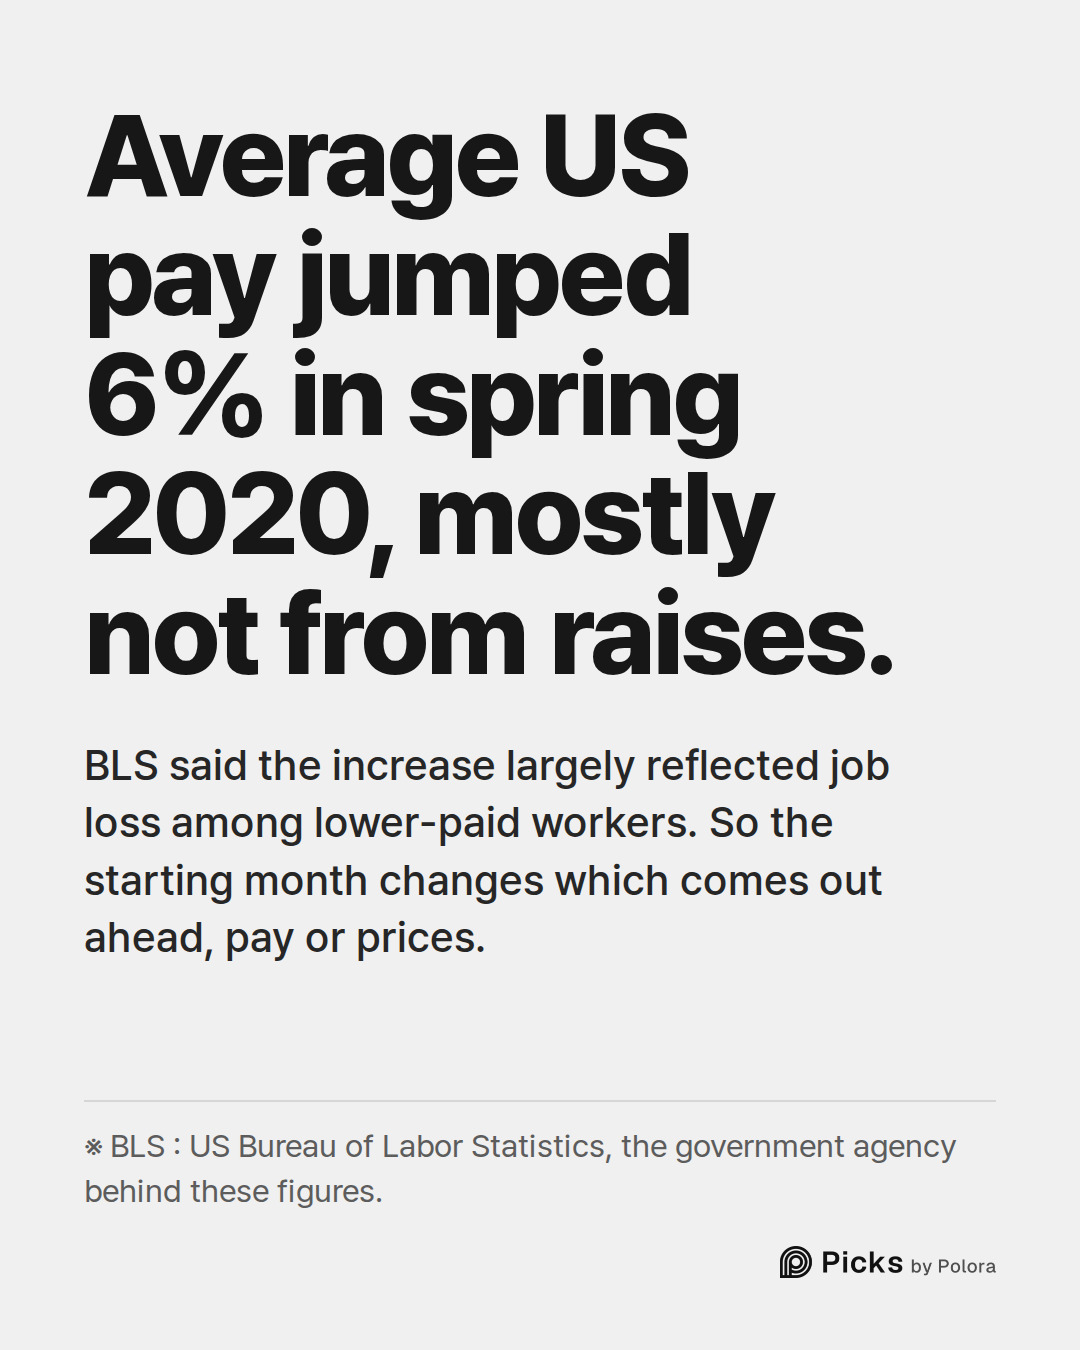
Average hourly pay jumped 6% between January and April 2020, at the start of the pandemic. That was mostly not raises. When BLS reported April's numbers, it said the increase "largely reflect[s] the substantial job loss among lower-paid workers". With huge numbers of lower-paid jobs gone at once, the average of the jobs that remained went up. Over the following months the average slipped back from that spike, then resumed its climb.
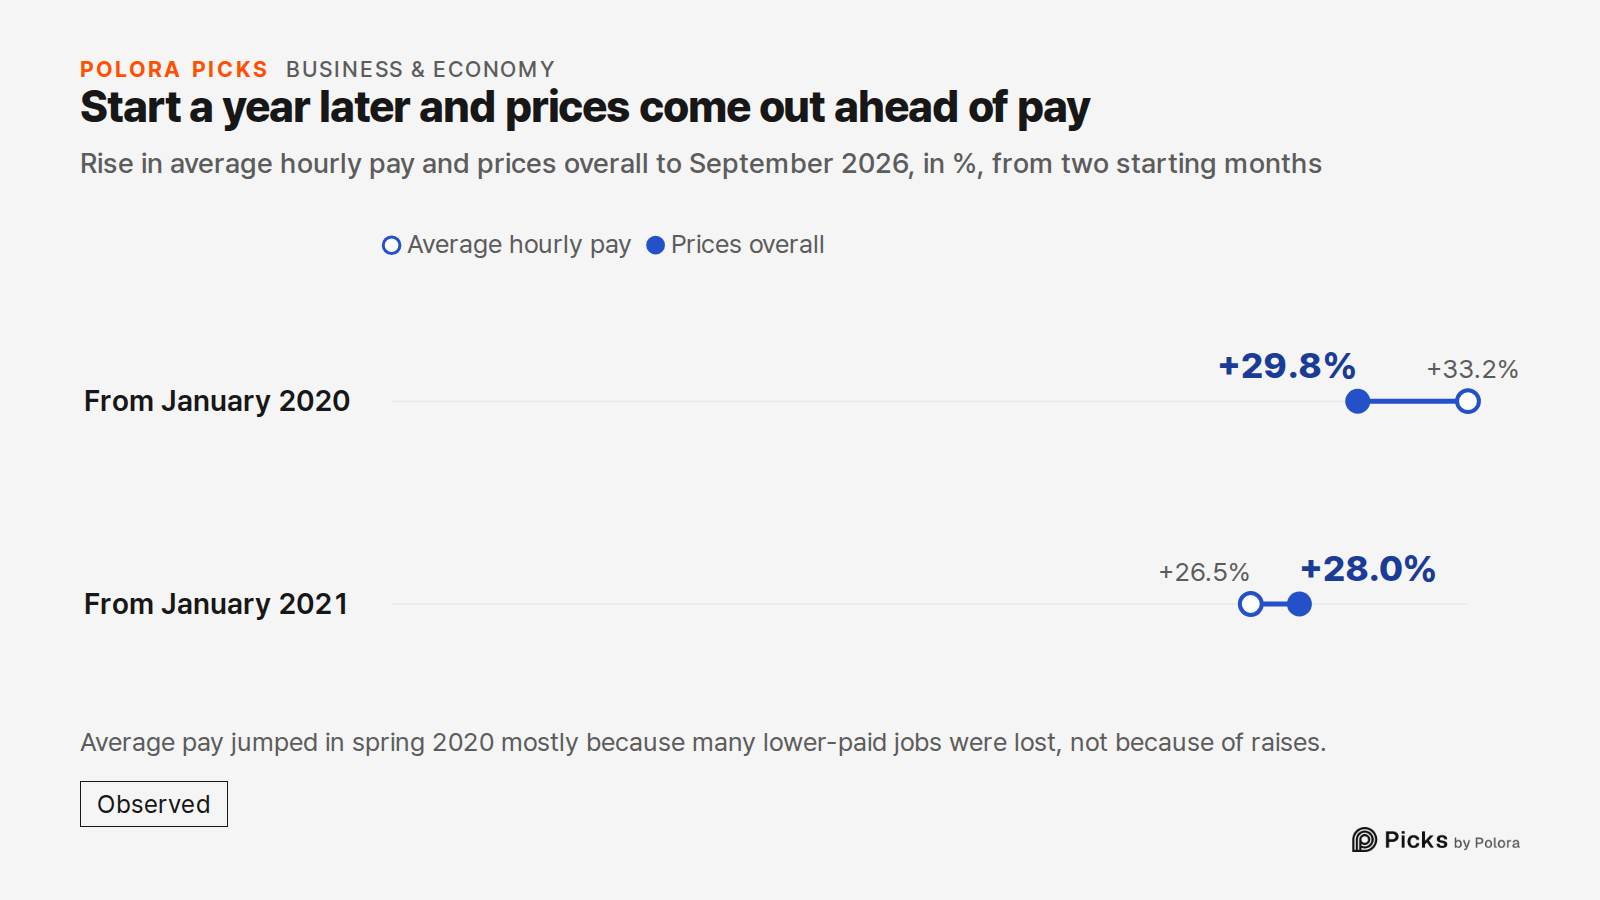
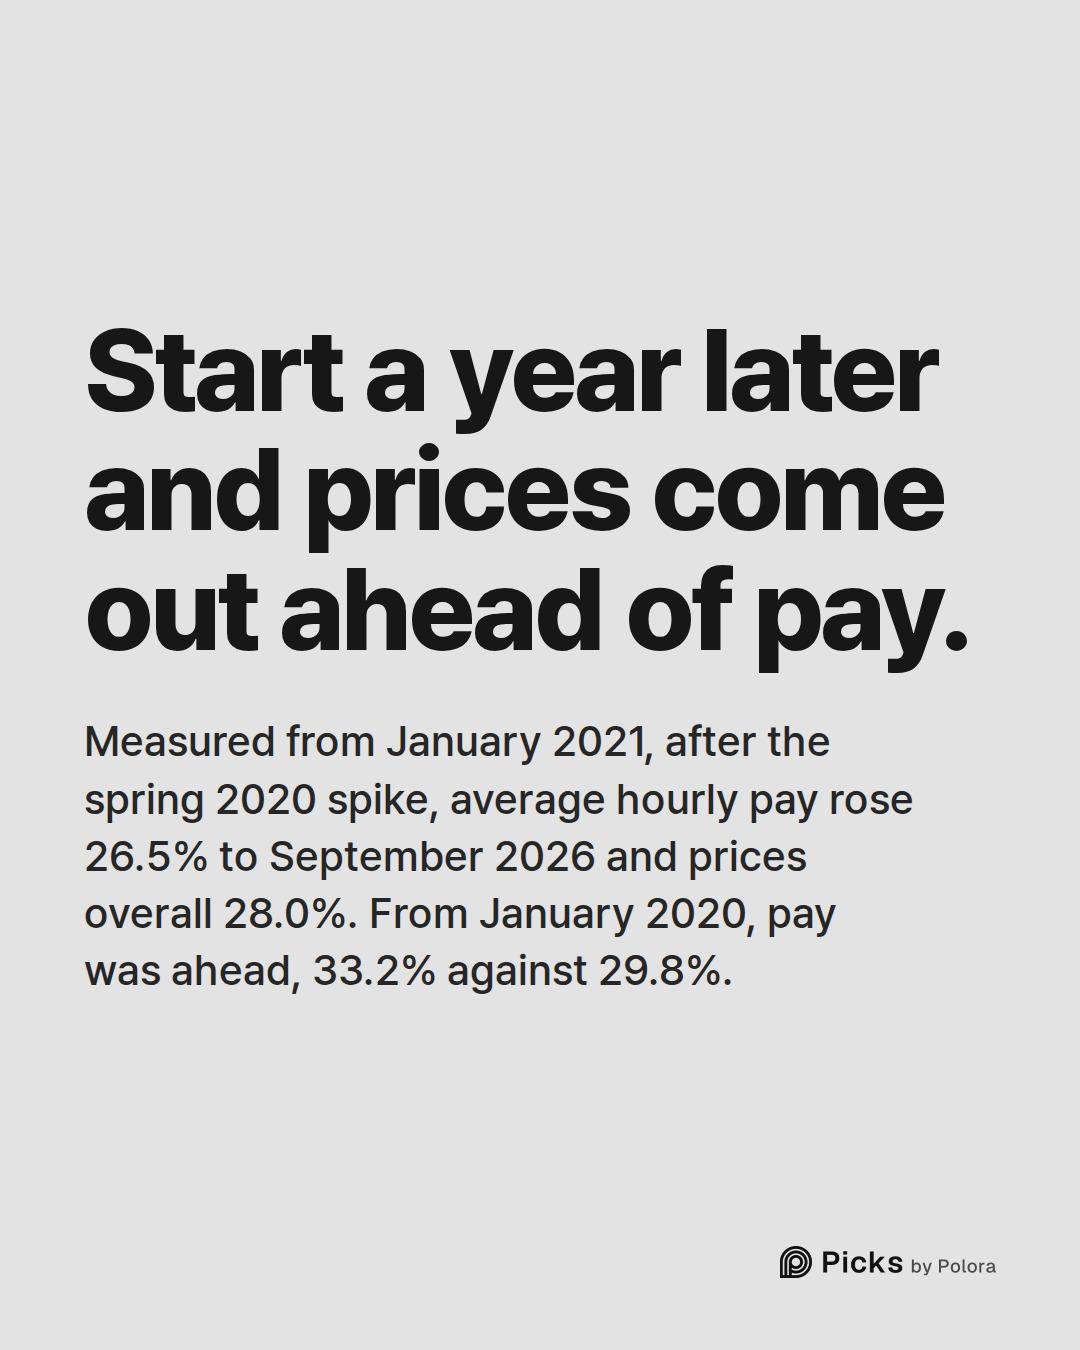
The starting month matters. Measured from January 2021 instead, after that spike, pay rose 26.5% to September 2026 while prices overall rose 28.0%. That window puts prices slightly ahead.
Used cars led first, then car insurance
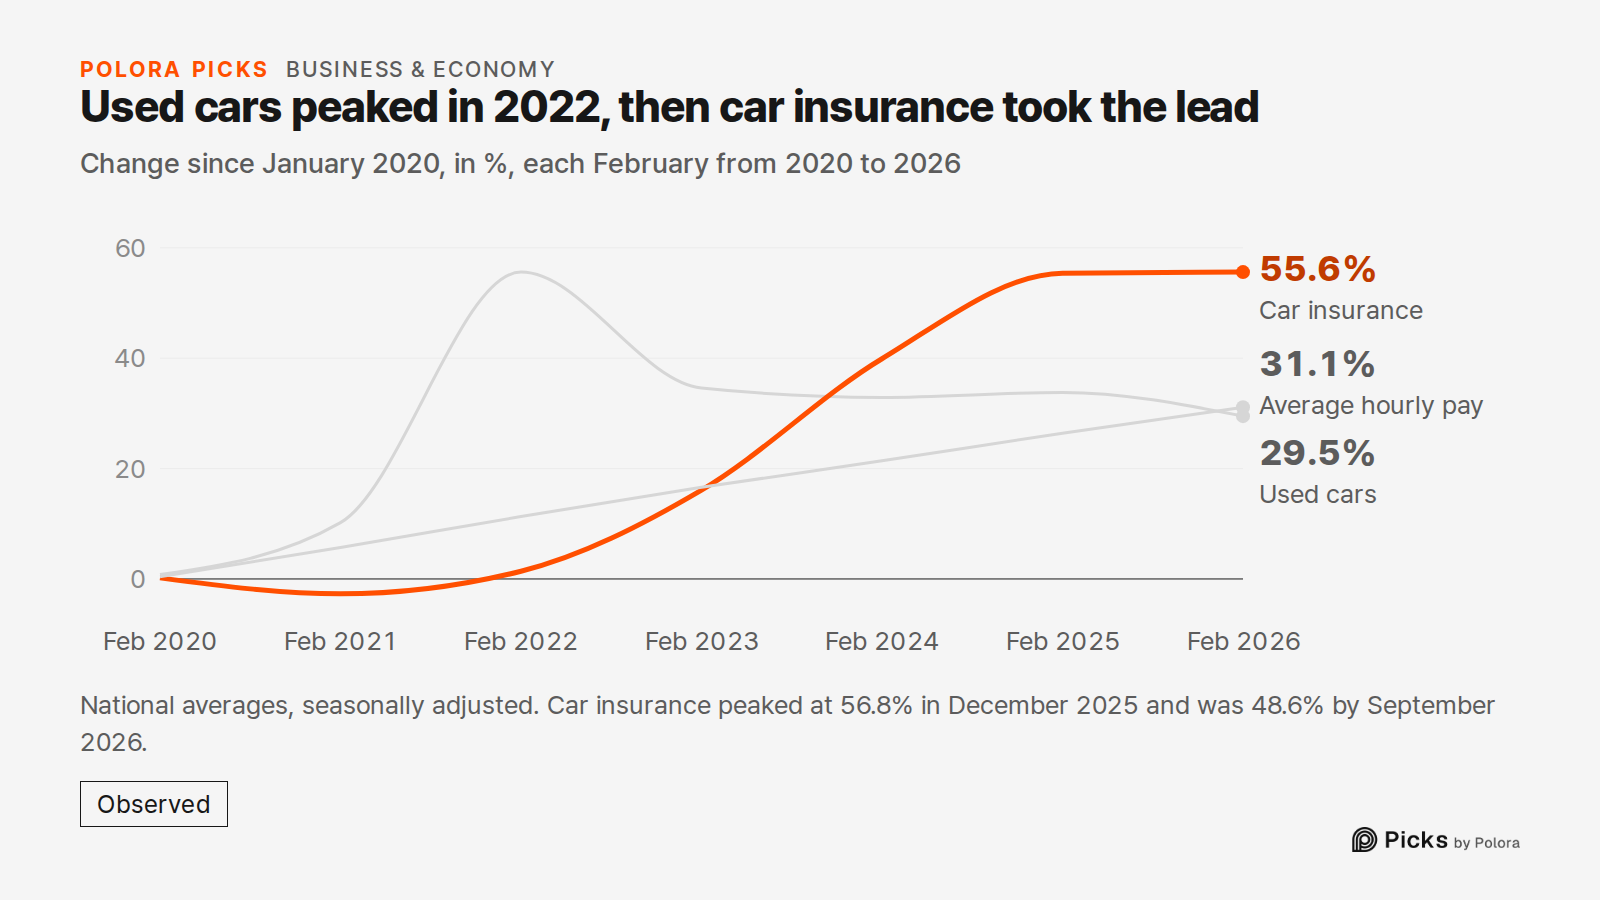
Used cars took the early lead. By February 2022 they were up 55.6% from January 2020, far ahead of every other item tracked here at that point. After that they mostly fell back.
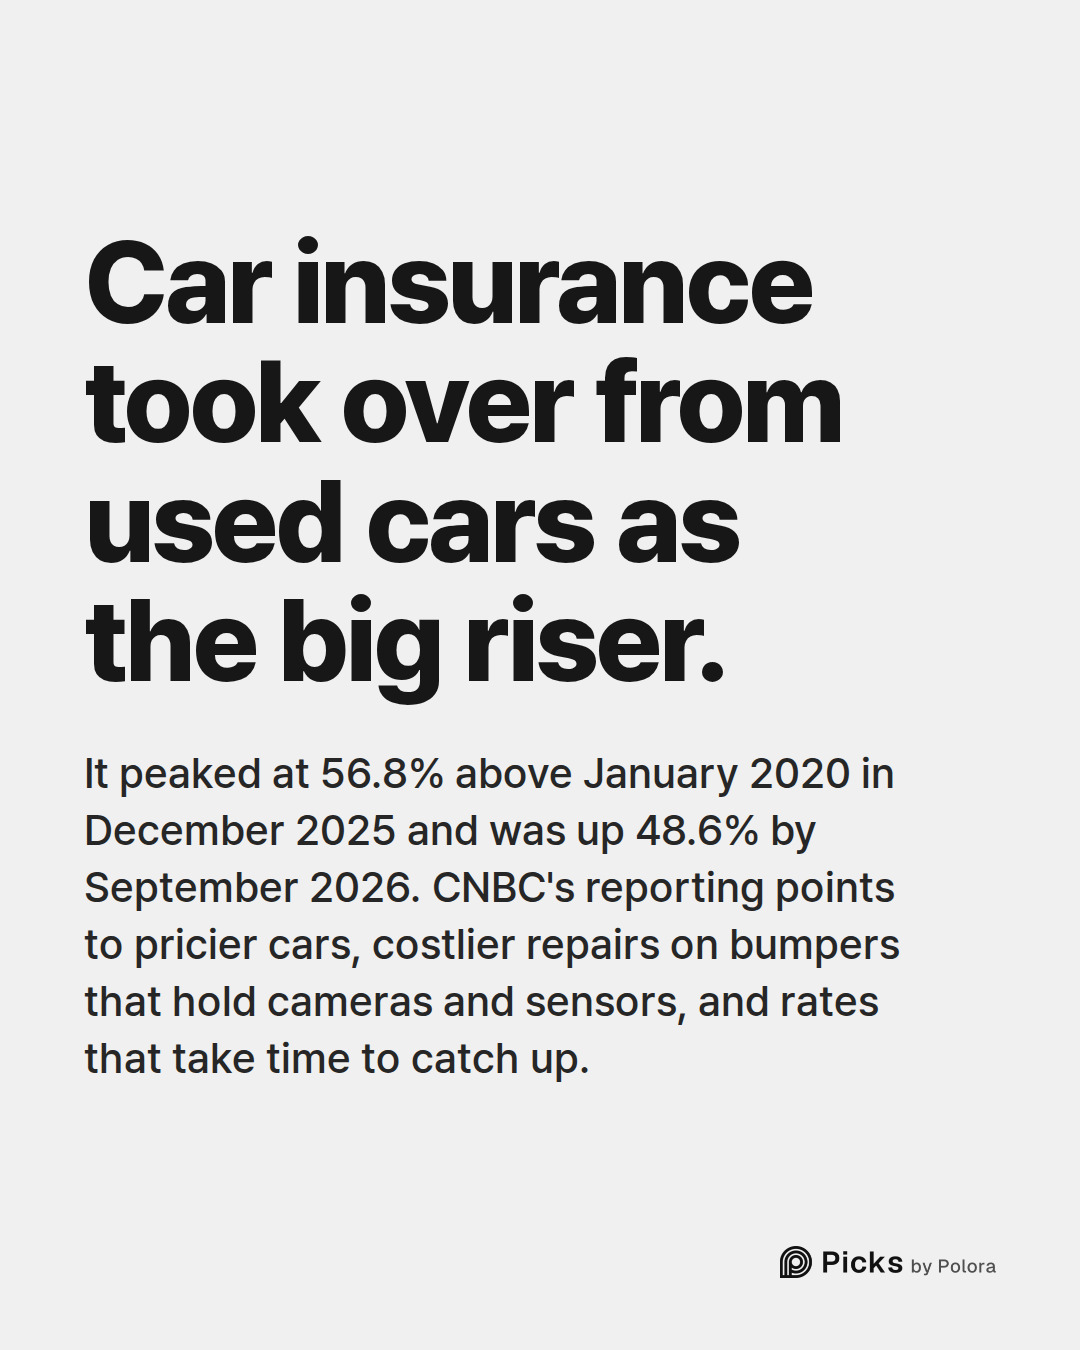
Car insurance took over. It was up 37.0% by December 2023, about level with used cars by then. CNBC's reporting on the rise points to several costs at once. Pricier new and used cars cost more to replace after a crash. Repairs cost more because modern bumpers and panels hold cameras and sensors. And insurers need time to build rising claim costs into the rates states approve. Car insurance reached its highest reading, 56.8%, in December 2025 and had eased to 48.6% by September 2026.
Electricity and eating out stayed above pay in every month of 2024 and 2025 for which there is data, though electricity did not rise every month.
Why coffee kept rising after the tariff exemption
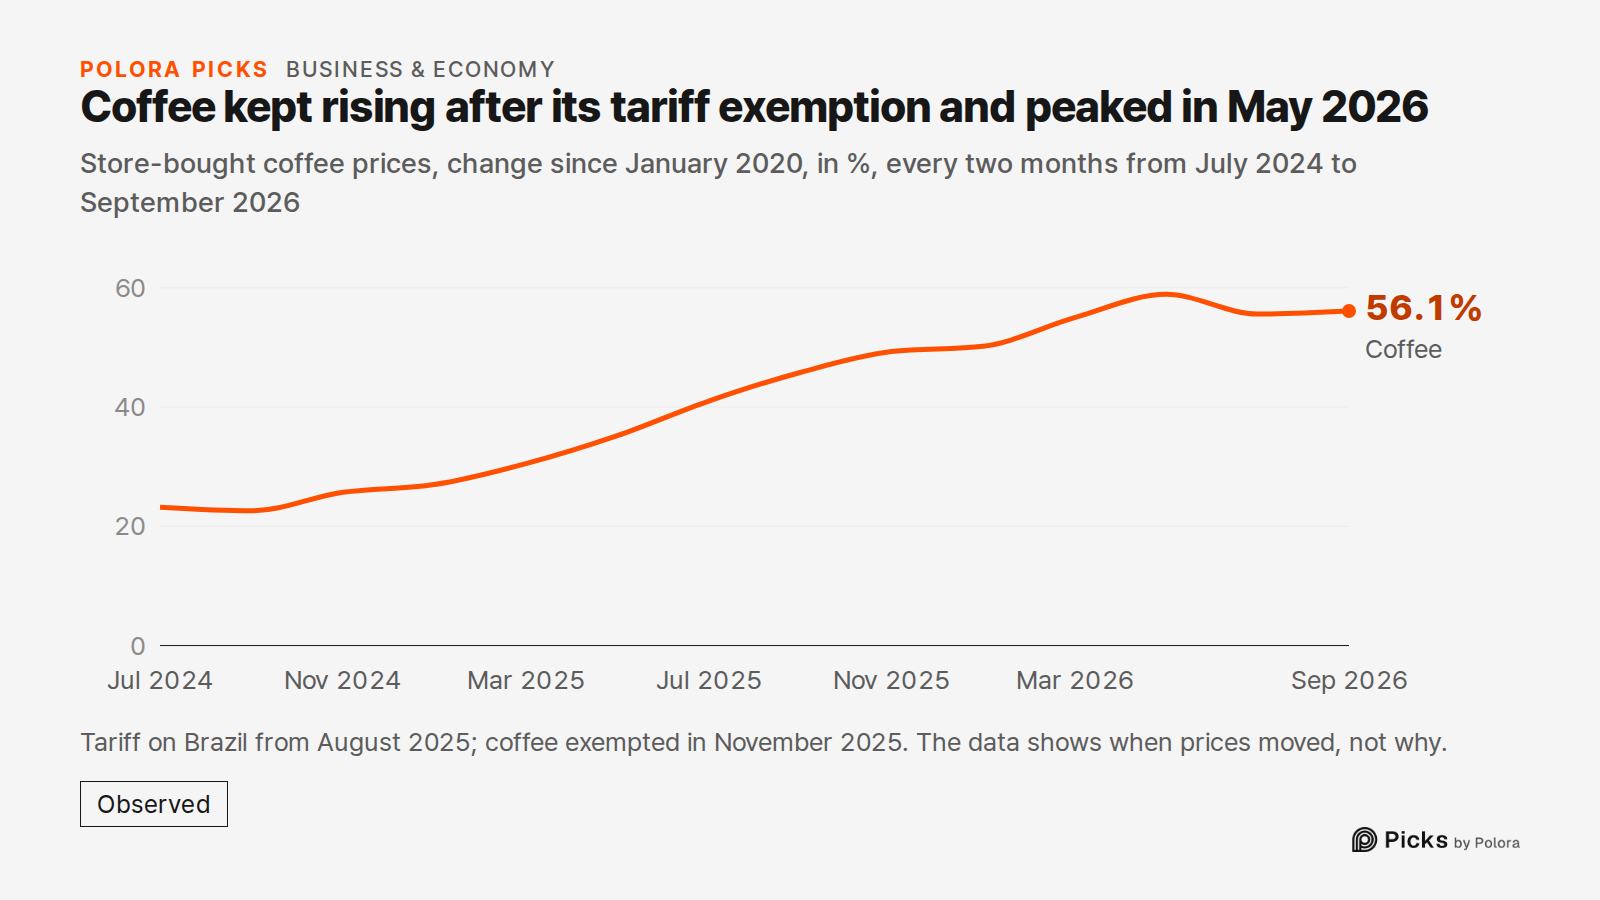
The coffee figure is coffee bought in stores. It is part of the CPI's food at home, not café drinks. Coffee had been climbing since late 2024. In August 2025, an added US tariff on goods from Brazil took effect. Brazil supplies a large share of the coffee Americans drink, Market Realist notes. In November 2025, an executive order exempted coffee and other farm products from that tariff.
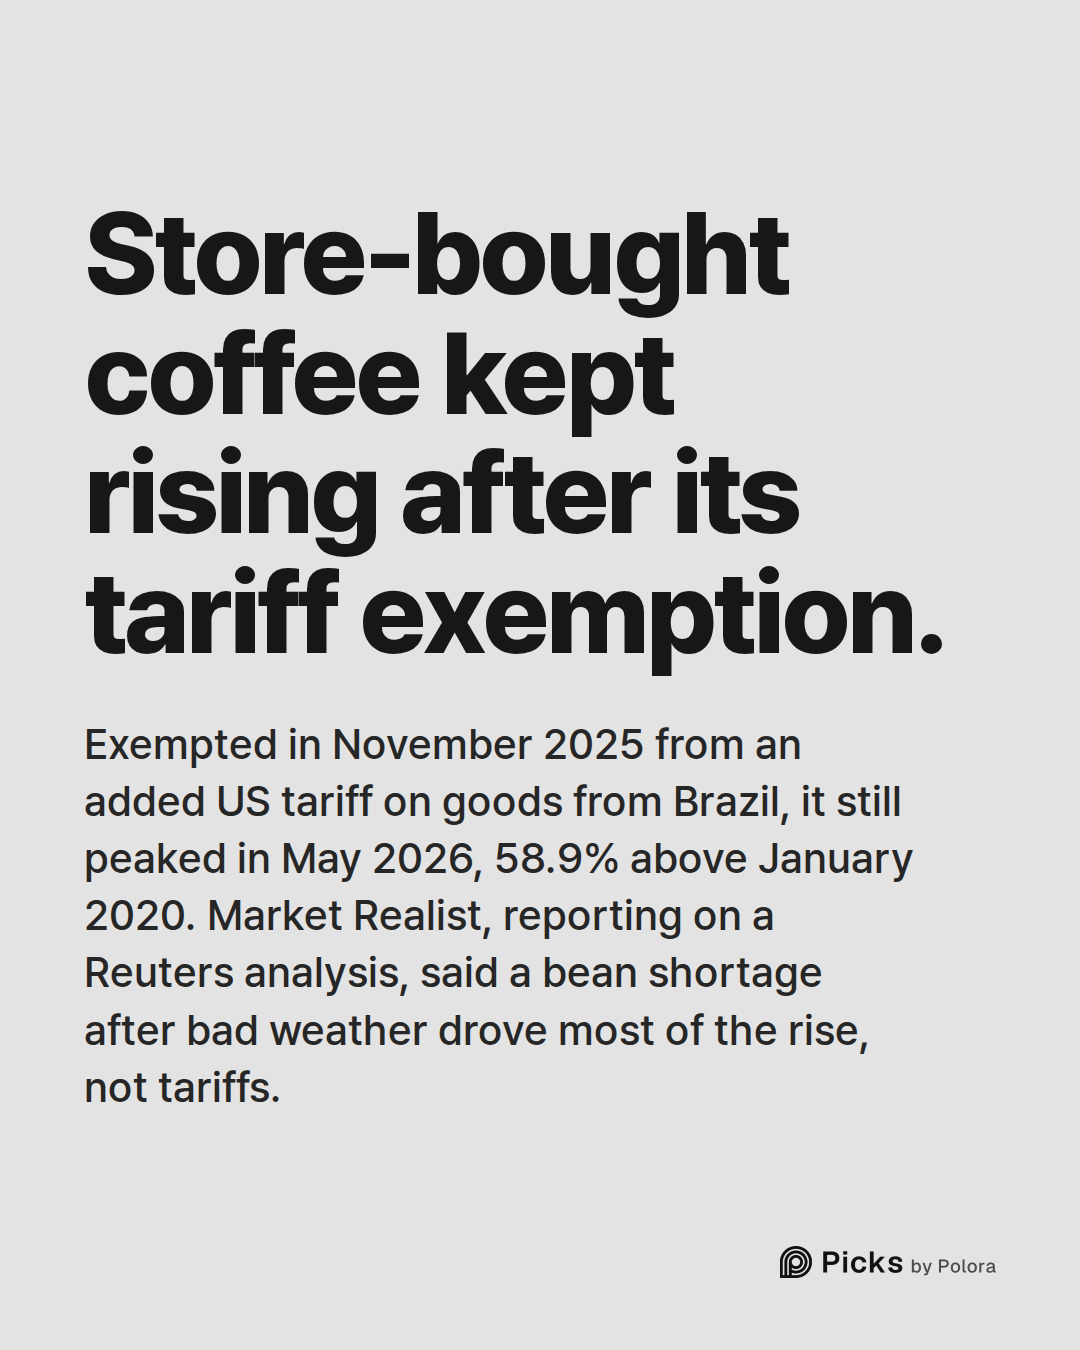
Store coffee prices rose further after the exemption, apart from a dip in January, and reached their highest reading in May 2026, 58.9% above January 2020. The data shows when prices moved, not why. Trade reporting offers a reason shelf prices lag. Market Realist, reporting on a Reuters analysis, said most of the rise in retail coffee prices came from an earlier shortage of beans after bad weather, which drove raw bean prices to record highs, and that tariffs were not the main driver. Roasters buy beans months ahead and keep stock on hand, so changes in raw bean prices reach supermarket shelves months later. As one importer put it, "coffee prices rise more quickly than they fall."
One gap in the record : BLS could not collect prices from the start of October to mid-November 2025, during the federal government shutdown. Most October 2025 prices were never collected, so the charts skip that month for every item. Car insurance also has no November 2025 figure.
Did pay keep up? It depends on the measure
The pay figure used here is average hourly earnings of all private employees. Like any average across jobs, it moves when the mix of jobs changes, as it did in 2020. Other measures cover different workers or are built differently, and they give a slightly different answer.
For production and nonsupervisory workers, the non-managerial jobs, average hourly earnings rose 36.5% from January 2020 to September 2026. That is further ahead of prices.
The Employment Cost Index (ECI) prices a fixed set of jobs, so, in BLS's words, it is free from the effects of workers moving between occupations and industries. On that basis, private-sector wages and salaries rose 28.6% from the first quarter of 2020 to the third quarter of 2026. Prices overall, averaged over the months of those same quarters, rose 29.2%, slightly more. The ECI is a single quarterly reading rather than a three-month average, so the timing of the two is close but not identical.
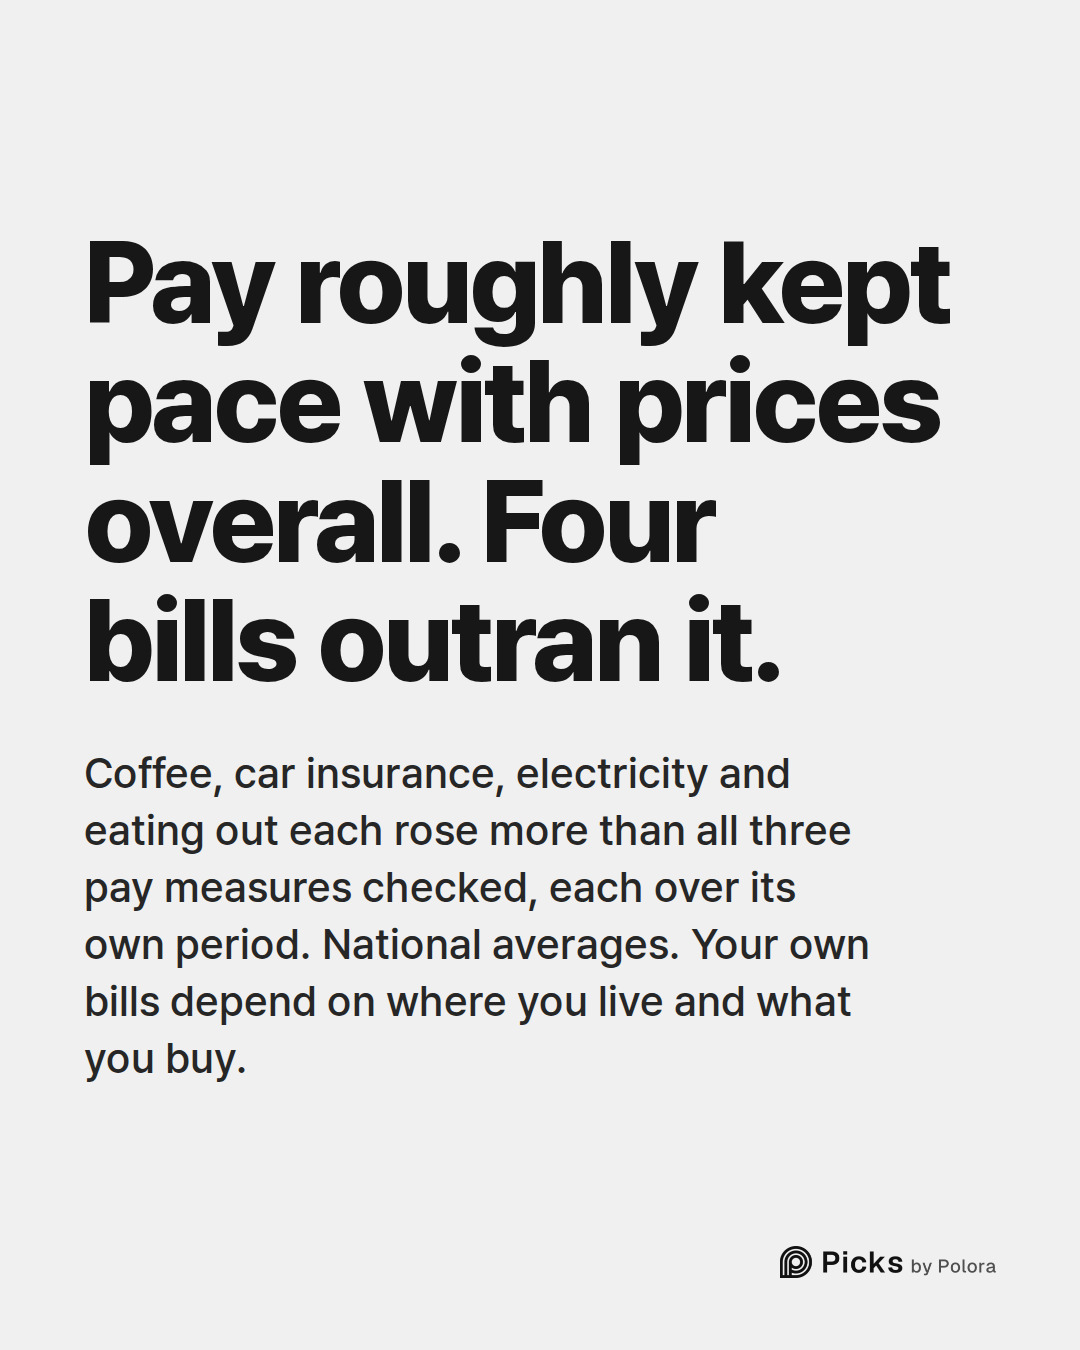
So "pay kept pace with prices" is roughly true, ahead or slightly behind depending on the measure. Coffee, car insurance, electricity and eating out each rose more than any of these three pay measures, each over its own period.
- US Bureau of Labor Statistics, Consumer Price Index and average hourly earnings series, via FRED (Federal Reserve Bank of St. Louis)]
- US Bureau of Labor Statistics, motor vehicle insurance CPI, seasonally adjusted (series CUSR0000SETE)]
- US Bureau of Labor Statistics, Employment Cost Index and production-worker earnings, via FRED]
- US Bureau of Labor Statistics, Employment Cost Index overview]
- US Bureau of Labor Statistics, The Employment Situation, April 2020]
- US Bureau of Labor Statistics, CPI detailed expenditure categories, September 2026 (Table 2)]
- US Bureau of Labor Statistics, 2025 federal government shutdown impact on the CPI]
- CNBC, Why car insurance costs are skyrocketing (April 2024)]
![Sources 8 : fred.stlouisfed.org · US Bureau of Labor Statistics, Consumer Price Index and average hourly earnings series, via FRED (Federal Reserve Bank of St. Louis)], api.bls.gov · US Bureau of Labor Statistics, motor vehicle insurance CPI, seasonally adjusted (series CUSR0000SETE)], fred.stlouisf](https://media.cdn.polora.ai/picks/2026/11/pickrun_c6d49547a7cc435f/WbfMPAXFkjbm6Yux-slide-08--which-prices-rose-faster.jpg)