The longest wait for a raise
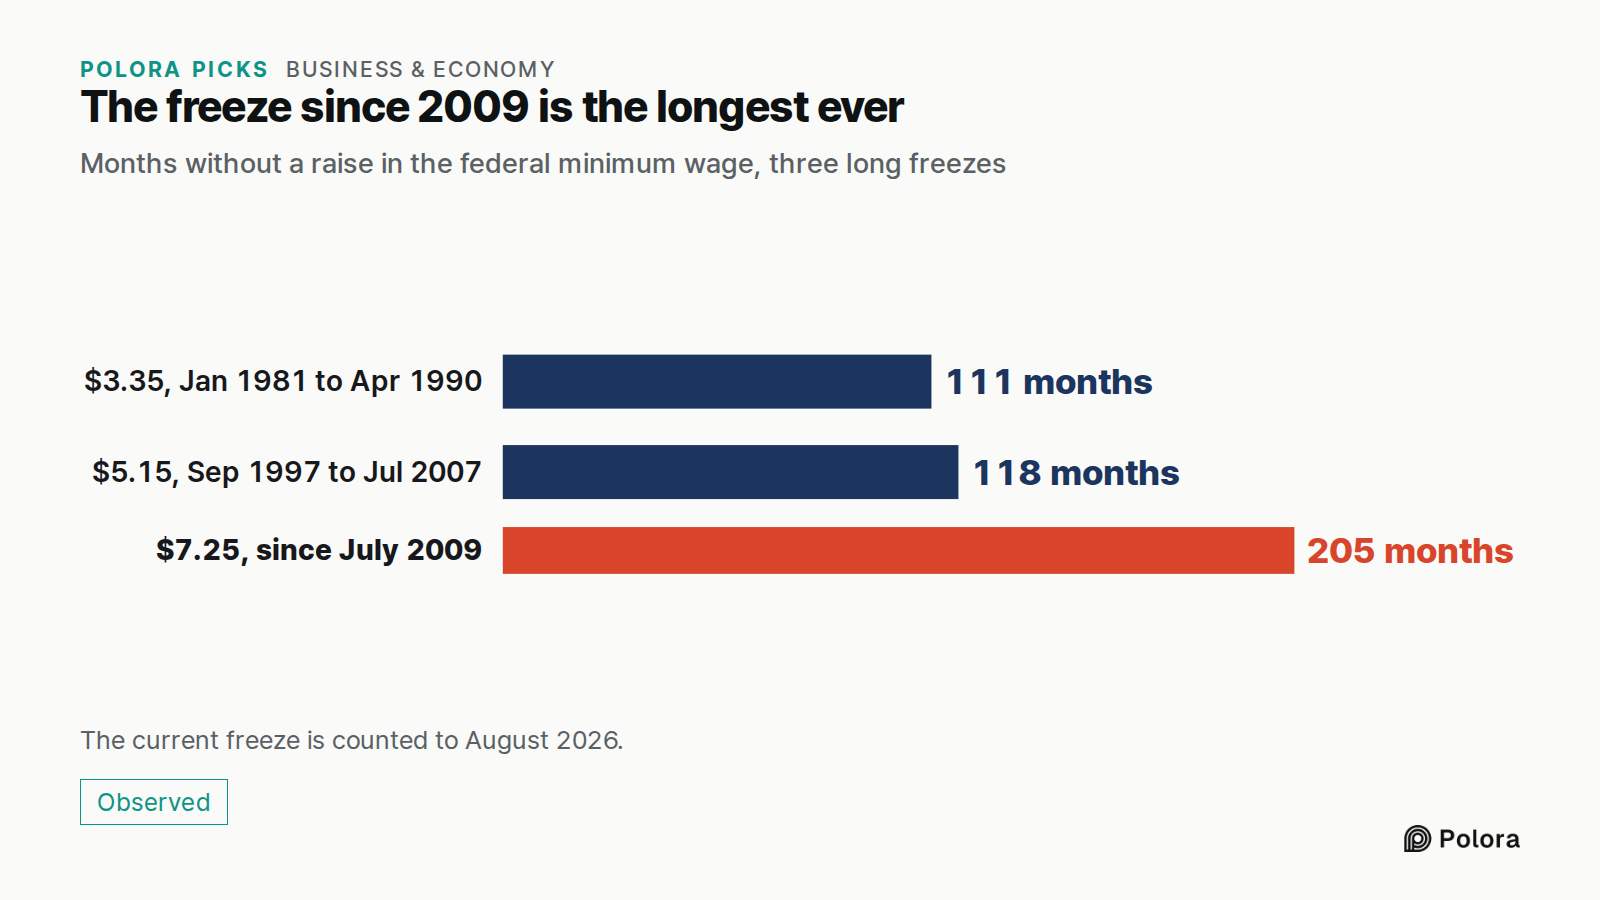
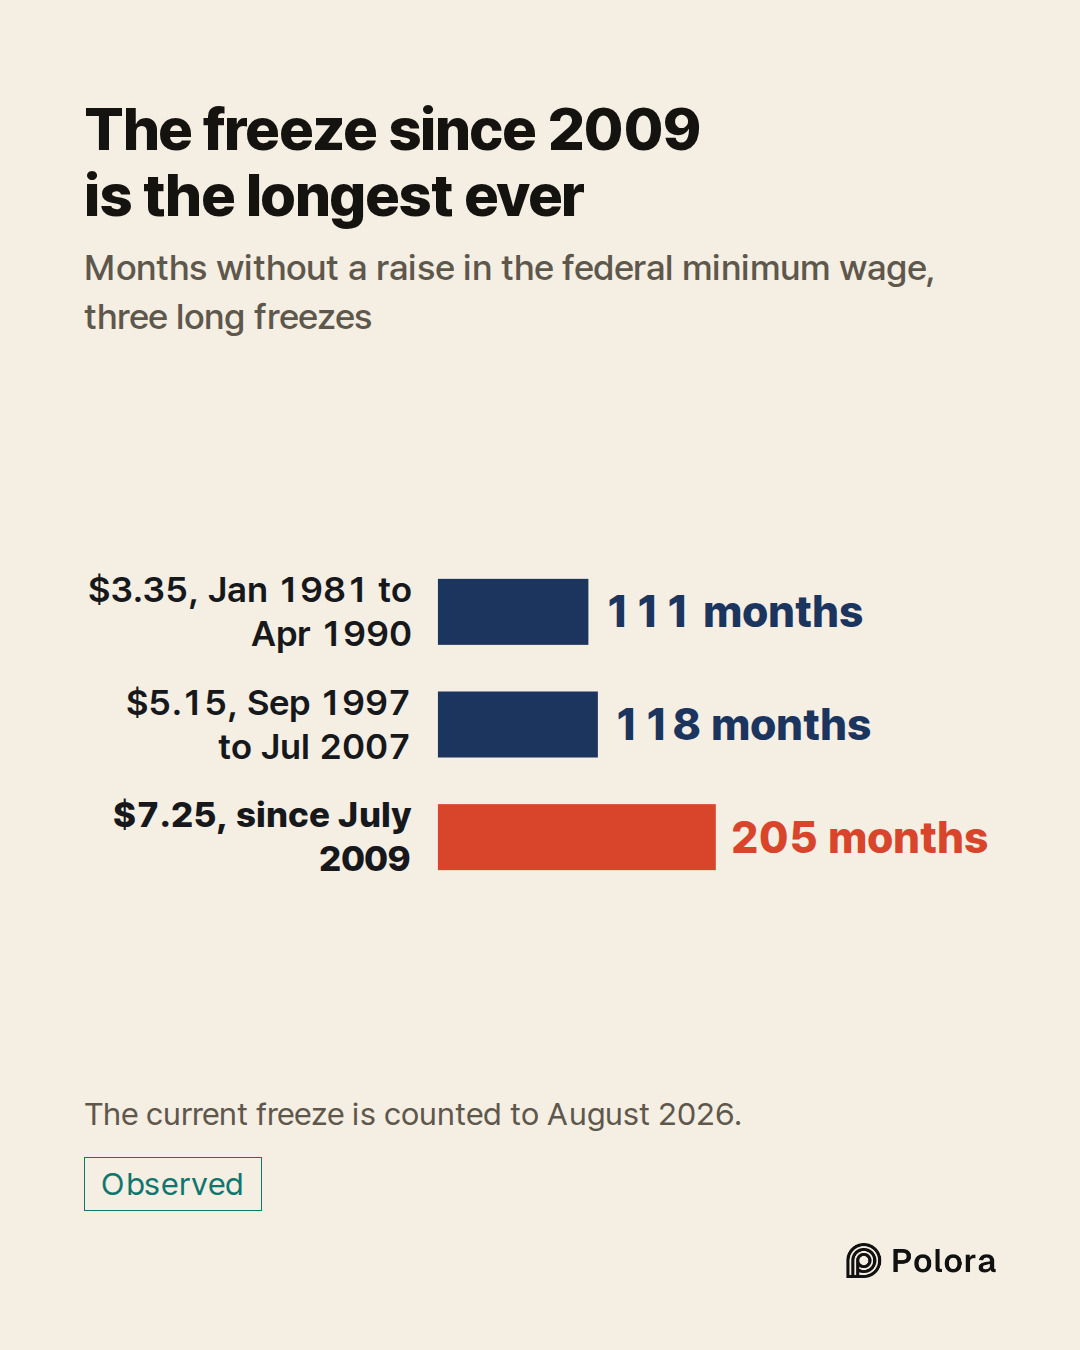
On July 24, 2009, the federal minimum wage rose to $7.25 an hour. It has not moved since. By August 2026 that is 205 months, more than 17 years. The federal floor has never gone this long without a raise since it was created in 1938.
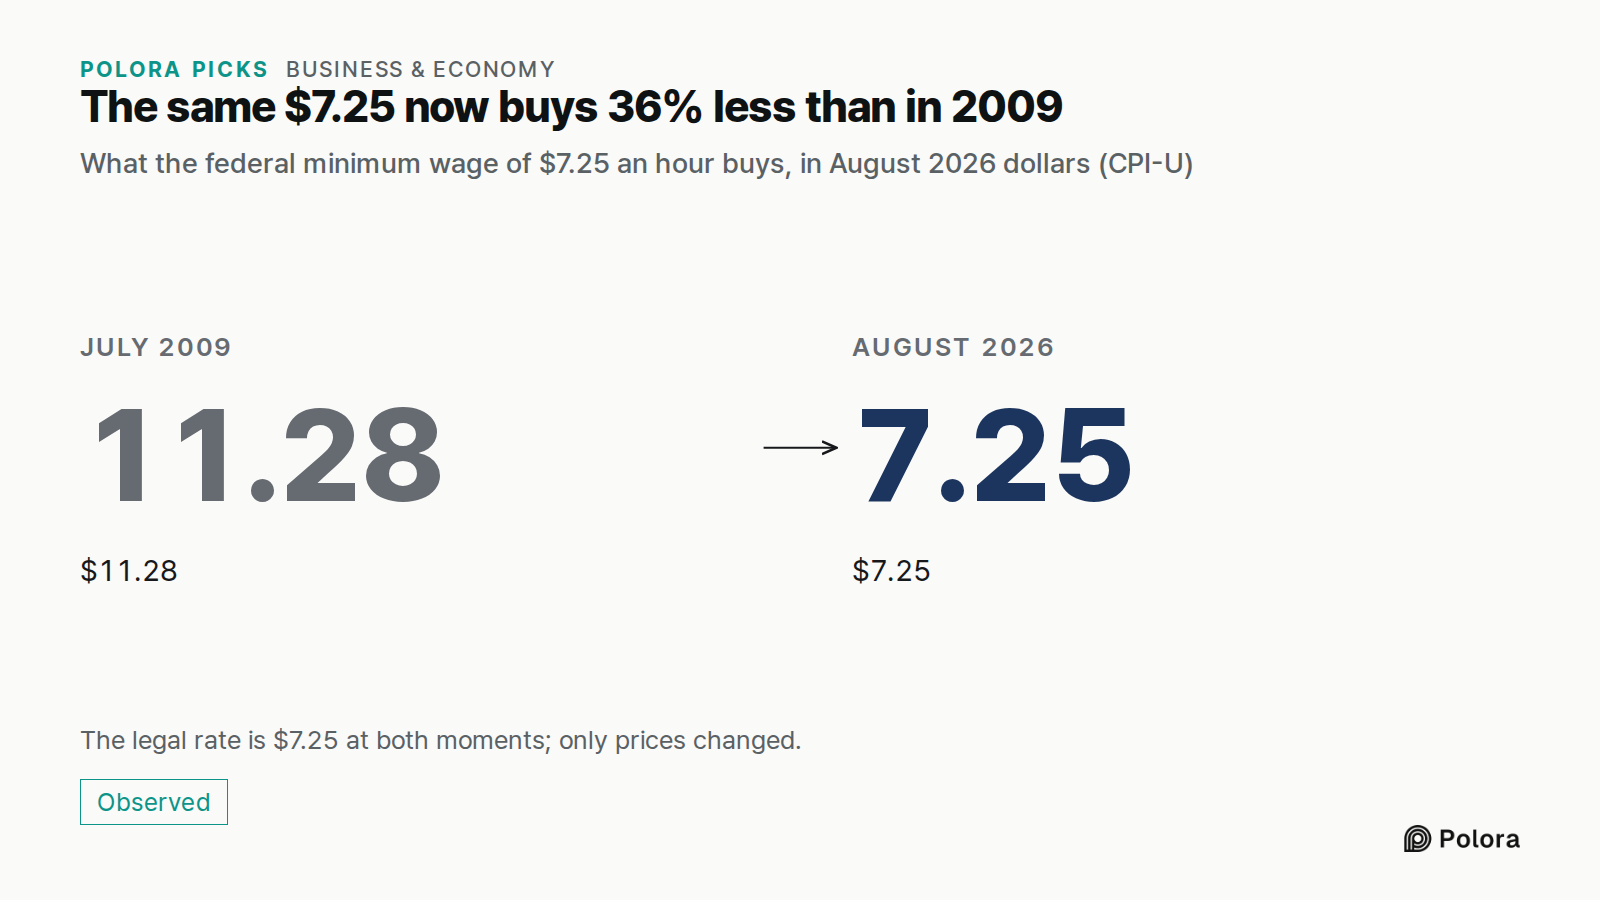
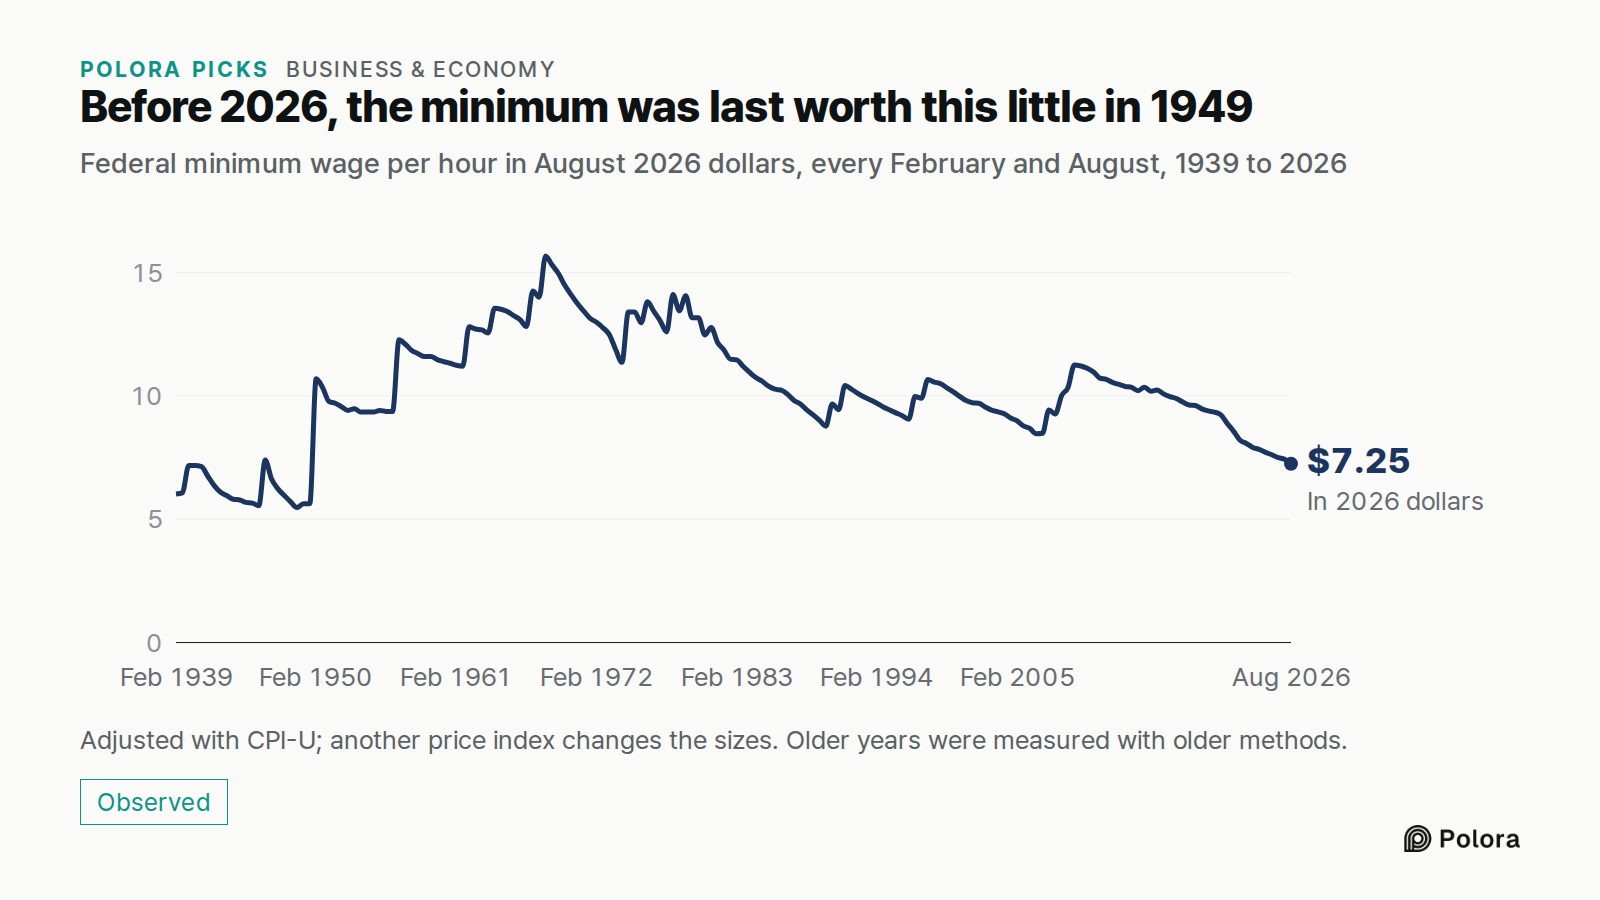
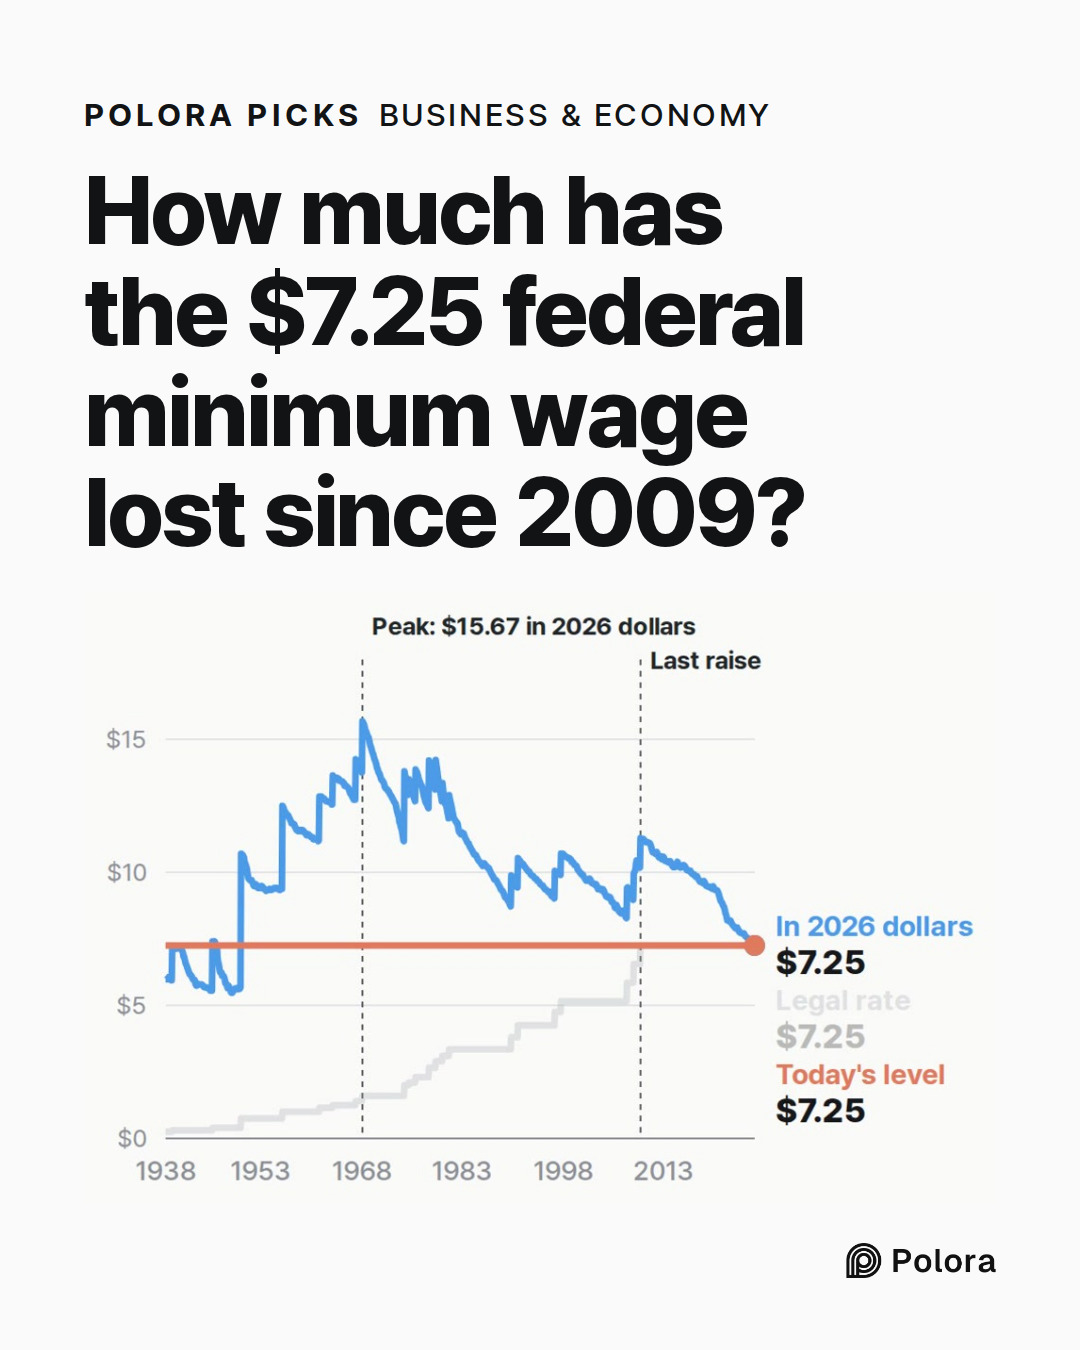
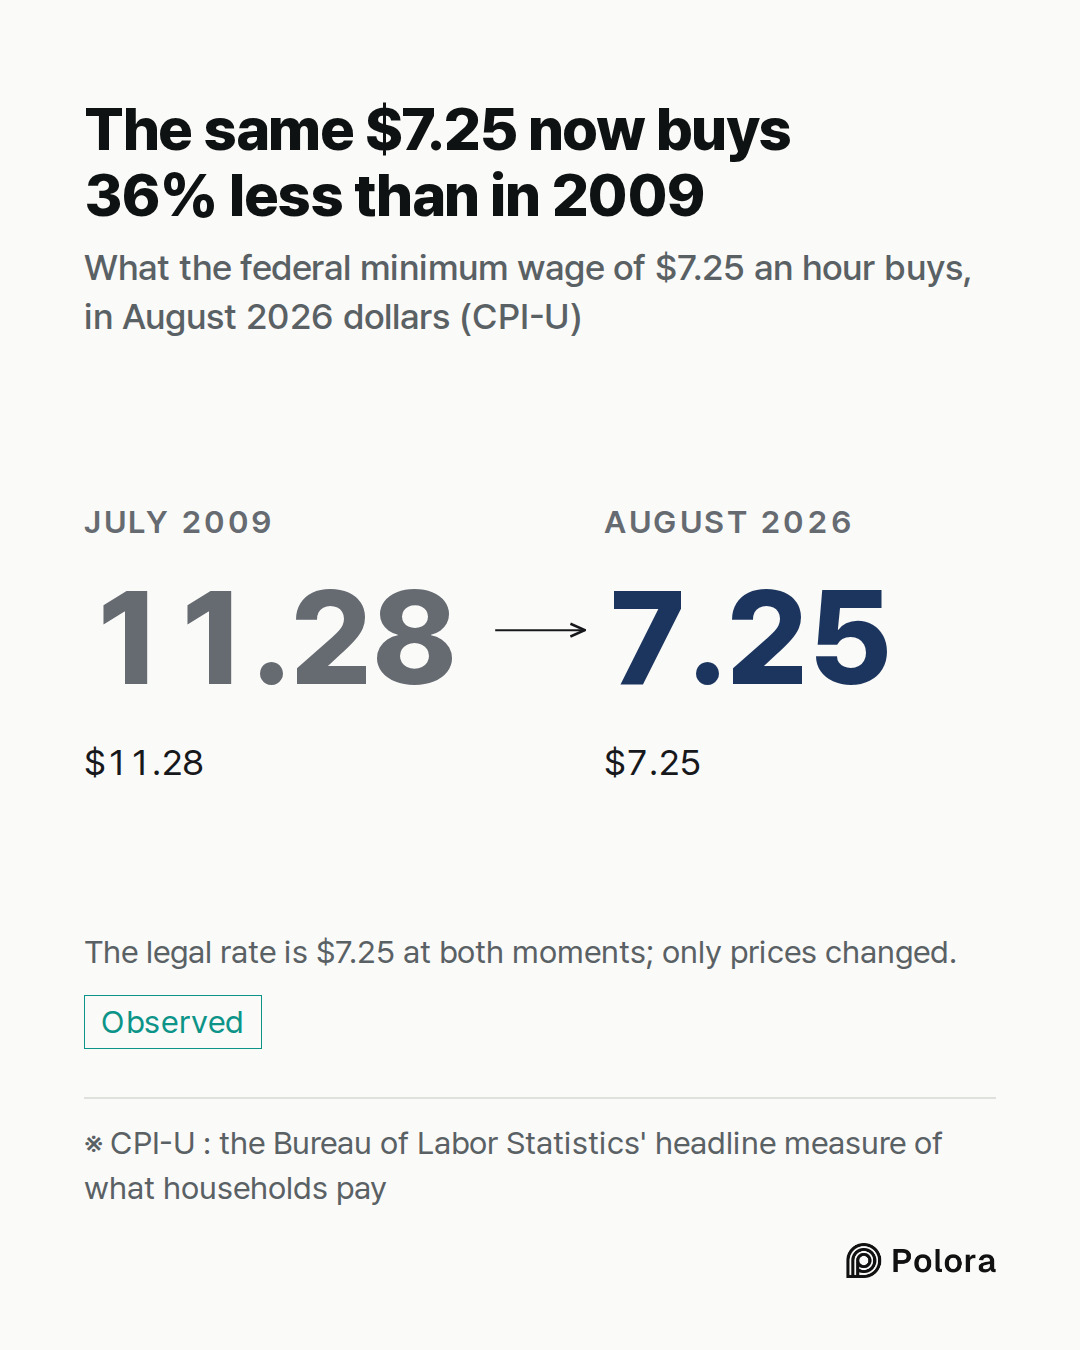
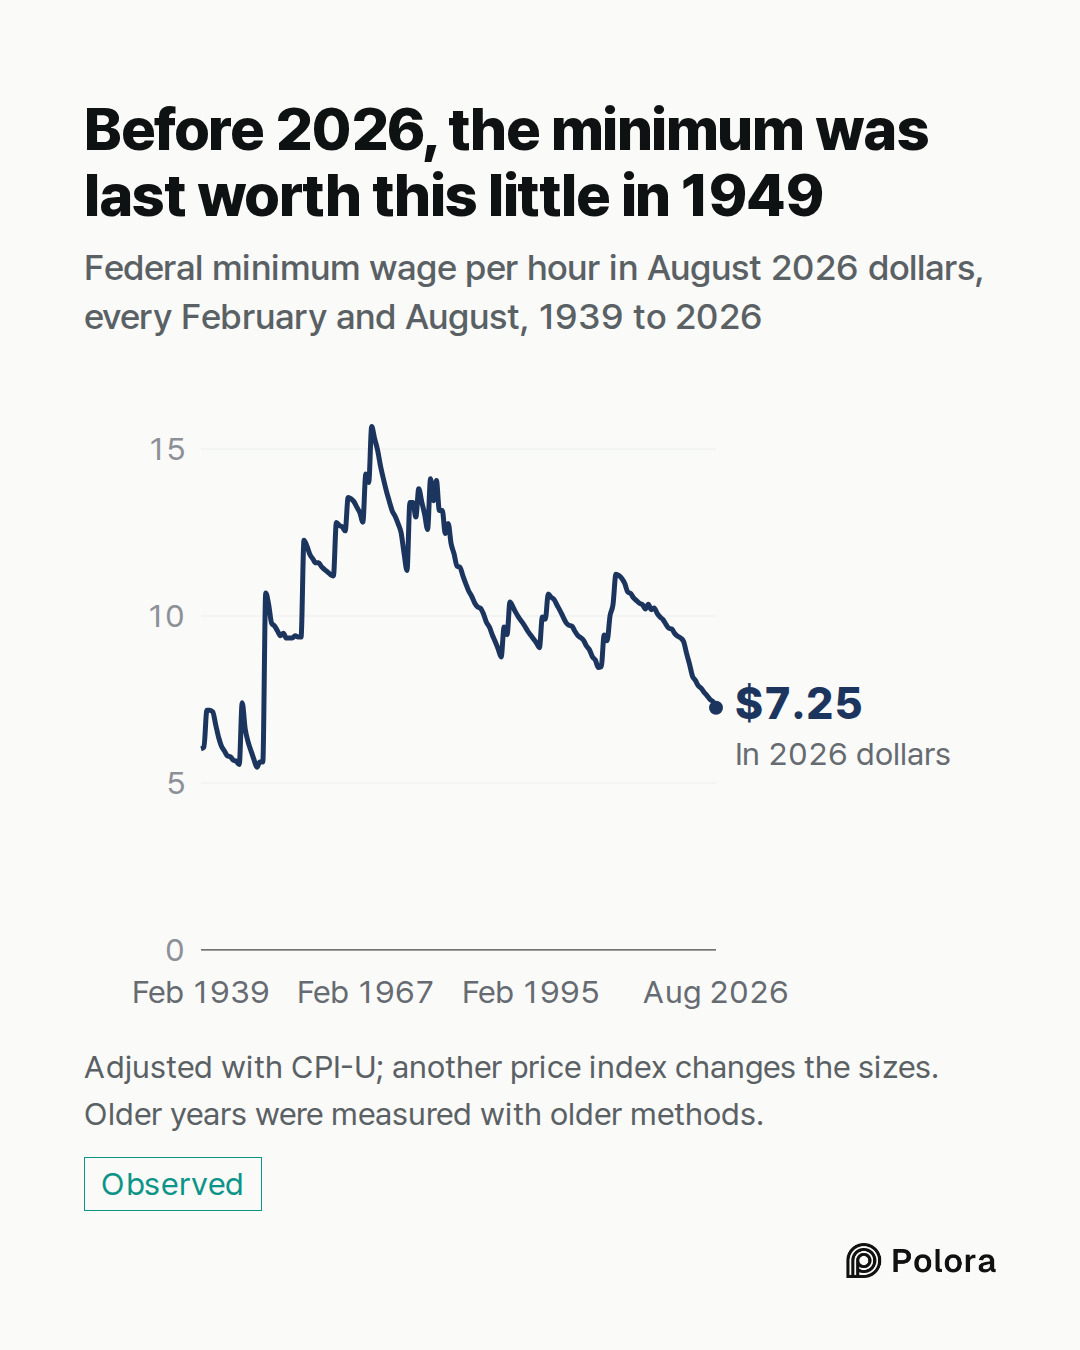
The dollar amount stayed the same, but prices kept rising. Measured at August 2026 prices, the $7.25 of July 2009 was worth $11.28. Today it is worth $7.25, so it has lost 36% of its buying power. Before this year, the last time the federal minimum was worth this little, or less, was 1949. On this measure, every month on record from January 1950, when a raise to 75 cents took effect, to April 2026 was worth more than today. (October 2025 has no price data, as explained below. In May 2026 the value briefly dipped a fraction of a cent below even August's level.)
How the comparison is made
Two lines tell the story. One is the legal rate, in the dollars of each day : 25 cents in 1938, $1.60 in 1968, $7.25 now. The other converts each month's rate into August 2026 dollars, using the Consumer Price Index for All Urban Consumers (CPI-U), the Bureau of Labor Statistics' headline measure of what households pay. A month's rate is multiplied by the price level of August 2026 and divided by the price level of that month. Throughout this piece, "today" means August 2026, the latest month of price data when these figures were prepared; the September figure was scheduled for release on October 14, 2026. Because August 2026 is the base, today's figure is exactly $7.25. Each rate is counted from the month it took effect, so these are monthly figures, not daily ones.
The Bureau of Labor Statistics did not collect or publish the index for October 2025, during the federal government shutdown, so that month is left out; the line simply joins September and November.
A sawtooth, then long freezes
The first federal minimum, set by the Fair Labor Standards Act in October 1938, was 25 cents an hour, about $5.98 at today's prices. From then on the adjusted line moves like a saw blade. Each raise lifts it in one step. Between raises, rising prices mostly wear it back down, month after month. (In a few periods prices fell and it briefly rose again.)
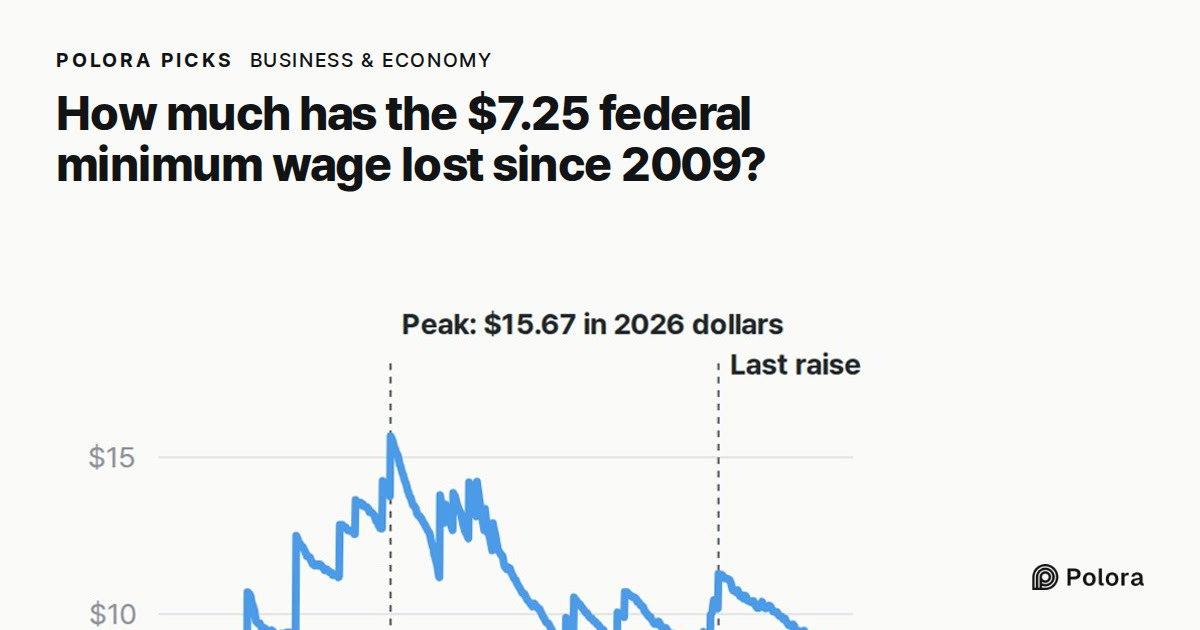
The highest point came in February 1968, when the rate became $1.60. That was worth $15.67 at August 2026 prices, the most of any month on record. Today's $7.25 is 46% of it.
After 1968 the raises came in clusters, separated by long freezes. The rate stayed at $3.35 from January 1981 until it rose to $3.80 in April 1990, 111 months. It stayed at $5.15 from September 1997 until July 2007, 118 months, the record until now. That freeze ended with the Fair Minimum Wage Act of 2007, passed as part of an emergency spending law signed in May 2007, which raised the floor in three yearly steps : $5.85 in July 2007, $6.55 in July 2008 and $7.25 in July 2009. That last step is the most recent raise.
Why it does not keep up
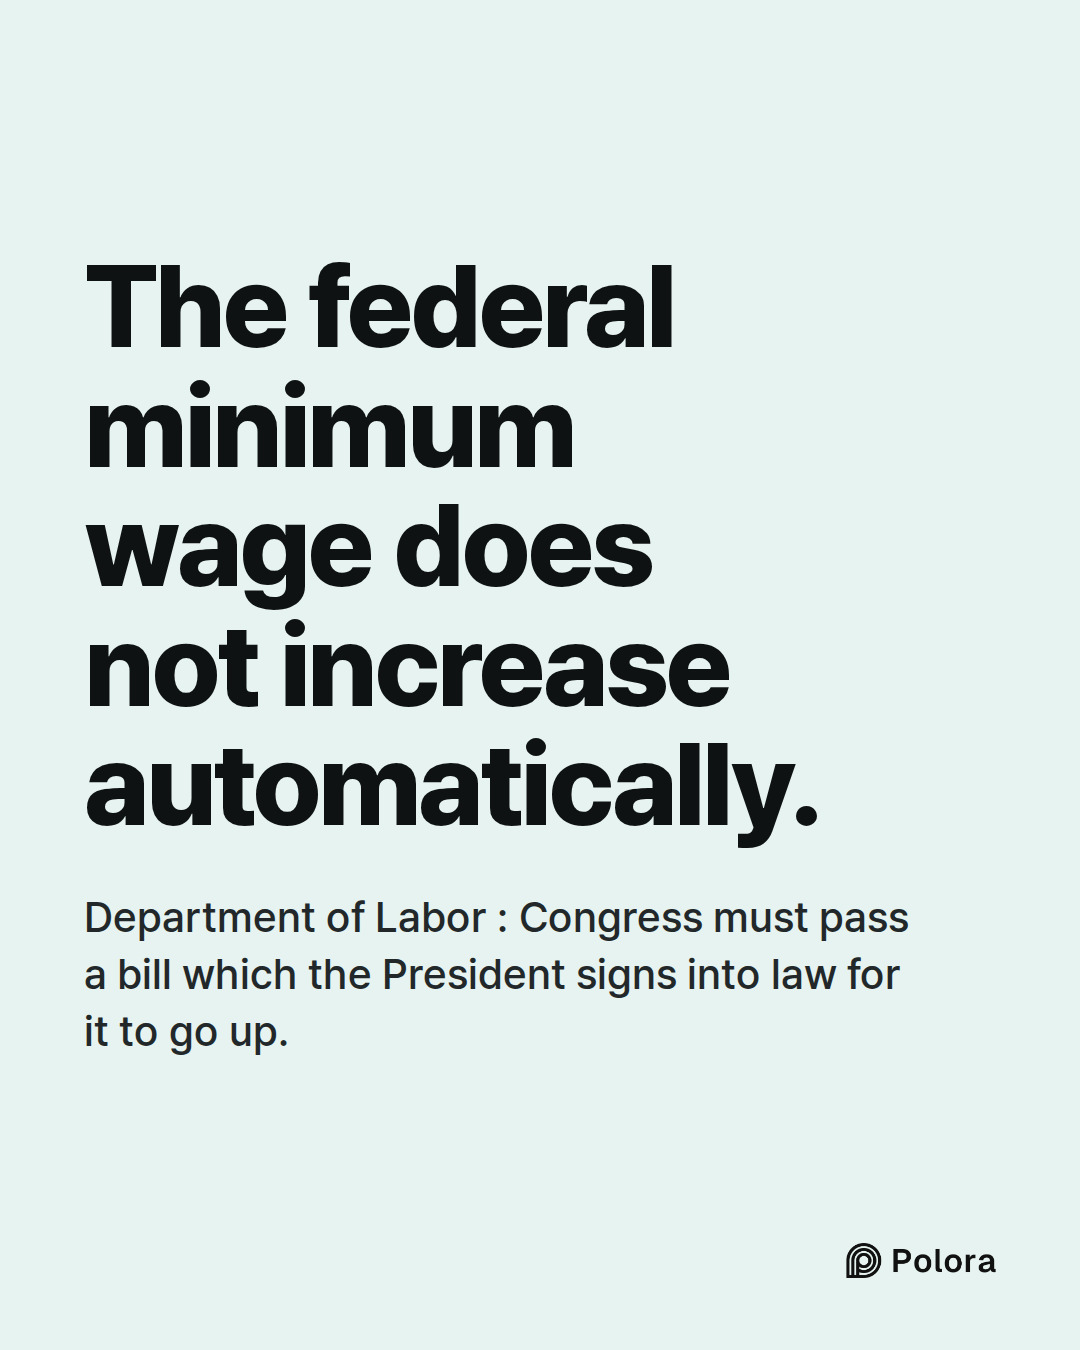
The federal minimum is a fixed number written into law, not a formula. The Department of Labor puts it plainly : the minimum wage does not increase automatically, and Congress must pass a bill which the President signs into law for it to go up. Since the last of the 2007 law's steps took effect in July 2009, every rise in prices has come straight out of its value.
The chart shows a sequence, not a cause. It does not say why Congress has not acted, and this piece does not either.
Where the federal floor still applies
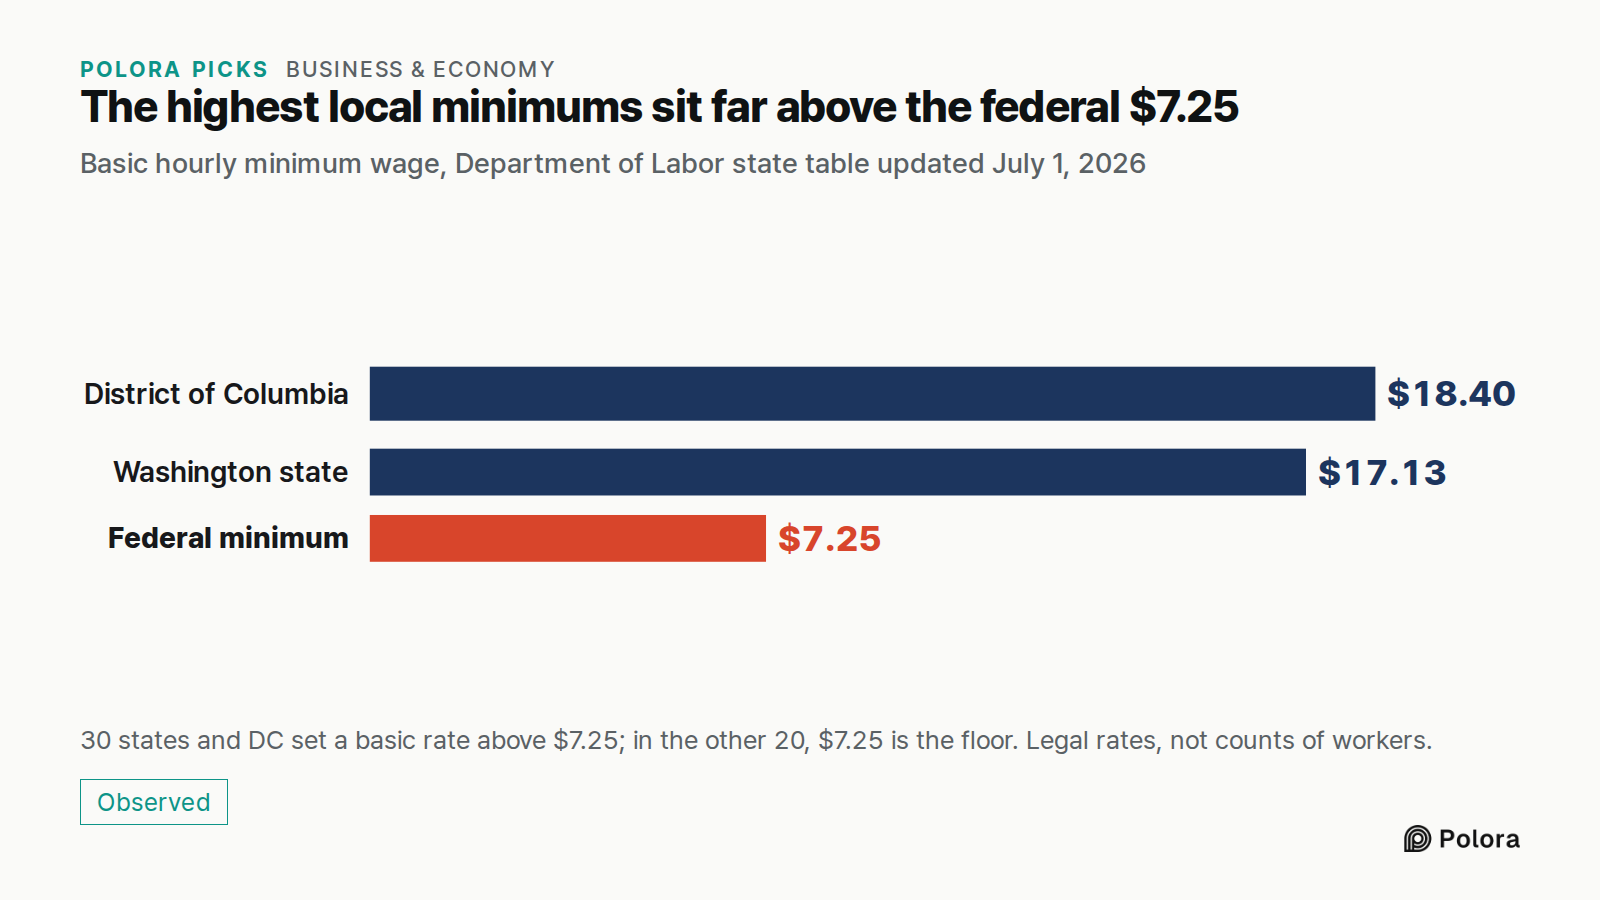
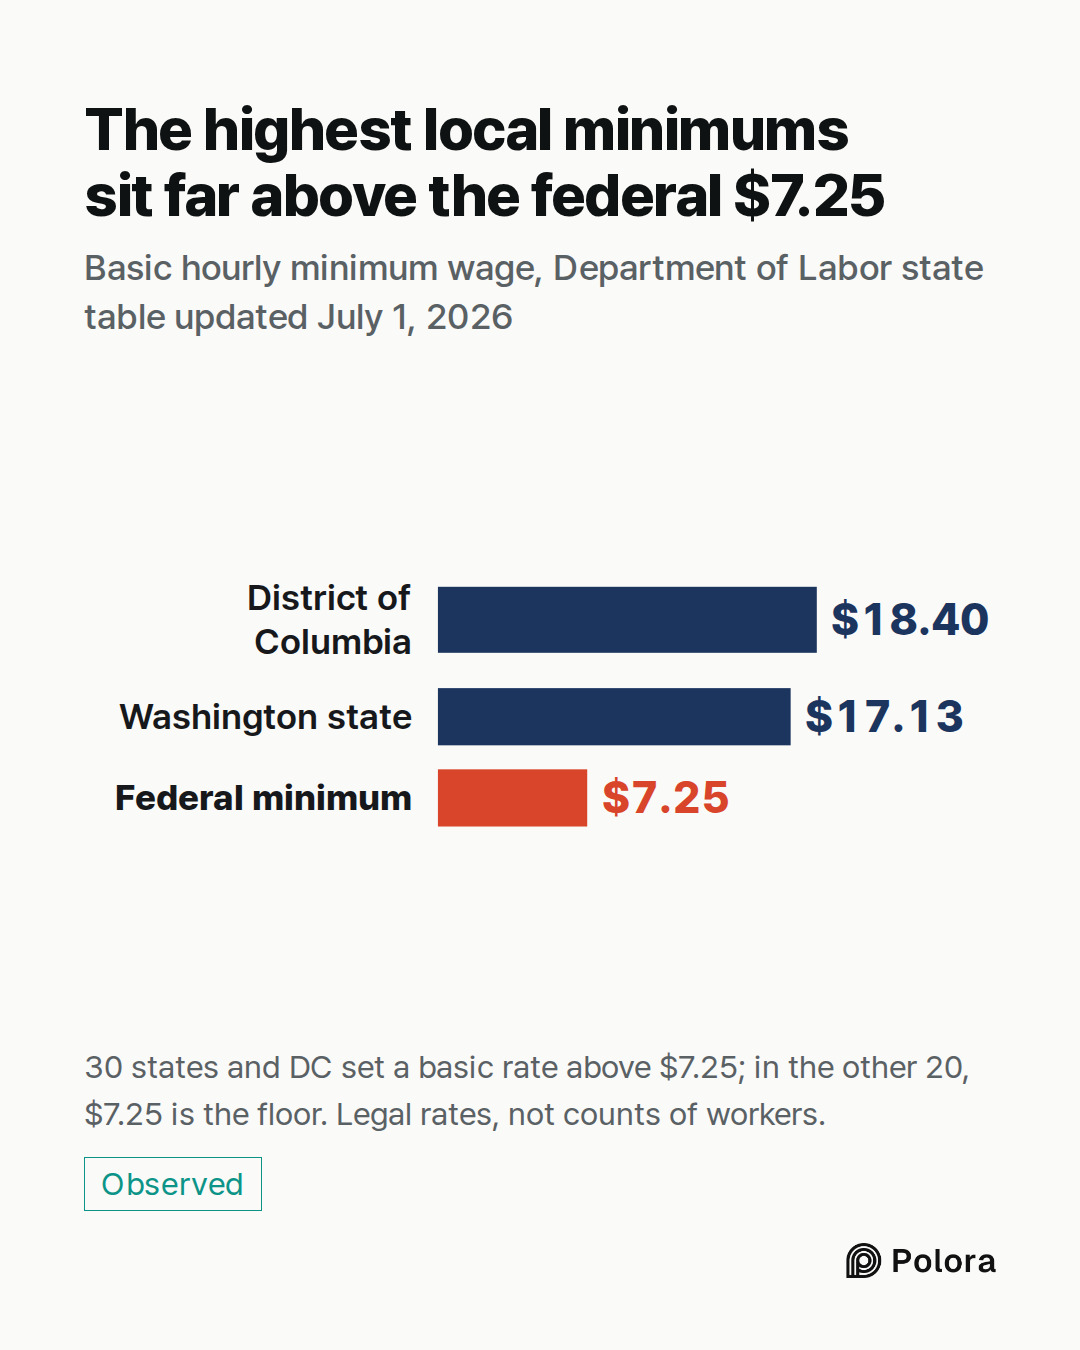
Many states set a higher rate. Where an employee is covered by both a state and the federal law, the higher minimum applies. According to the Department of Labor's state table, updated July 1, 2026, 30 states and the District of Columbia set a basic minimum above $7.25; the highest are the District of Columbia at $18.40 and Washington state at $17.13. In some of those states the higher rate does not cover every employer, and some cities and counties set rates above their state's.
In the other 20 states, the state has no minimum wage of its own, or one that is not above $7.25, so the federal $7.25 is the floor for jobs the federal law covers, apart from the exceptions it allows. These are legal rates; the state table does not count how many people actually earn them. Georgia and Wyoming, for example, list a state rate of $5.15, but employers covered by the federal law must pay $7.25.
For scale : $7.25 an hour for 40 hours a week, 52 weeks a year, comes to $15,080 before taxes. Some workers can legally be paid less in cash wages. Under federal law, an employer can pay a worker who regularly receives more than $30 a month in tips, and keeps all of them, as little as $2.13 an hour directly, as long as tips bring the total to at least $7.25; if they do not, the employer must make up the difference. Some states set their own, higher rules for tipped workers, and where they do, the worker gets the better terms. Federal law also has narrower exceptions for some young workers, students and workers with disabilities.
How sure are these numbers?
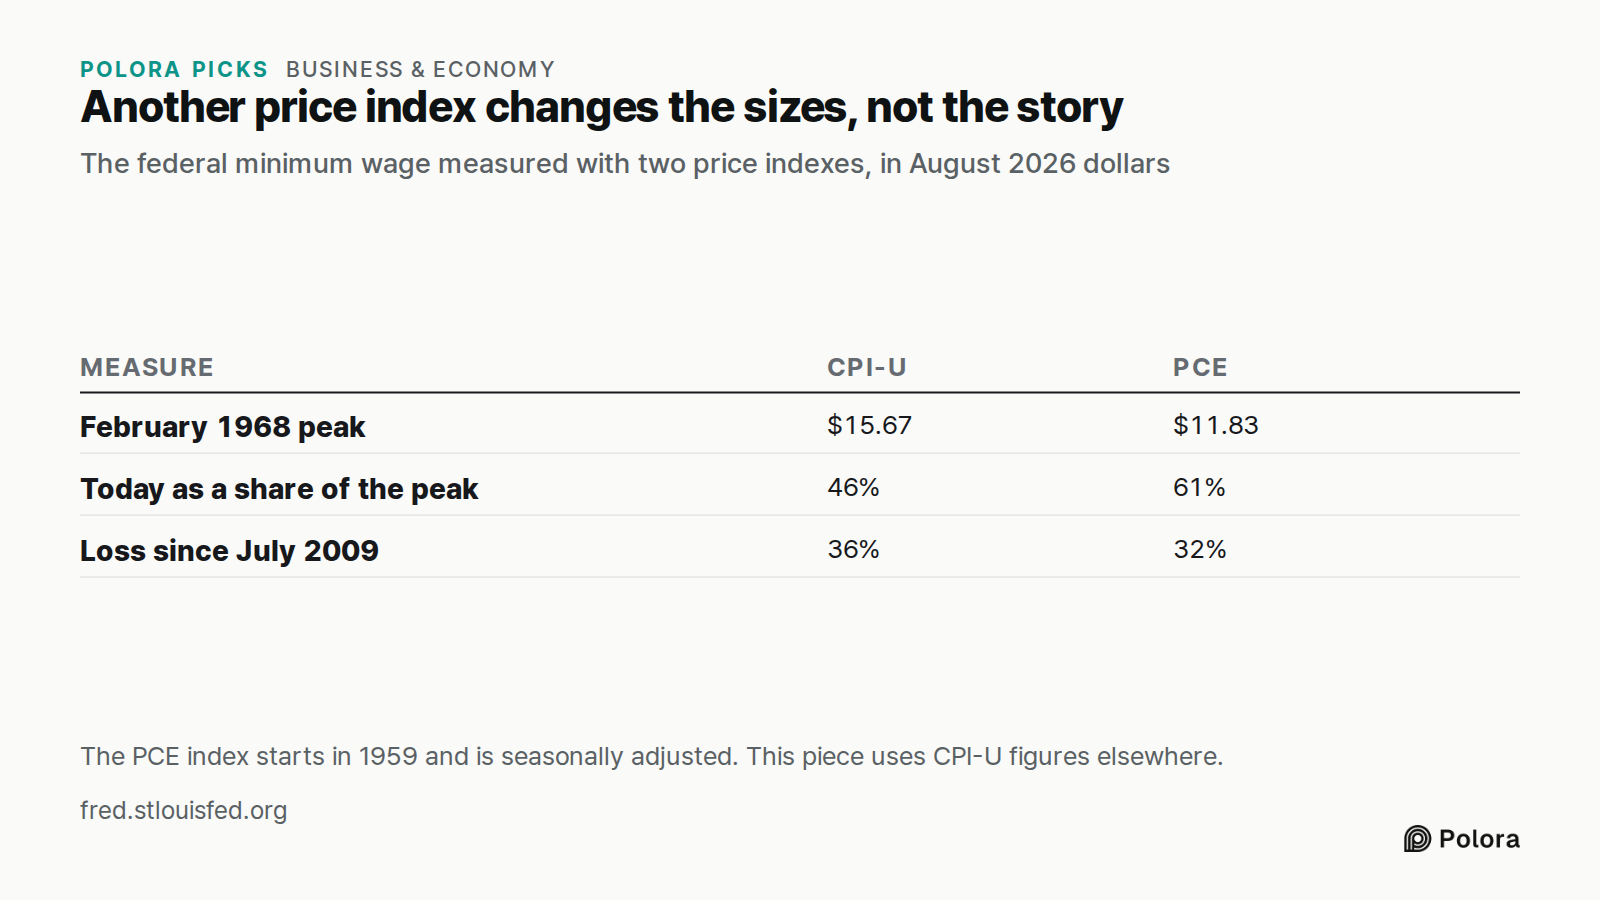
The legal rates come from the Department of Labor's history table and match its monthly series. The adjusted values depend on the price index chosen. With a different one, the Commerce Department's price index for personal consumption expenditures (PCE), which starts in 1959, the story keeps its shape but the sizes change. (That index is also seasonally adjusted, while the CPI-U series used here is not.) February 1968 is still the peak, but it is worth $11.83 instead of $15.67, so today's wage is 61% of the peak rather than 46%. The loss since 2009 is 32% instead of 36%. And with this index too, no month from 1959 through 2025 was as low as today. The $15.67 and 36% figures in this piece are CPI-U figures.
There is a second reason to hold the older numbers a little loosely. The Bureau of Labor Statistics improves its methods over time but does not revise the official historical index to include those improvements, so prices in the 1960s and 1970s were not measured the way they are today.
Coverage also changed. In 1938 the law applied mostly to workers in interstate commerce, and it was extended to retail, services, hospitals, schools and farms over the following decades. The series here follows the rate for workers covered since 1938. In February 1968, workers newly brought in by the 1966 amendments had a lower minimum, $1.15; their rate rose in steps until, in 1978, all covered, nonexempt workers got the same minimum.
- [US Department of Labor, via FRED: Federal Minimum Hourly Wage for Nonfarm Workers (FEDMINNFRWG)]
- [US Bureau of Labor Statistics, via FRED: Consumer Price Index for All Urban Consumers, all items, not seasonally adjusted (CPIAUCNS)]
- [US Bureau of Economic Analysis, via FRED: Personal Consumption Expenditures Chain-type Price Index (PCEPI)]
- [US Department of Labor: History of Federal Minimum Wage Rates Under the Fair Labor Standards Act, 1938–2009]
- [US Department of Labor: Questions and Answers About the Minimum Wage]
- [US Department of Labor: State Minimum Wage Laws (updated July 1, 2026)]
- [US Bureau of Labor Statistics: 2025 federal government shutdown impact on the Consumer Price Index]
- [US Bureau of Labor Statistics: R-CPI-U-RS, the CPI research series using current methods]
![Sources 8 : fred.stlouisfed.org · [US Department of Labor, via FRED: Federal Minimum Hourly Wage for Nonfarm Workers (FEDMINNFRWG)], fred.stlouisfed.org · [US Bureau of Labor Statistics, via FRED: Consumer Price Index for All Urban Consumers, all items, not seasonally adjusted (CPIAUCNS)], fred.stlo](https://media.cdn.polora.ai/picks/2026/10/pickrun_a092495b0b0f4467/fsJUzUnWI2ko6ph_-slide-07--how-much-has-the.jpg)