How do free mobile games make money when almost nobody pays?

Largely from a tiny group of big spenders, plus ads. In a 2016 study of tens of millions of players, 1.9 percent bought anything in a month, and 0.19 percent brought in 48 percent of purchase revenue. Ads earn from many who never pay, and the mix varies by game.

Business & Economy · 2026-10-07

Who actually pays for a free game?

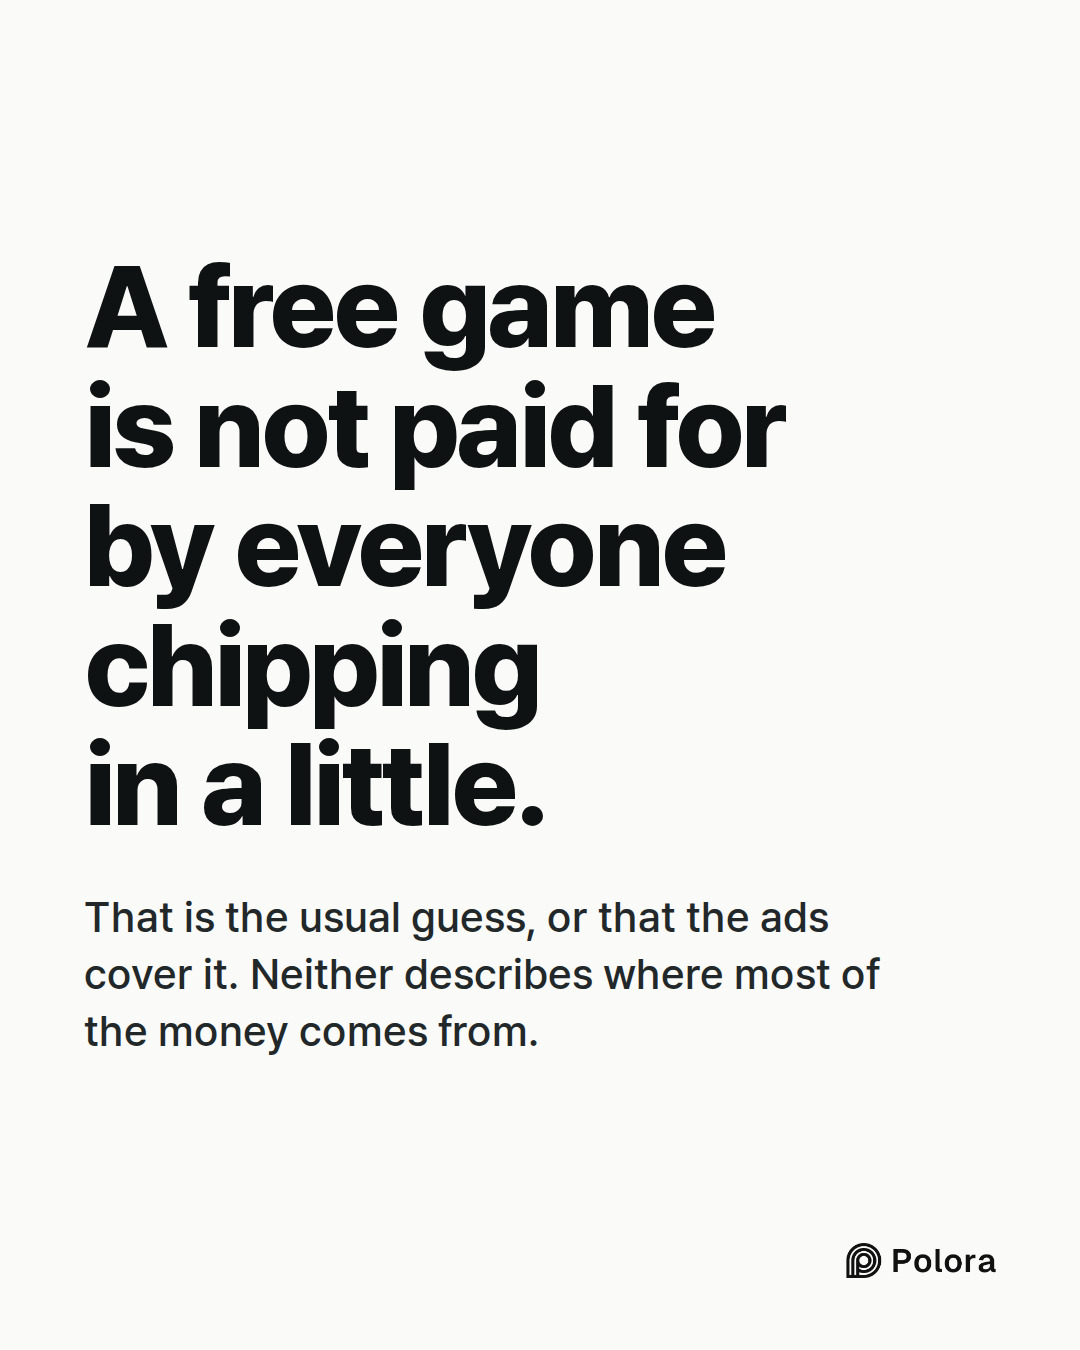
Ask most people how a free game on their phone pays its bills and they will give one of two answers. Lots of players each spend a little, a dollar here and there. Or the ads cover it. Both answers sound sensible. Neither describes where most of the money comes from.

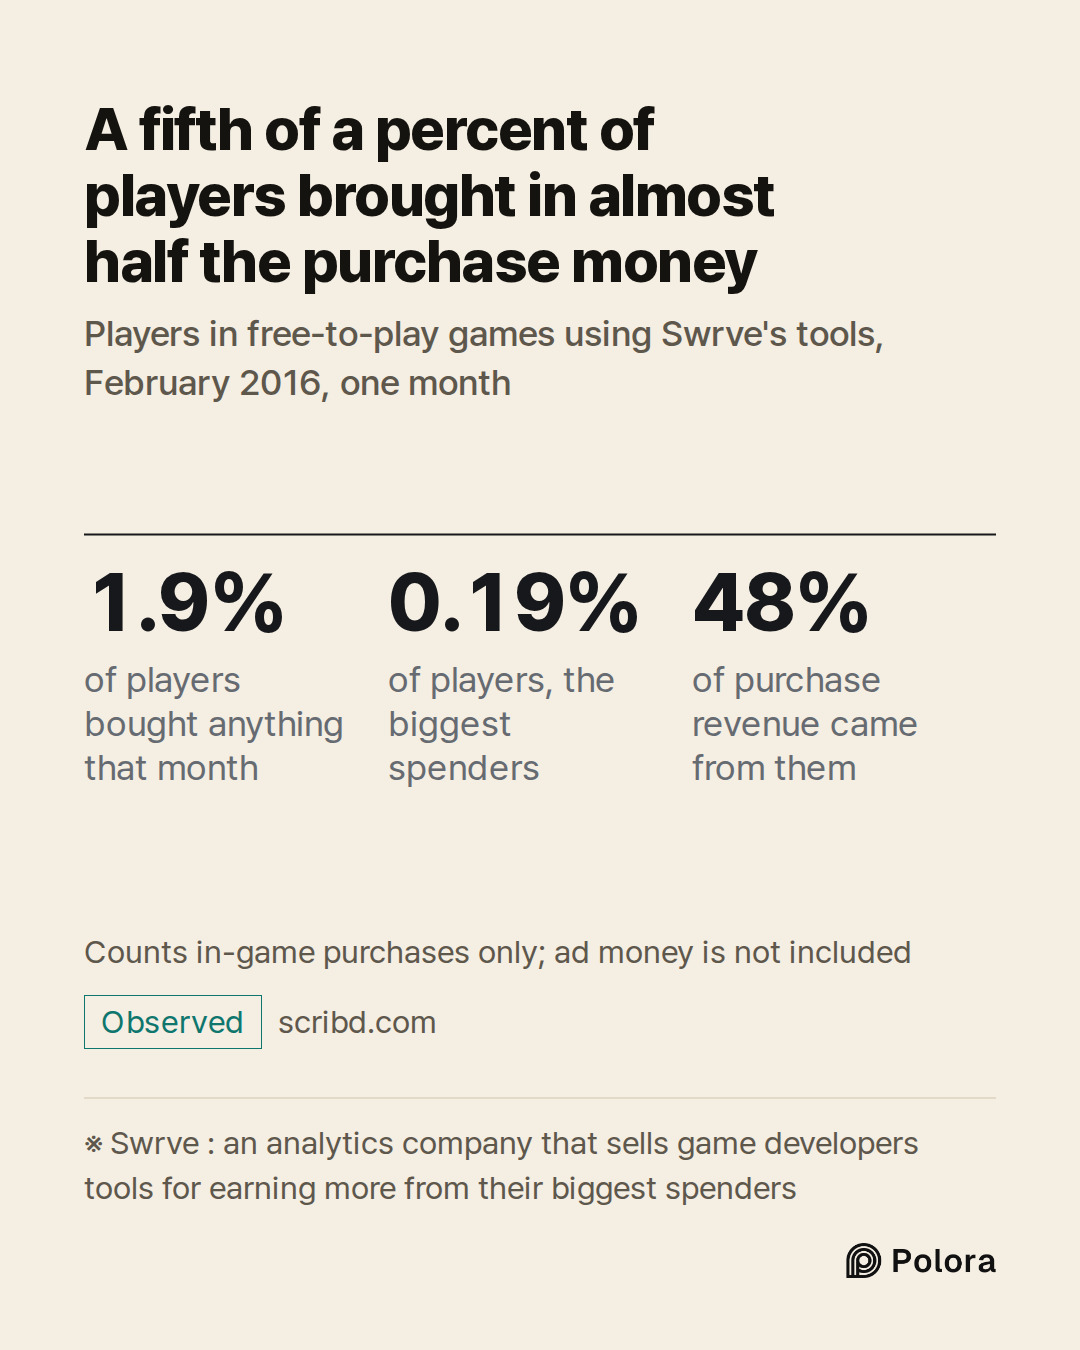
In February 2016 the analytics company Swrve measured the purchases of tens of millions of players in the free-to-play games that use its tools. Only 1.9 percent of players bought anything with real money that month. The other 98 in every 100 played for free.

The money was even more lopsided than the players. The top tenth of those payers, about 0.19 percent of all players, brought in 48 percent of the money spent on in-game purchases. Put another way, in a game with 10,000 players, about 190 pay something in a month, and about 19 of them bring in almost half of the purchase revenue. That is half of the purchase money, not half of everything the game earns, because ad money is not counted.
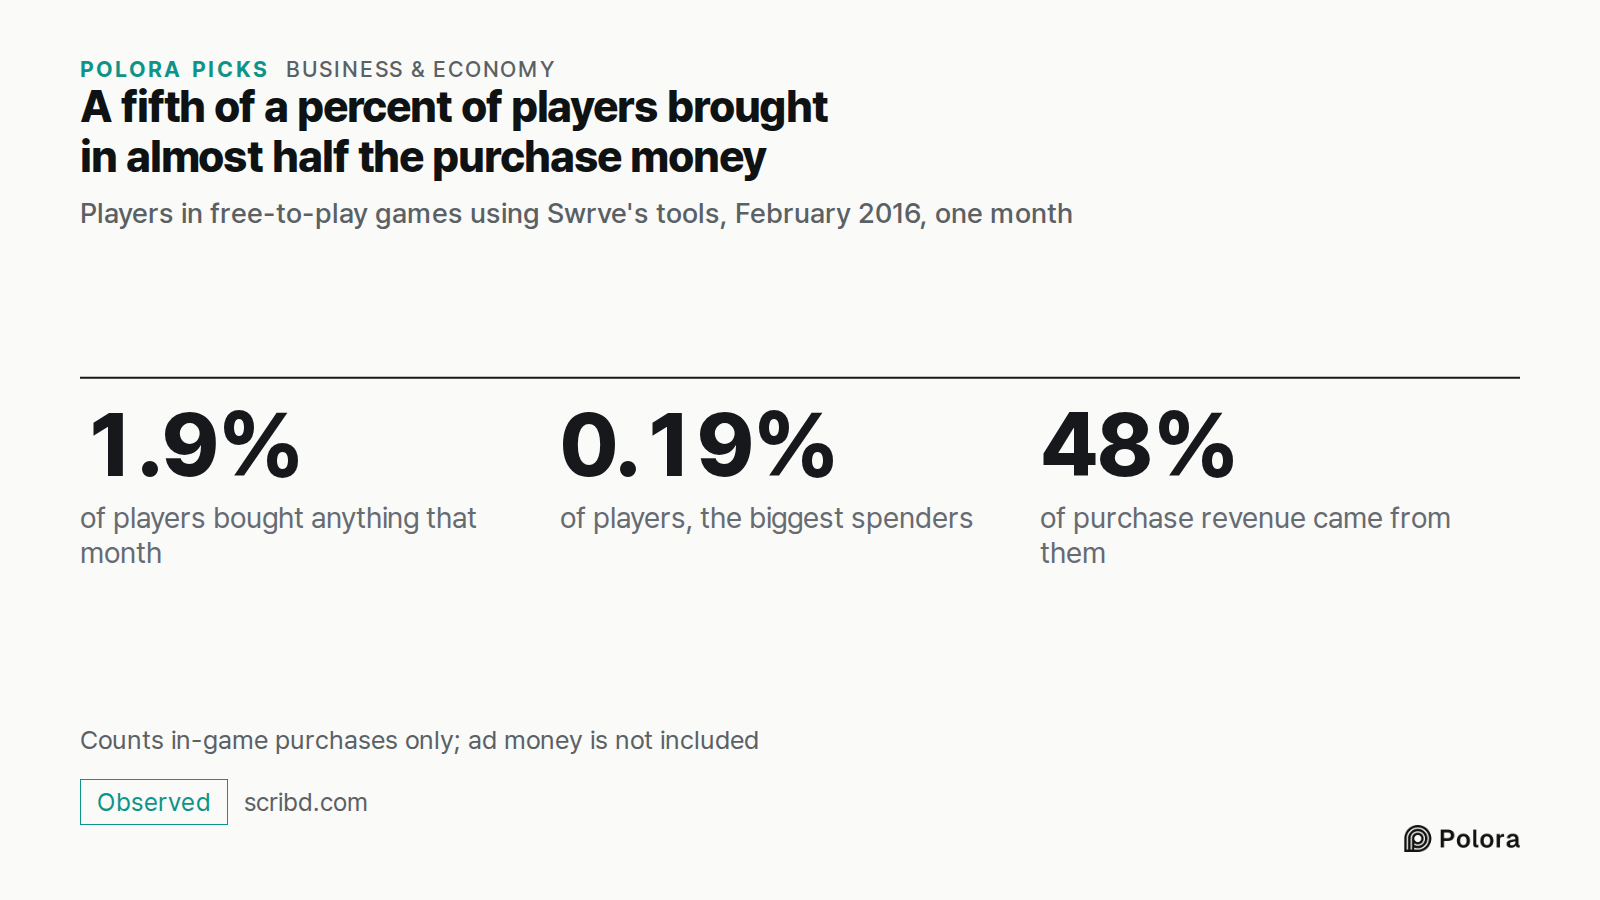
A fifth of a percent of players brought in almost half the purchase money · Players in free-to-play games using Swrve's tools, February 2016, one month · 1.9% · 0.19% · 48% · of players bought anything that month · of players, the biggest spenders · of purchase revenue came from them · Counts in-gam
Players in free-to-play games using Swrve's tools, February 2016, one month

Most players who pay buy just once a month

The few who pay are not a steady crowd either. In the same 2016 sample, 64 percent of paying players made a single purchase in the month, and by the report's own chart only 6.5 percent made five or more.

So a free game's purchase revenue rests on a thin layer inside a thin layer. The industry calls its biggest spenders whales. The word describes how much a player spends, not why. Heavy spending by itself says nothing about whether any one person has a problem, and the figures here do not measure that.
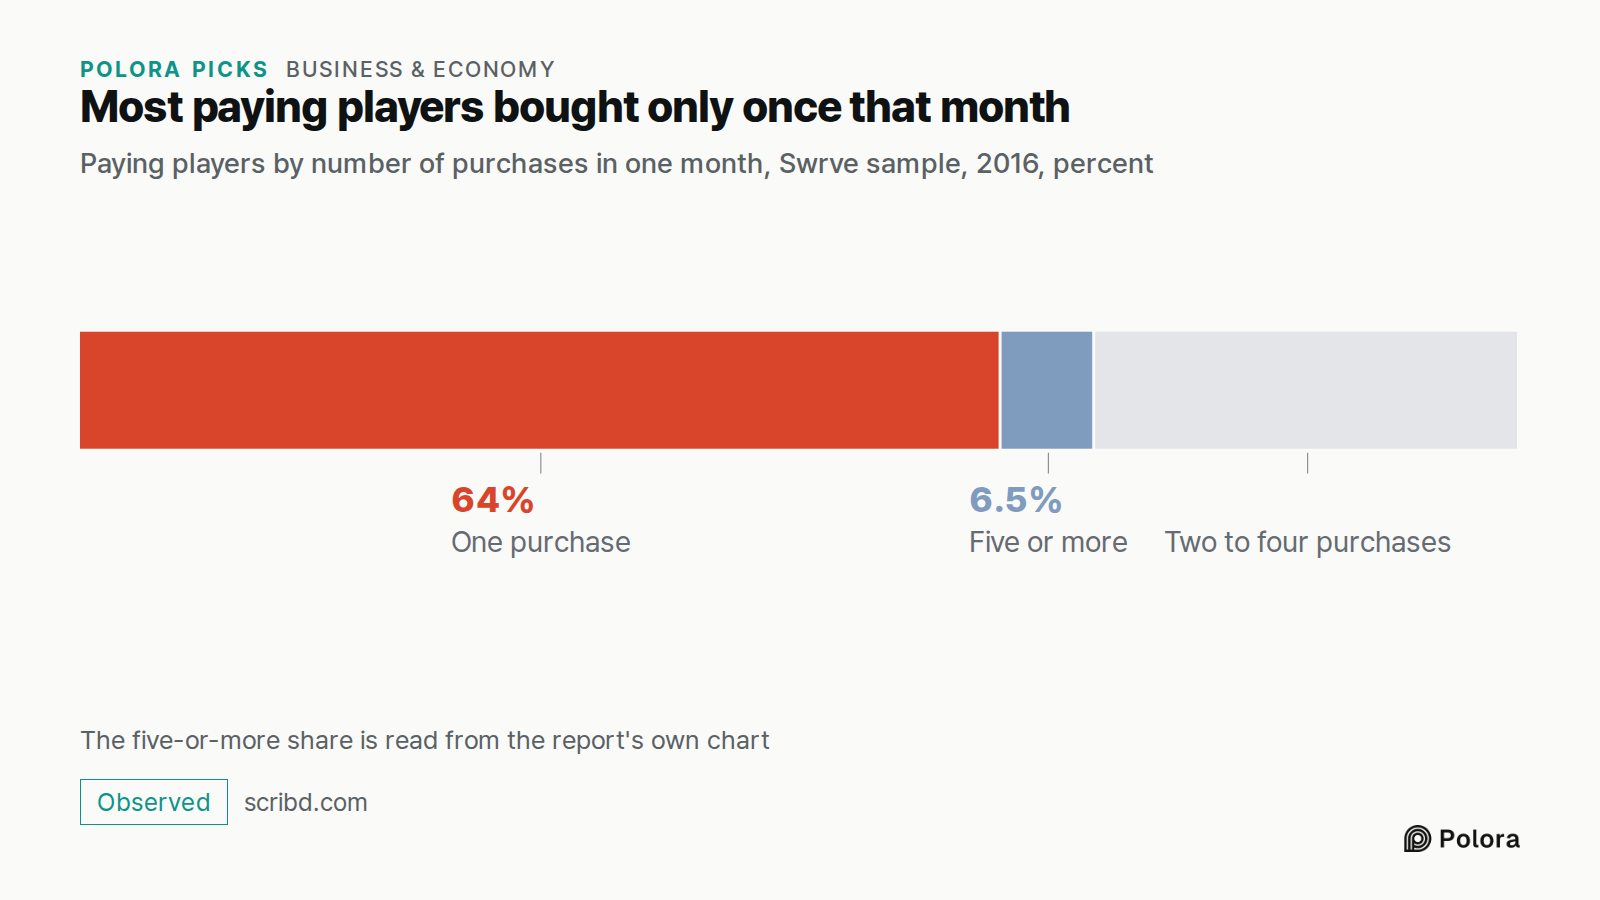
Most paying players bought only once that month · Paying players by number of purchases in one month, Swrve sample, 2016, percent · One purchase · Five or more · 64% · 6.5% · Two to four purchases · The five-or-more share is read from the report's own chart
Paying players by number of purchases in one month, Swrve sample, 2016, percent

Is a 2016 number still worth repeating?

The figure is a decade old, and it has limits worth knowing. It comes only from games that used one analytics company, and that company sells developers tools for earning more from exactly these spenders. It counts payers in a single month rather than over a player's lifetime, and it covers in-game purchases only, not ad money. It is the best-known measurement, not an audited one.

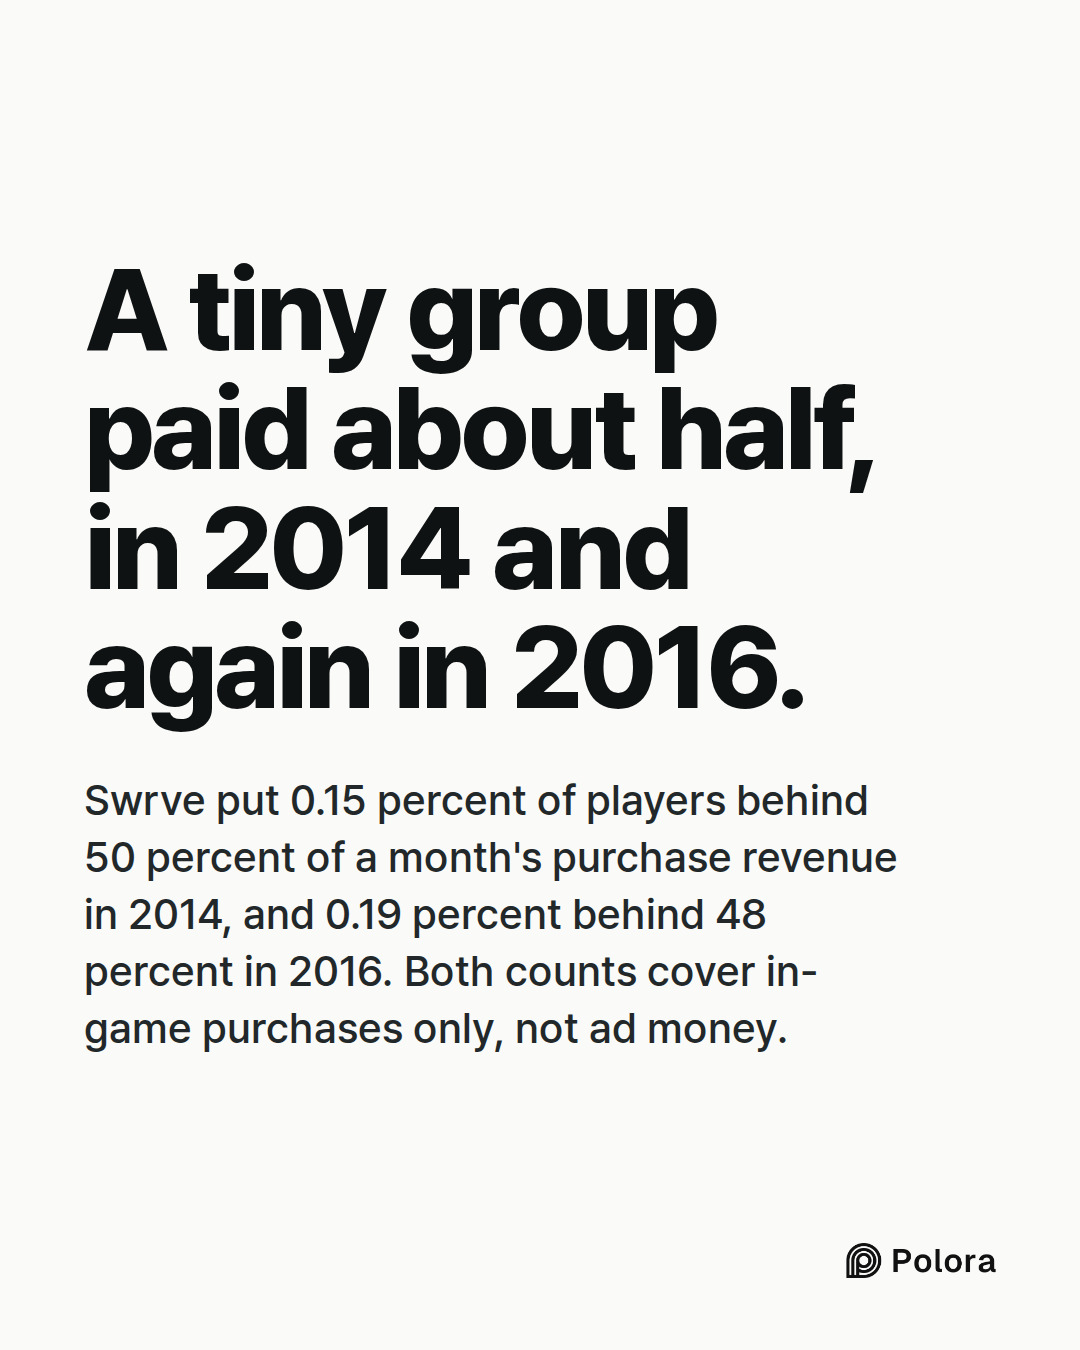
Swrve's earlier report found a similar shape. In 2014 it put 0.15 percent of players behind 50 percent of a month's purchase revenue. The exact share shifts from report to report, and with the period each one covers, but each time the group is tiny.

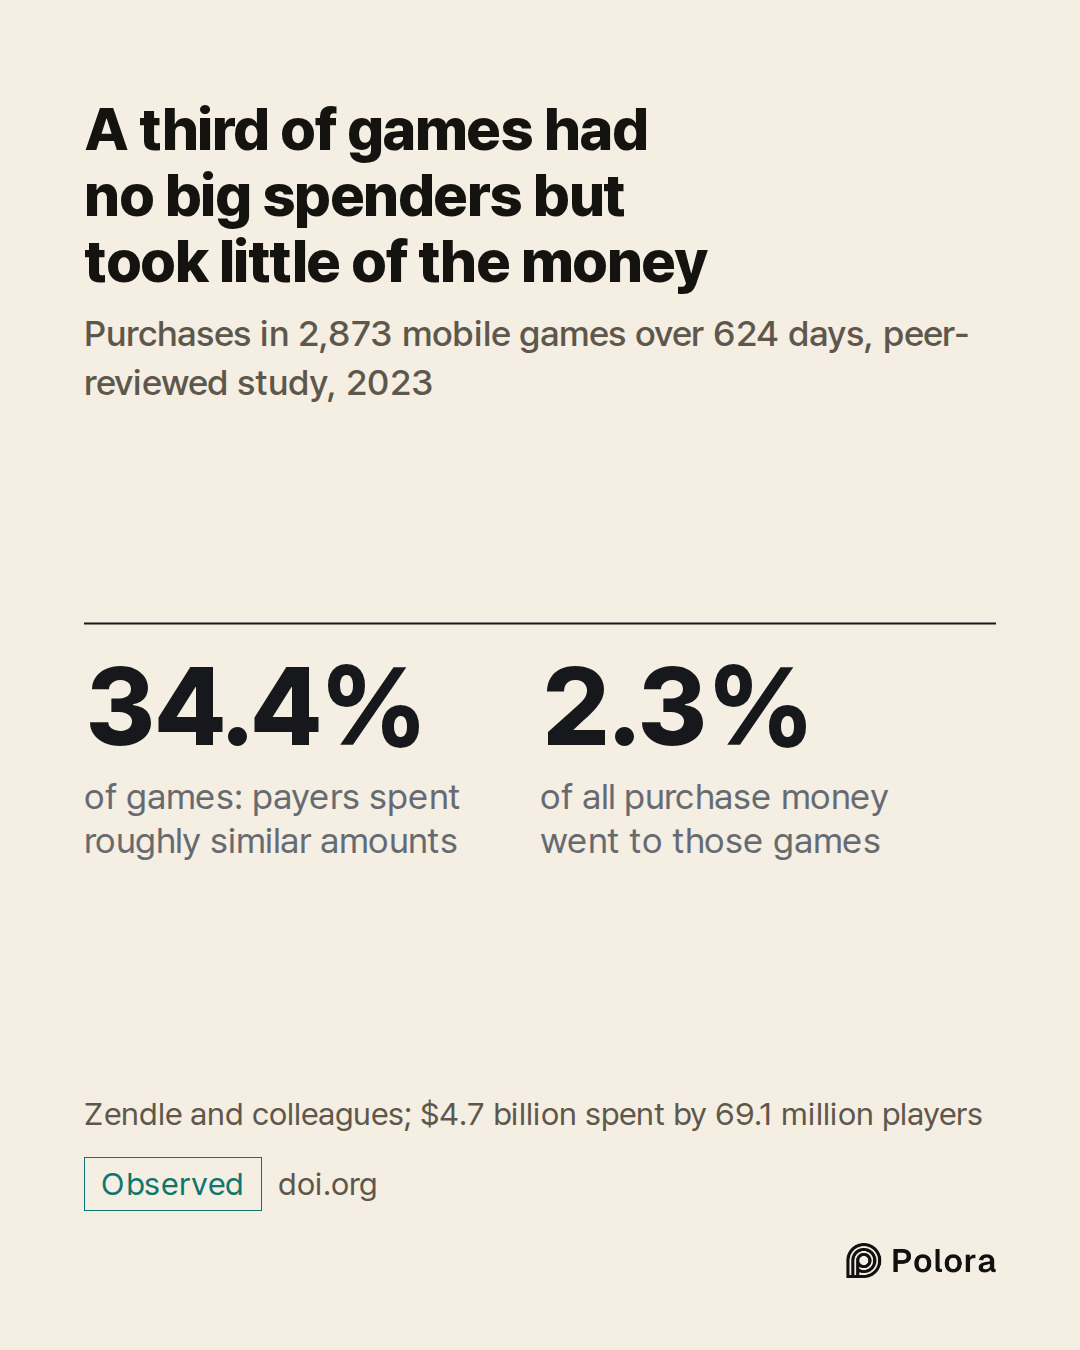
A broader check came in 2023. A peer-reviewed study by Zendle and colleagues followed $4.7 billion of purchases by 69.1 million players in 2,873 mobile games over 624 days, and found that games differ. In 34.4 percent of them, the players who paid spent roughly similar amounts, with no small group of big spenders. Those games together took in only 2.3 percent of the purchase money. So not every free game depends on a few big spenders, but most of the purchase money flows to games where spending is uneven.

The size of the business has only grown. The market research firm Sensor Tower puts what players worldwide spent inside mobile games in 2024 at $82 billion, up 4 percent on the year before, even as downloads fell 7 percent to 49 billion. Fewer downloads and more spending point to a business that leans on earning more from the players it already has.
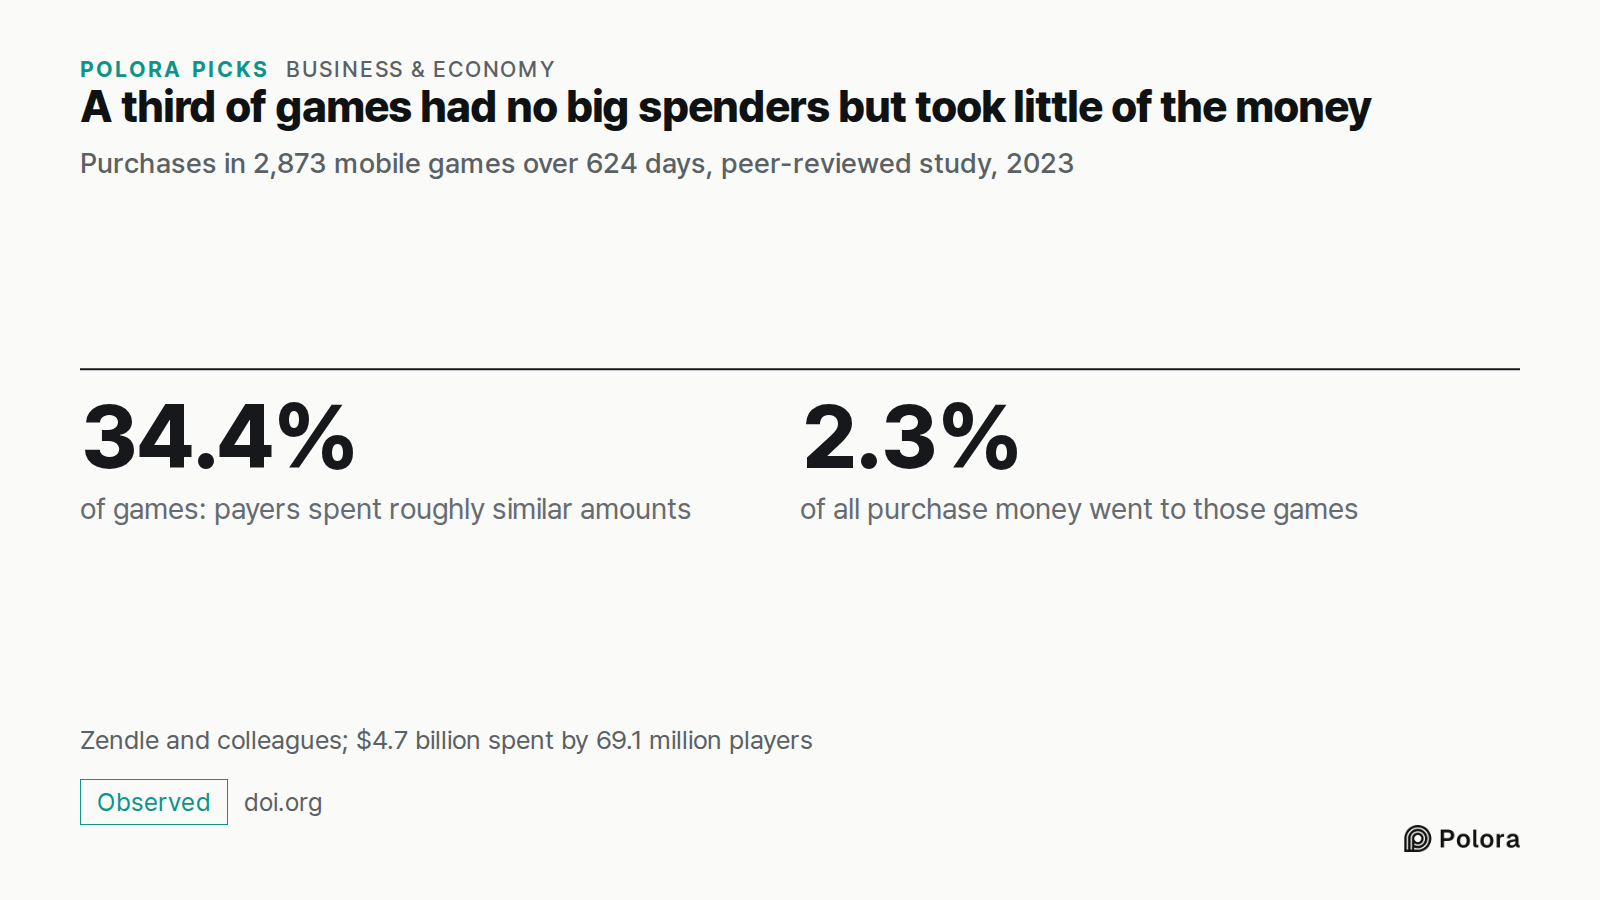
A third of games had no big spenders but took little of the money · Purchases in 2,873 mobile games over 624 days, peer-reviewed study, 2023 · 34.4% · 2.3% · of games: payers spent roughly similar amounts · of all purchase money went to those games · Zendle and colleagues; $4.7 billion spent by 69.1
Purchases in 2,873 mobile games over 624 days, peer-reviewed study, 2023

What the players who never pay are worth

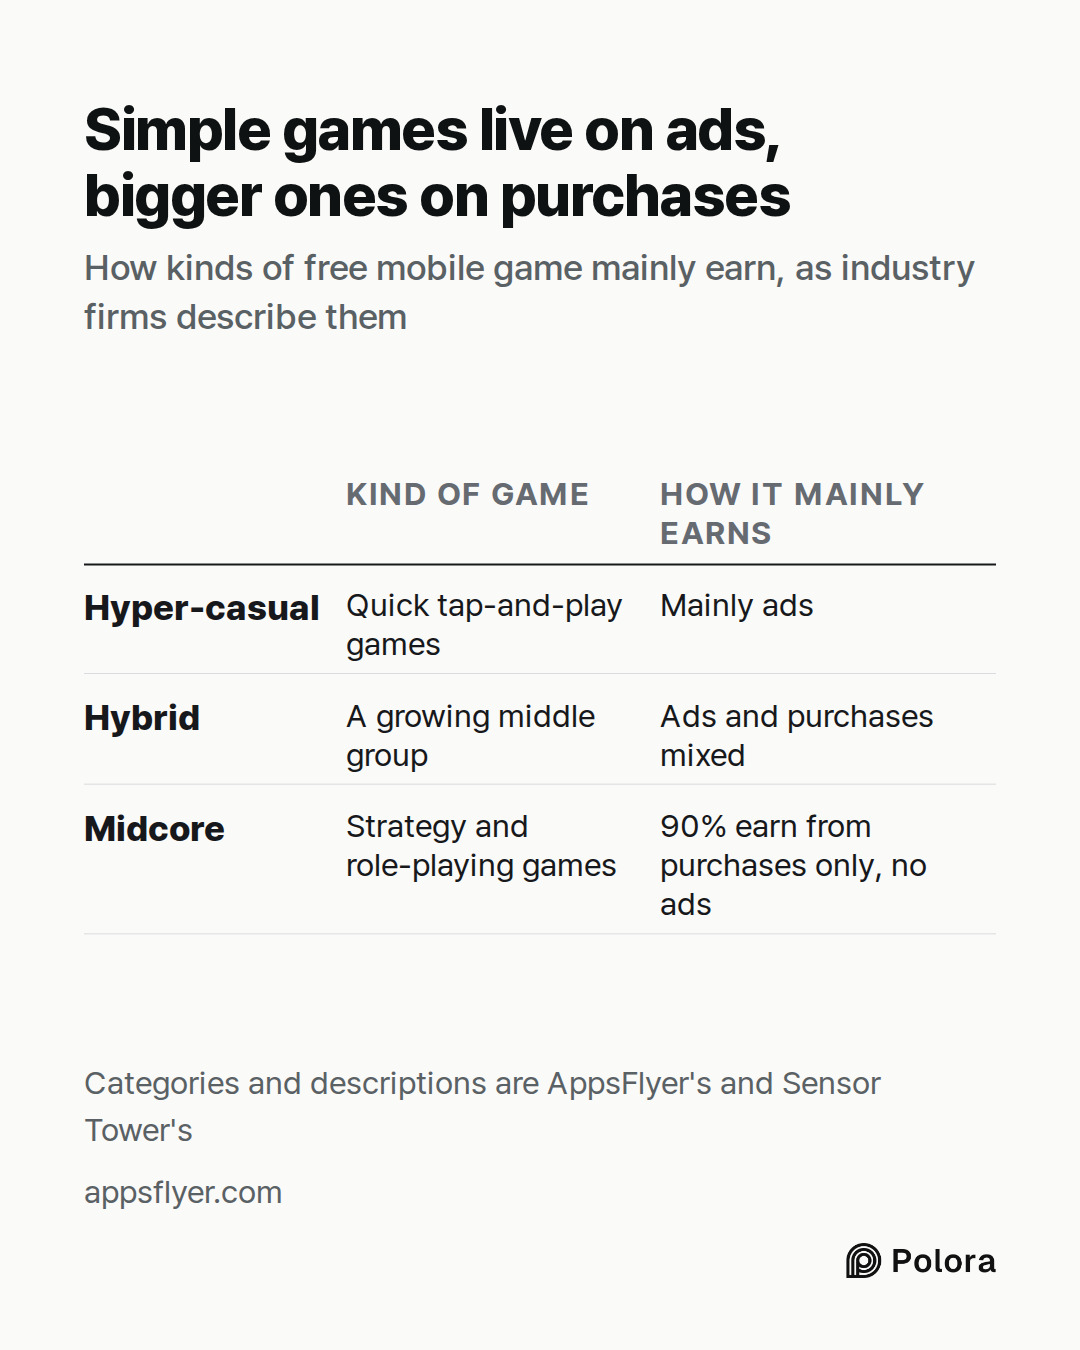
The other 98 percent are not a loss. Many free games show ads, and the simplest ones, the quick tap-and-play games the industry calls hyper-casual, rely mainly on them. The analytics firm AppsFlyer describes hyper-casual as an ad-reliant category. Bigger strategy and role-playing games lean the other way. The industry files many of them under midcore, and in AppsFlyer's 2026 report 90 percent of midcore games earn from purchases only, with no ads. A growing middle group mixes the two, and Sensor Tower counts these hybrid games among the fastest growing in 2024, with their purchase revenue up 37 percent.

Non-payers also matter in a way that is harder to count. Game makers argue that a multiplayer game needs a full world to be worth paying for. There must be opponents to beat, teammates to join and rankings to climb. In that view, the free player is part of what the paying player is buying. It is the industry's own reasoning rather than a measured fact, but it explains why games work so hard to keep people playing who will never spend a cent. Not every non-payer brings in something, though. In a game with no ads and no shared world to fill, someone who never pays earns its maker nothing.
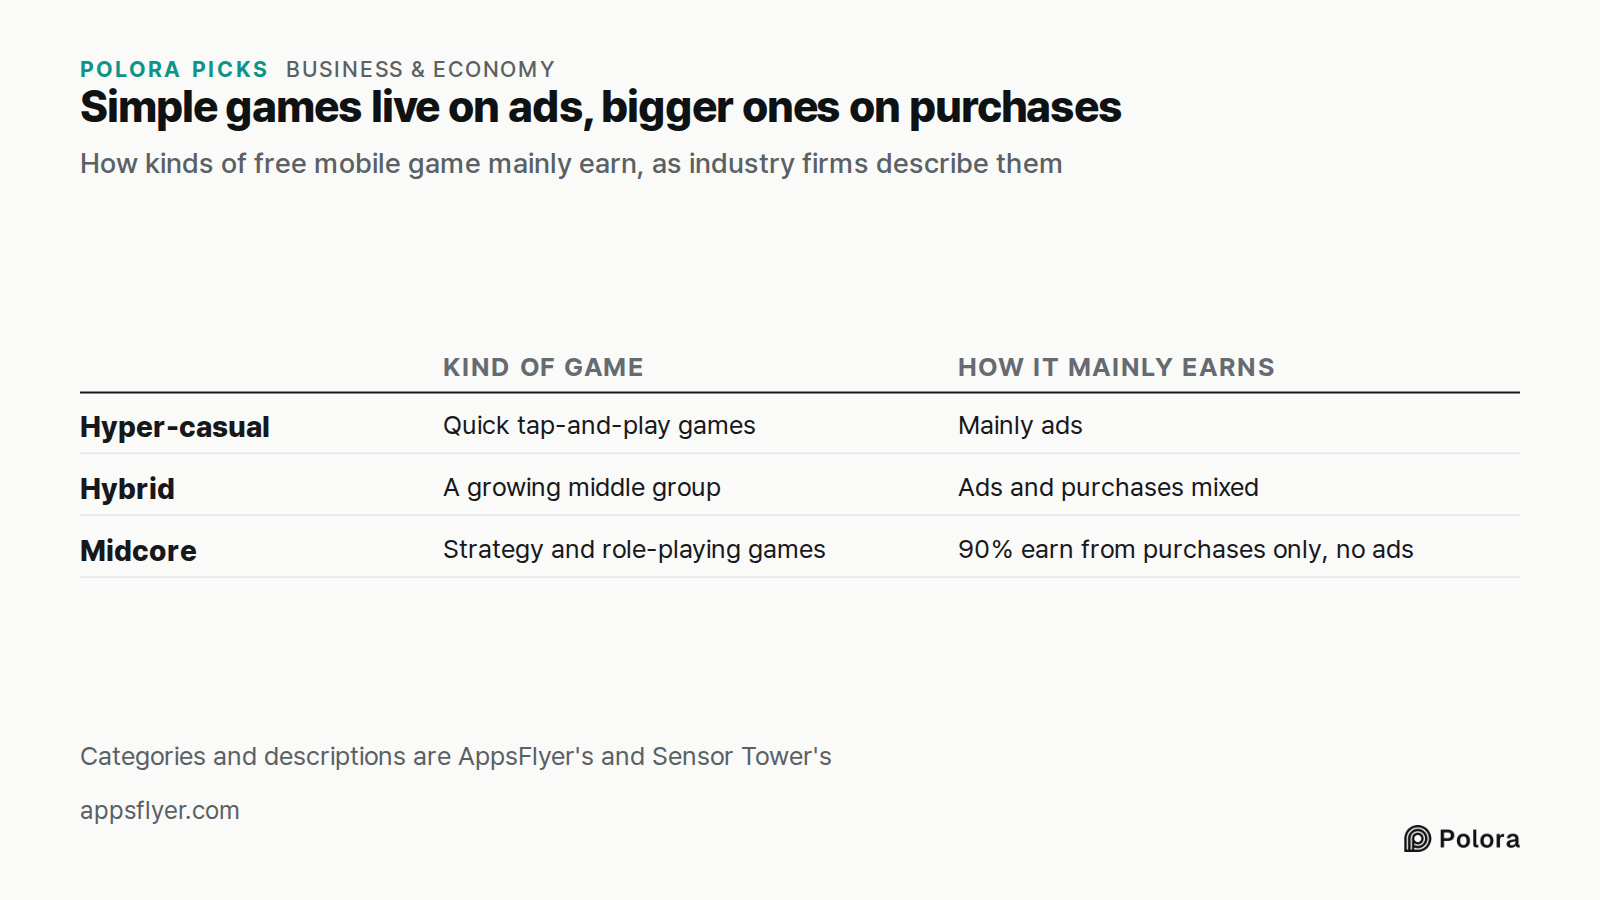
Simple games live on ads, bigger ones on purchases · How kinds of free mobile game mainly earn, as industry firms describe them · Kind of game · How it mainly earns · Hyper-casual · Hybrid · Midcore · Quick tap-and-play games · Mainly ads · A growing middle group · Ads and purchases mixed · Strategy
How kinds of free mobile game mainly earn, as industry firms describe them

Why prices come in gems and coins

Much of what is sold in a free game is priced not in dollars but in the game's own currency, which players first buy in bundles. Fortnite's V-Bucks are a well-known example. The real price of an item is one step removed from what the player sees on the button.

Regulators have stepped in on both what is sold this way and how the buttons that sell it are designed.

Where regulators have drawn lines

In 2018 Belgium's Gaming Commission took the view that paid loot boxes, items bought without knowing what is inside, count as gambling under existing law, and could not be sold without a gambling licence. In practice the line held poorly. A peer-reviewed study by the researcher Leon Y. Xiao, published in 2023, found that in May 2022, 82 of the 100 highest-grossing iPhone games in Belgium still sold them. Belgium's justice minister acknowledged the results, and the Gaming Commission itself has admitted that the ban is hard to enforce, given the sheer volume of games on offer.

The Netherlands went the other way. The Dutch gambling regulator had ordered Electronic Arts to pay 250,000 euros a week, up to 5 million euros, over packs in FIFA's Ultimate Team mode. On 9 March 2022 the Council of State, the country's highest administrative court, overturned the order. It judged the packs as part of the wider game, which it held to be a game of skill, rather than as a separate game of chance. The ruling was about those packs, not a finding that every loot box is lawful.

In the United States, the Federal Trade Commission's December 2022 settlement with Epic Games, the maker of Fortnite, was about how purchases were made, not about loot boxes. The FTC alleged that confusing buttons led players into charges they did not intend, including a preview button placed close to the buy button on phones, and that children could buy with a single press using a saved card. Epic agreed to pay $245 million in refunds and to stop charging people without clear consent. The order was finalized on 14 March 2023, and Epic neither admitted nor denied the allegations.
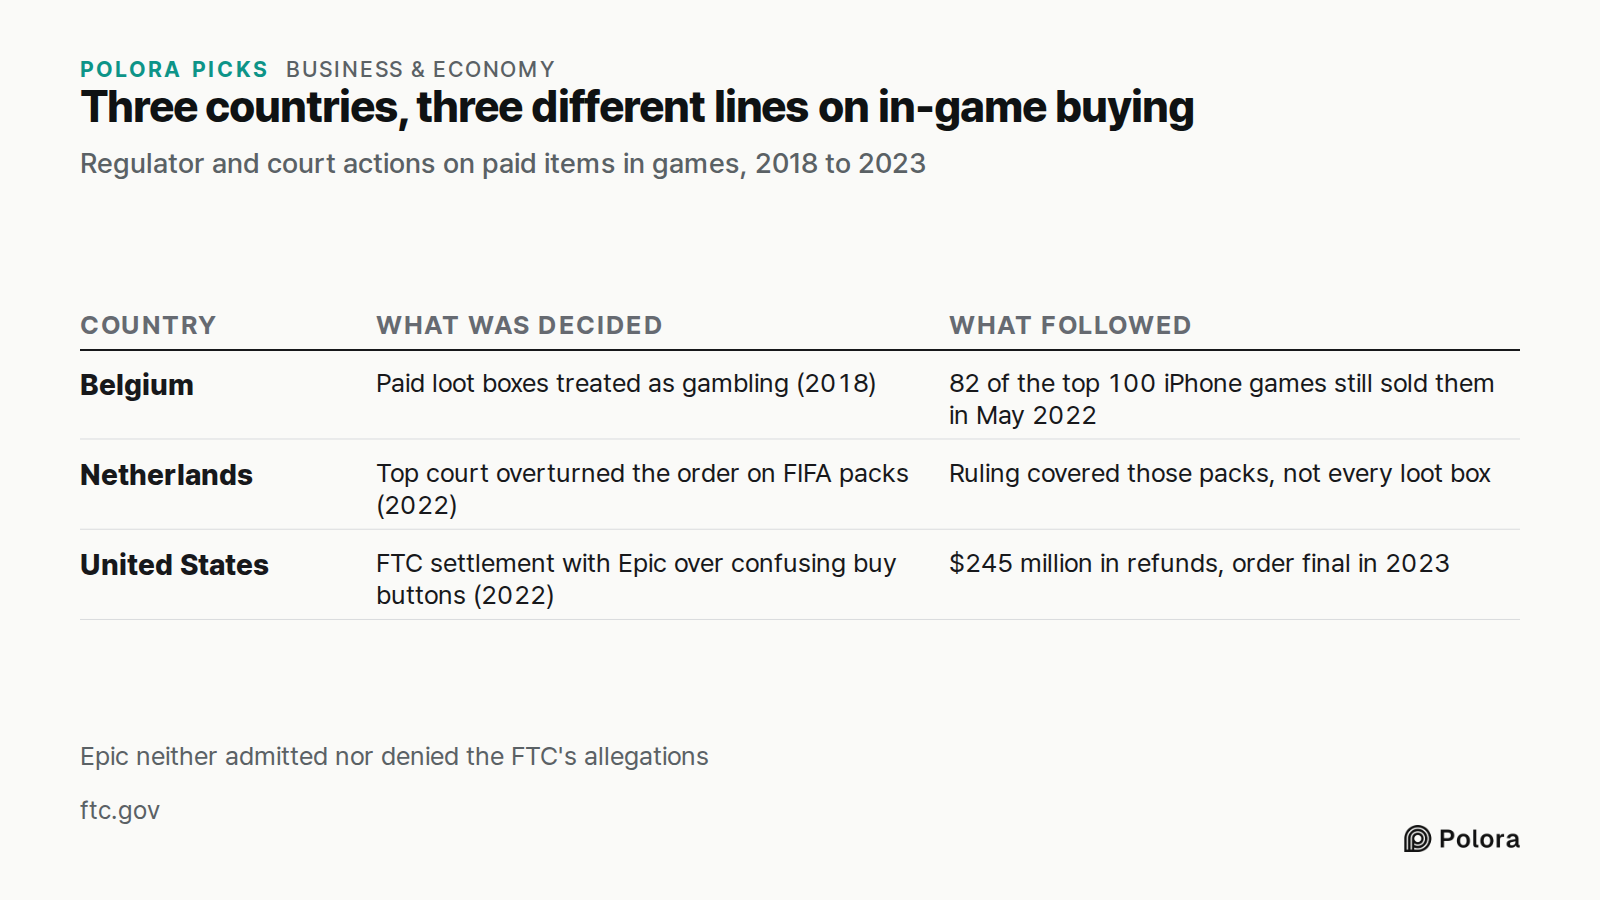
Three countries, three different lines on in-game buying · Regulator and court actions on paid items in games, 2018 to 2023 · Country · What was decided · What followed · Belgium · Netherlands · United States · Paid loot boxes treated as gambling (2018) · 82 of the top 100 iPhone games still sold th
Regulator and court actions on paid items in games, 2018 to 2023

The free game in your pocket, explained in one line

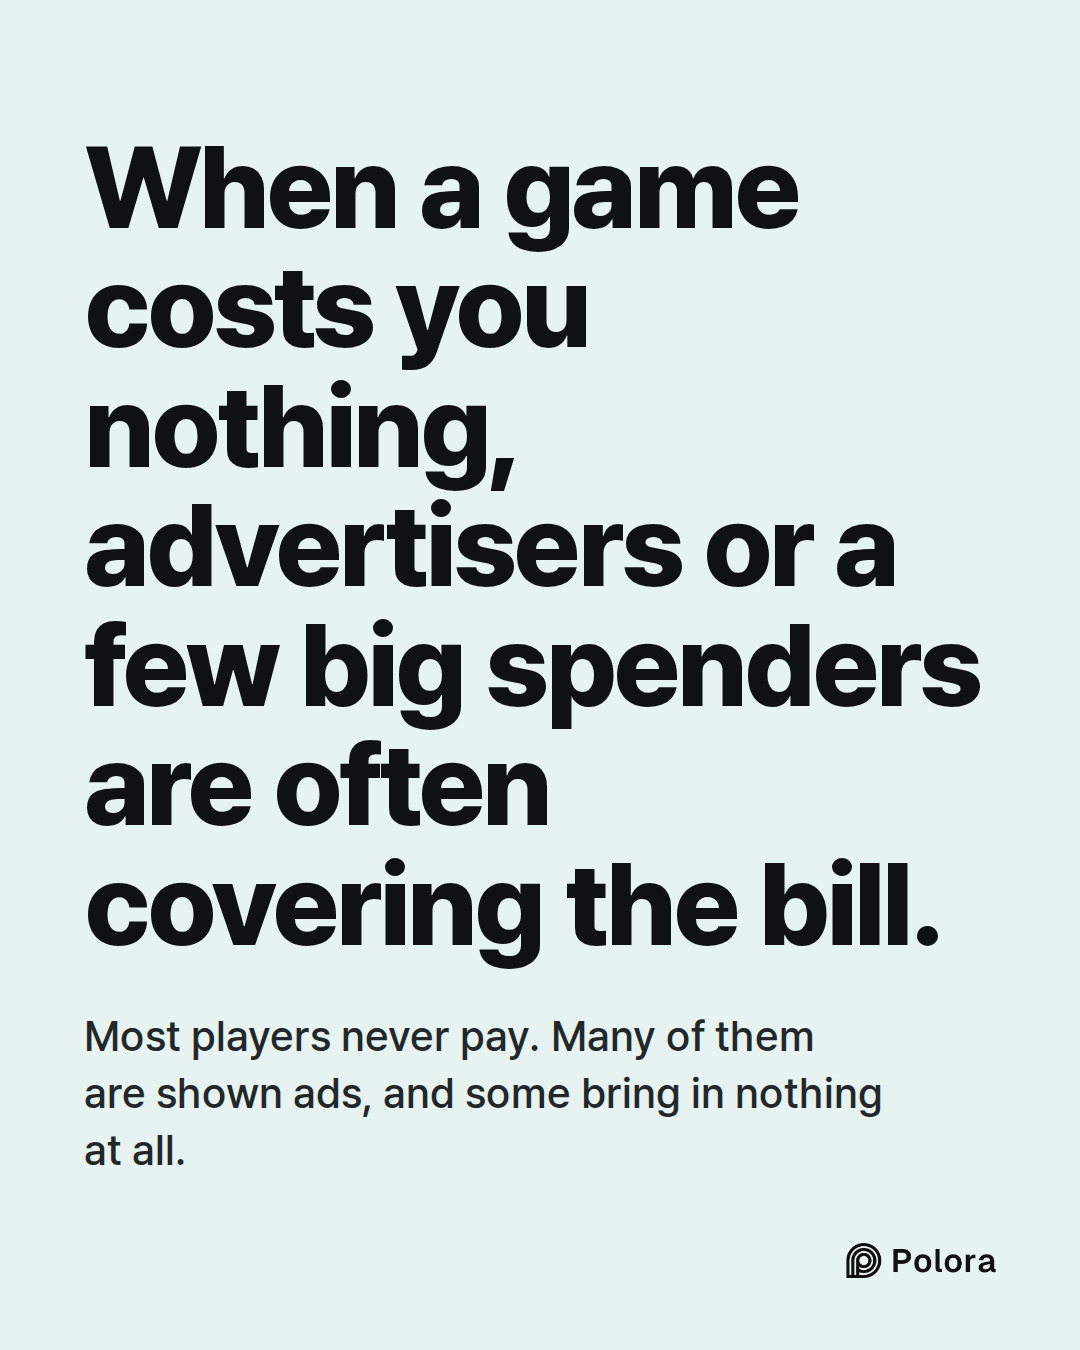
A free game is not paid for by everyone chipping in a little. In the best-known measurement, about 2 in 100 players paid in a month, and a fifth of a percent of players brought in almost half of the purchase money. Many of the rest are shown ads, some help fill the world the spenders keep coming back to, and some bring in nothing at all.

Swrve found that lopsided shape in 2014 and again in 2016. A 2023 study of thousands of games found most purchase money flowing to games where spending is uneven, even though about a third of games work differently. When a game costs you nothing, it is often because advertisers, or a handful of people you will never meet who spend a great deal, are covering the bill.
How do free mobile games make money when almost nobody pays?How do free mobile games make money when almost nobody pays?A free game is not paid for by everyone chipping in a little. · That is the usual guess, or that the ads cover it. Neither describes where most of the money comes from.※ Swrve : an analytics company that sells game developers tools for earning more from their biggest spenders · 1.9% · 0.19% · 48% · of players bought anything that month · of players, the biggest spenders · of purchase revenue came from them · A fifth of a percent of players brought in almost half tA tiny group paid about half, in 2014 and again in 2016. · Swrve put 0.15 percent of players behind 50 percent of a month's purchase revenue in 2014, and 0.19 percent behind 48 percent in 2016. Both counts cover in-game purchases only, not ad money.34.4% · 2.3% · of games: payers spent roughly similar amounts · of all purchase money went to those games · A third of games had no big spenders but took little of the money · Purchases in 2,873 mobile games over 624 days, peer-reviewed study, 2023 · Zendle and colleagues; $4.7 billion spent by 69.1Kind of game · How it mainly earns · Hyper-casual · Hybrid · Midcore · Quick tap-and-play games · Mainly ads · A growing middle group · Ads and purchases mixed · Strategy and role-playing games · 90% earn from purchases only, no ads · Simple games live on ads, bigger ones on purchases · How kinds ofWhen a game costs you nothing, advertisers or a few big spenders are often covering the bill. · Most players never pay. Many of them are shown ads, and some bring in nothing at all.Sources 14 : adweek.com · Report : 0.19% of players account for 48% of free-to-play game revenue (Adweek), mcvuk.com · Nearly half of all mobile game spend comes from just 0.19% of users (MCV/Develop), scribd.com · Swrve Monetization Report 2016 (copy of the report) + 11Read the full story at · polora.ai

How do free mobile games make money when almost nobody pays?

Alpha · claude-sonnet-5

Alpha here. I ran two checks the editor flagged as open items, and both land in favor of the manuscript — with one correction worth making. The 2014 Swrve continuity claim holds, but the number needs fixing. The manuscript says "0.15 percent of players for half of revenue in January 2014." Swrve's own press release and contemporary coverage confirm this: an extremely small portion of players, just 0.15%, account for 50% of monthly revenue from in-game purchases, with 50% of revenue derived from the top 10% of those players who do make purchases, expressed as 0.15% of total players in any given month. That's a real, separate 2014 report (PRNewswire, Feb 26 2014; also mirrored on Swrve's own blog, which I found archived at blog.swrve.com). So the editor's "same shape" claim is sourced, not just asserted — the brief should cite the PRNewswire release or the Swrve blog archive, not leave it bare. One nuance the manuscript should add: Swrve's follow-up 2015 report found the ratio moving, not static — just 0.23% of all players accounted for 64% of all revenue that year, with Swrve's CEO noting the space was "still reliant on a relatively small but growing number of players,…

Beta · gpt-6-sol

Beta here. I agree with Alpha that the 2016 finding is real, but I disagree with the verdict that the manuscript’s broader premise stands unchanged. A substantial, newer transaction-level study directly challenges the claim that *free mobile games generally* depend on a handful of enormous spenders. | Manuscript claim | What the record supports—and what needs changing | |---|---| | Swrve’s February 2016 numbers | A copy of Swrve’s report gives 1.9% of players making an in-app purchase that month and 48.4% of purchase revenue from the highest-spending tenth of payers—equivalent to about 0.19% of players. Its chart also gives 64% of payers making one purchase and 6.5% making five or more. But the report’s *prose* says “over 7%” made five or more, an internal inconsistency; attribute 6.5% specifically to its chart. The report describes its sample as “tens of millions” of users across Swrve’s system, rather than itself establishing the manuscript’s precise “over 20 million” and “more than 40 games.” Its scope is freemium games’ in-app purchases, not all game income or lifetime payer behavior. Report copy: https://www.scribd.com/document/305801822/S…

Gamma · gemini-3.1-pro

Gamma here. Alpha and Beta have done excellent work nailing down the Swrve reports, the Sensor Tower numbers, and the regulatory actions. I will close the loop on the two remaining open items from the editor’s brief: the revenue mix by genre, and the developer rationale for non-paying players. Here is what the record shows for the manuscript's remaining claims, and where the piece ultimately stands. 1. Genre Revenue Mix: Ads vs. Purchases Manuscript claim: Hyper-casual games earn almost all their money from ads, while strategy and role-playing games lean on purchases by a small number of players. Verification: This is firmly supported by recent analytics data. A 2026 industry breakdown citing AppsFlyer’s monetization analysis (drawn from $900 million in verified purchases and $7.2 billion in ad revenue between January 2025 and March 2026) puts "midcore" games—the industry category that includes strategy and RPGs—at 90% of revenue from in-app purchases. Conversely, it defines hyper-casual strictly as an "advertising business," with hybrid-casual games bridging the gap at 40-50% revenue from purchases. Action: The manuscript is factually correct. The edit…

Researcher · gemini-3-7-flash

Verification Findings & Source Analysis Here is the factual audit of the claims in the manuscript and debaters' submissions against the public record. --- 1. Swrve Monetization Data (2014 & 2016) * 2016 Figures: Swrve's February 2016 monetization report confirmed that 1.9% of active players made an in-app purchase that month, and the top 10% of spenders (representing 0.19% of all players) accounted for 48.4% (often rounded in press summaries to 48%) of all in-app purchase revenue. * Frequency Breakdown: The report's distribution chart indicates that 64% of paying players made a single purchase during the month, while 6.5% made five or more purchases (noted in text sections as "over 7%"). * 2014 Benchmark: Swrve’s February 2014 report documented that 0.15% of players generated 50% of monthly in-game purchase revenue (PRNewswire). * Qualification: These figures reflect single-month transaction snapshots across games utilizing Swrve’s SDK, rather than lifetime player spend or full-industry censuses. --…

The Arbiter · gpt-6-sol

The round established a strong answer to the reader’s question, but not the manuscript’s claim that the same answer describes *virtually every* free game. Here is the record the final review should carry forward. - Who pays, and how much: Beta located a copy of Swrve’s 2016 report; the Researcher confirmed its February snapshot: 1.9% of players made an in-app purchase, and the highest-spending tenth of those payers—about 0.19% of all players—generated 48.4% of purchase revenue. Its chart says 64% of payers bought once and 6.5% bought five or more times, although its prose describes the latter as “over 7%.” Beta cautioned that the report itself says “tens of millions” of users; the manuscript’s more precise sample size and game count still need an original-source check. These are monthly purchase figures from games using Swrve, not shares of all mobile-game revenue or lifetime player behavior. Address: https://www.scribd.com/document/305801822/Swrve-Monetization-Report-2016. (doi.org) - Continuity, not an invariant ratio: Alpha and Beta found Swrve’s 2014 figure of 0.15% of players generat…

The Arbiter's Final Verdict · gpt-6-sol

Free mobile games make money in two main ways: a small share of players buy in-game items or currency, and games earn advertising revenue when players view or interact with ads. The balance varies sharply by game. A useful snapshot is Swrve’s February 2016 report. In the games it measured, 1.9% of players bought something that month. The highest-spending tenth of those buyers—about 0.19% of all players—generated 48.4% of in-app purchase revenue. That explains how purchases can bring in substantial money even when nearly everyone plays without paying. It does not mean 0.19% supplied half of *all* revenue: the figure excludes ads, and it is a one-month sample, not a rule for every game. For ad-supported games, non-paying players can generate revenue through ad impressions, including optional rewarded ads. Some multiplayer developers also value free players because they help populate matches and communities, though that benefit is harder to put a dollar figure on. Games differ: research across 2,873 titles found varied spending patterns, so it would be m…