Since 2018, more strikeouts than hits
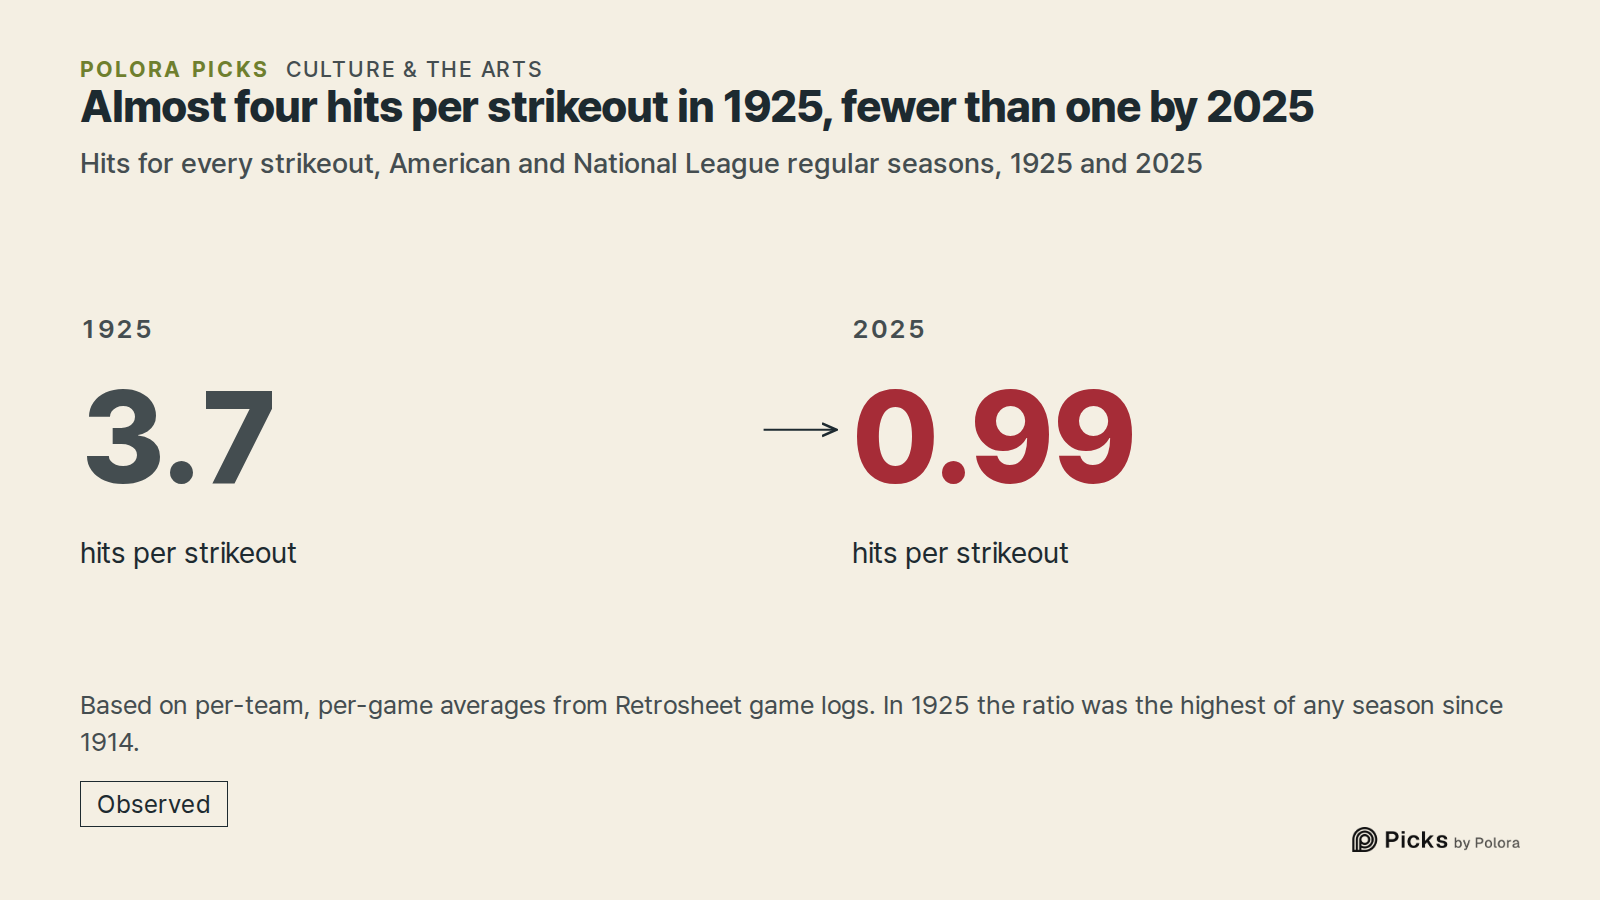
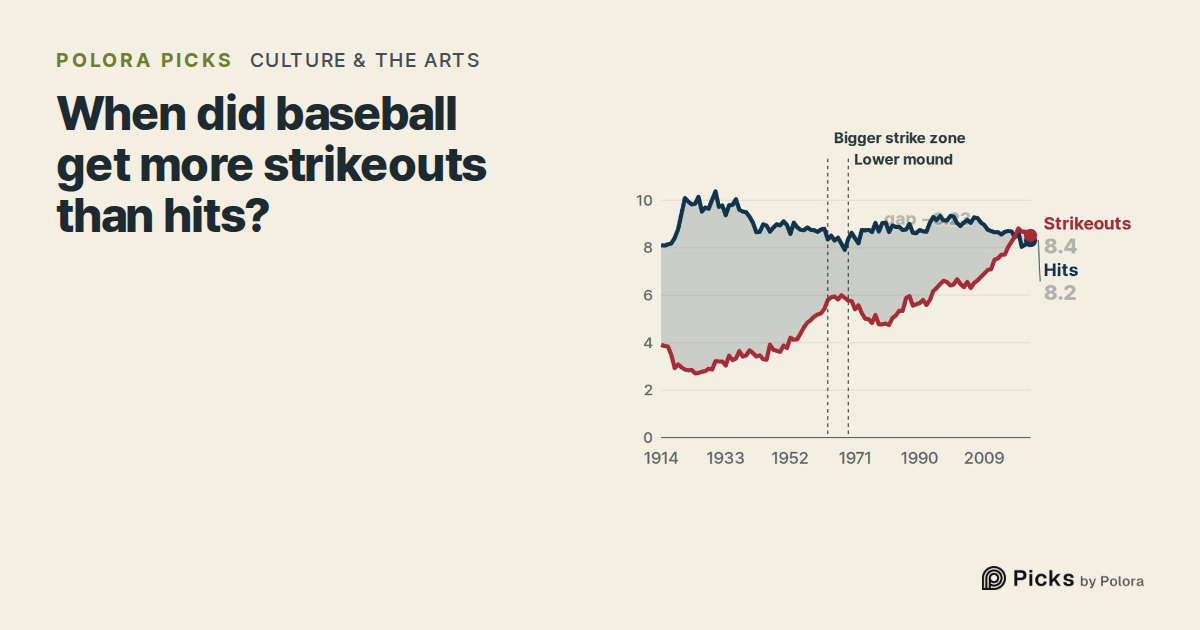
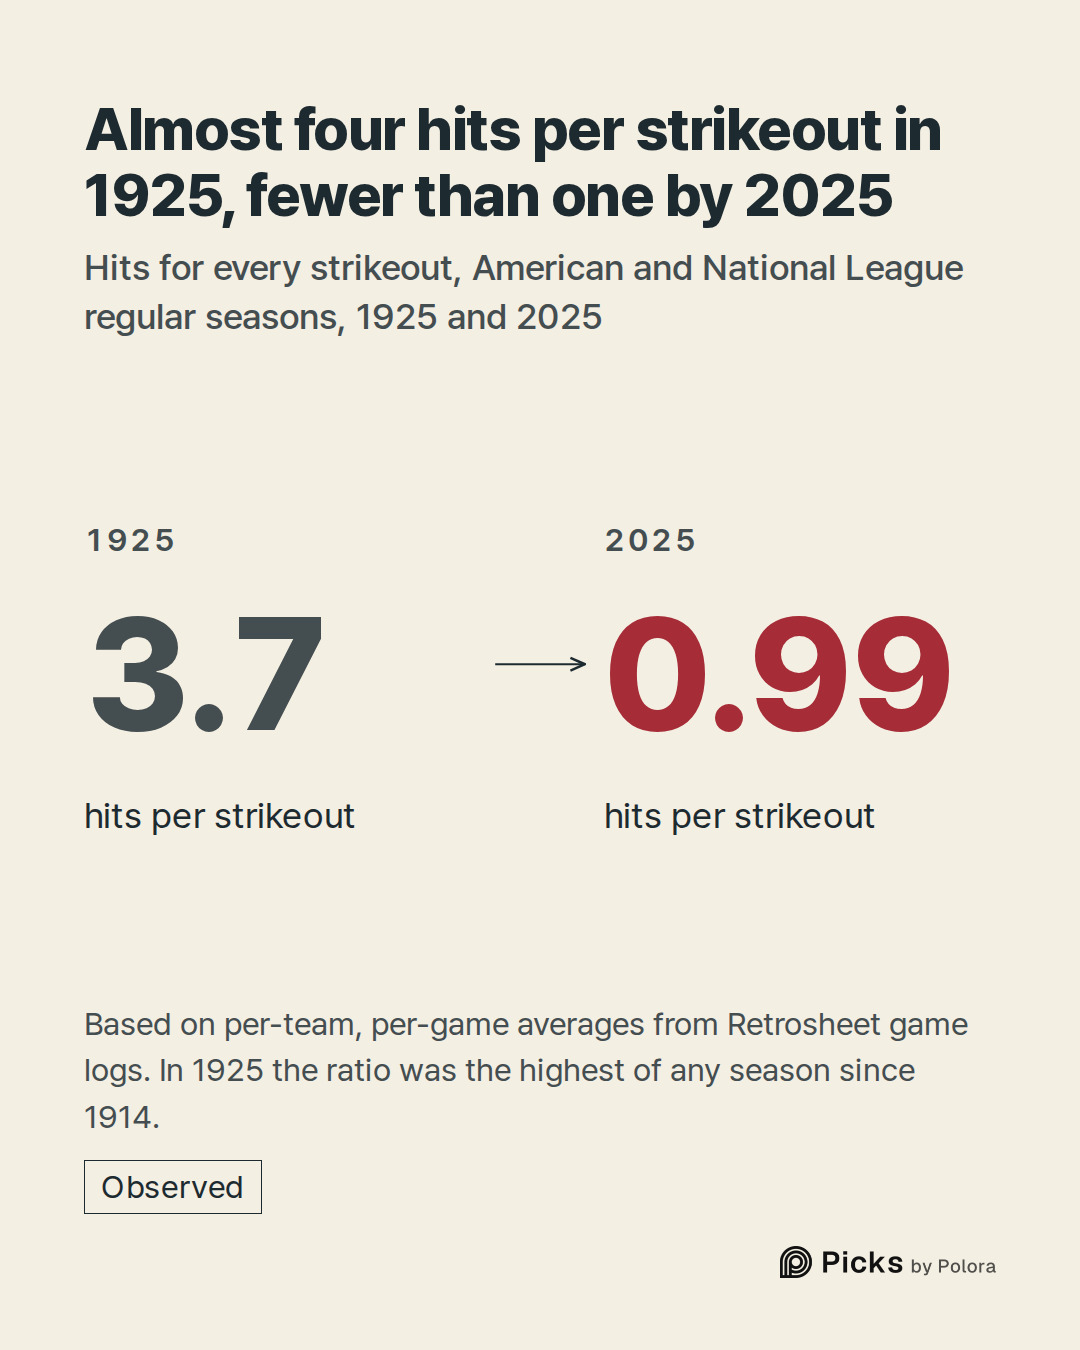
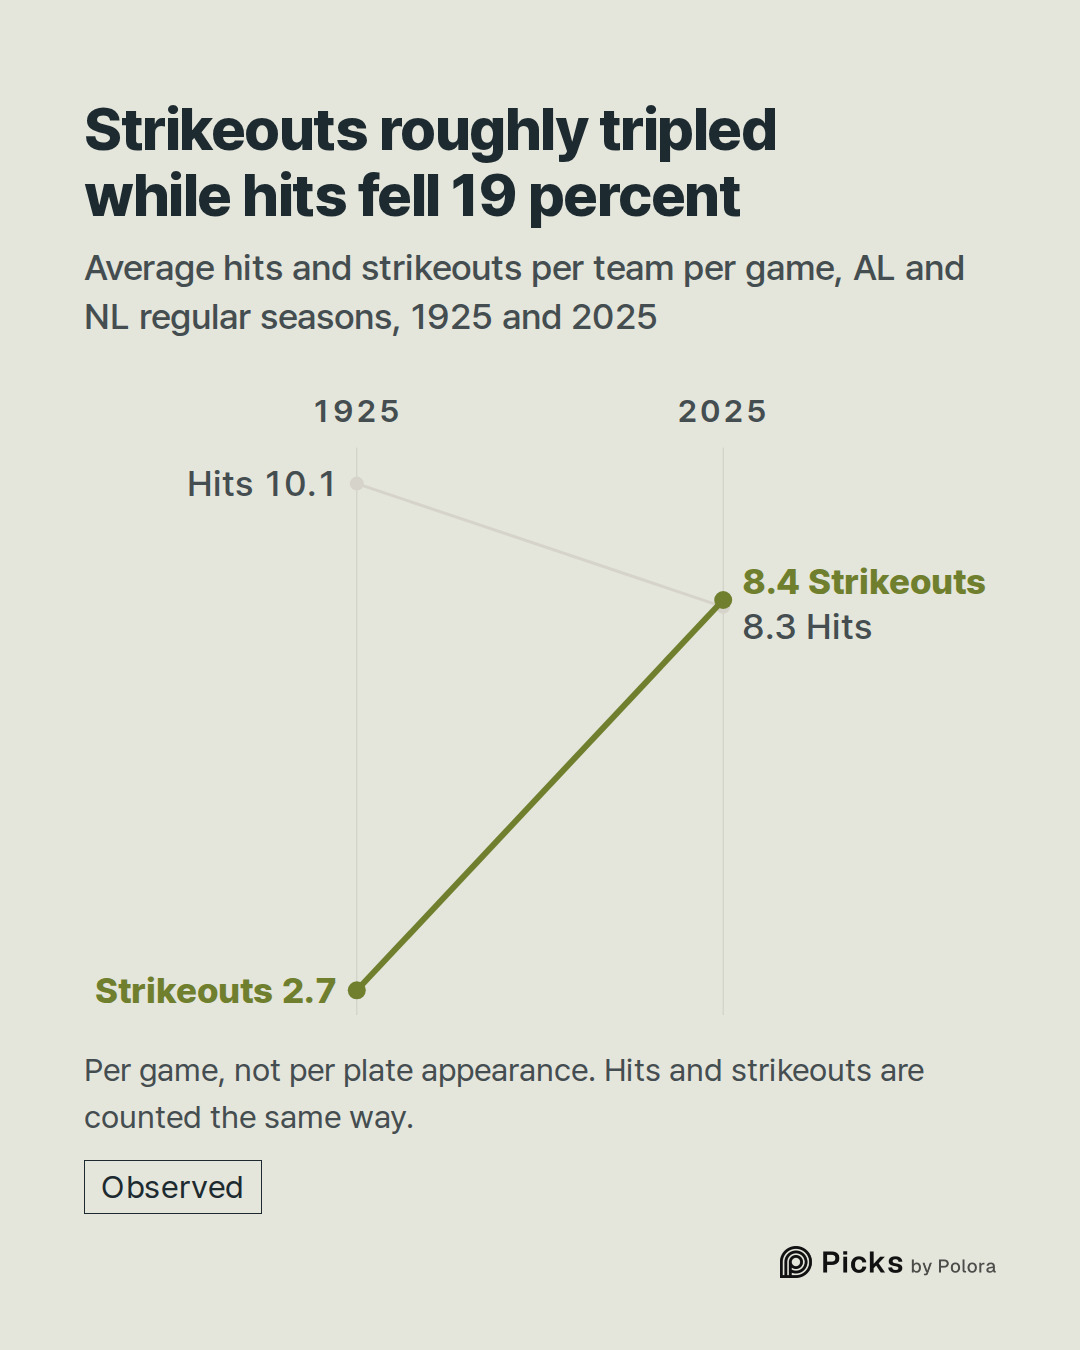
In 1925 an American or National League team averaged 10.1 hits a game and 2.7 strikeouts. That is 3.7 hits for every strikeout, the most of any season since 1914.
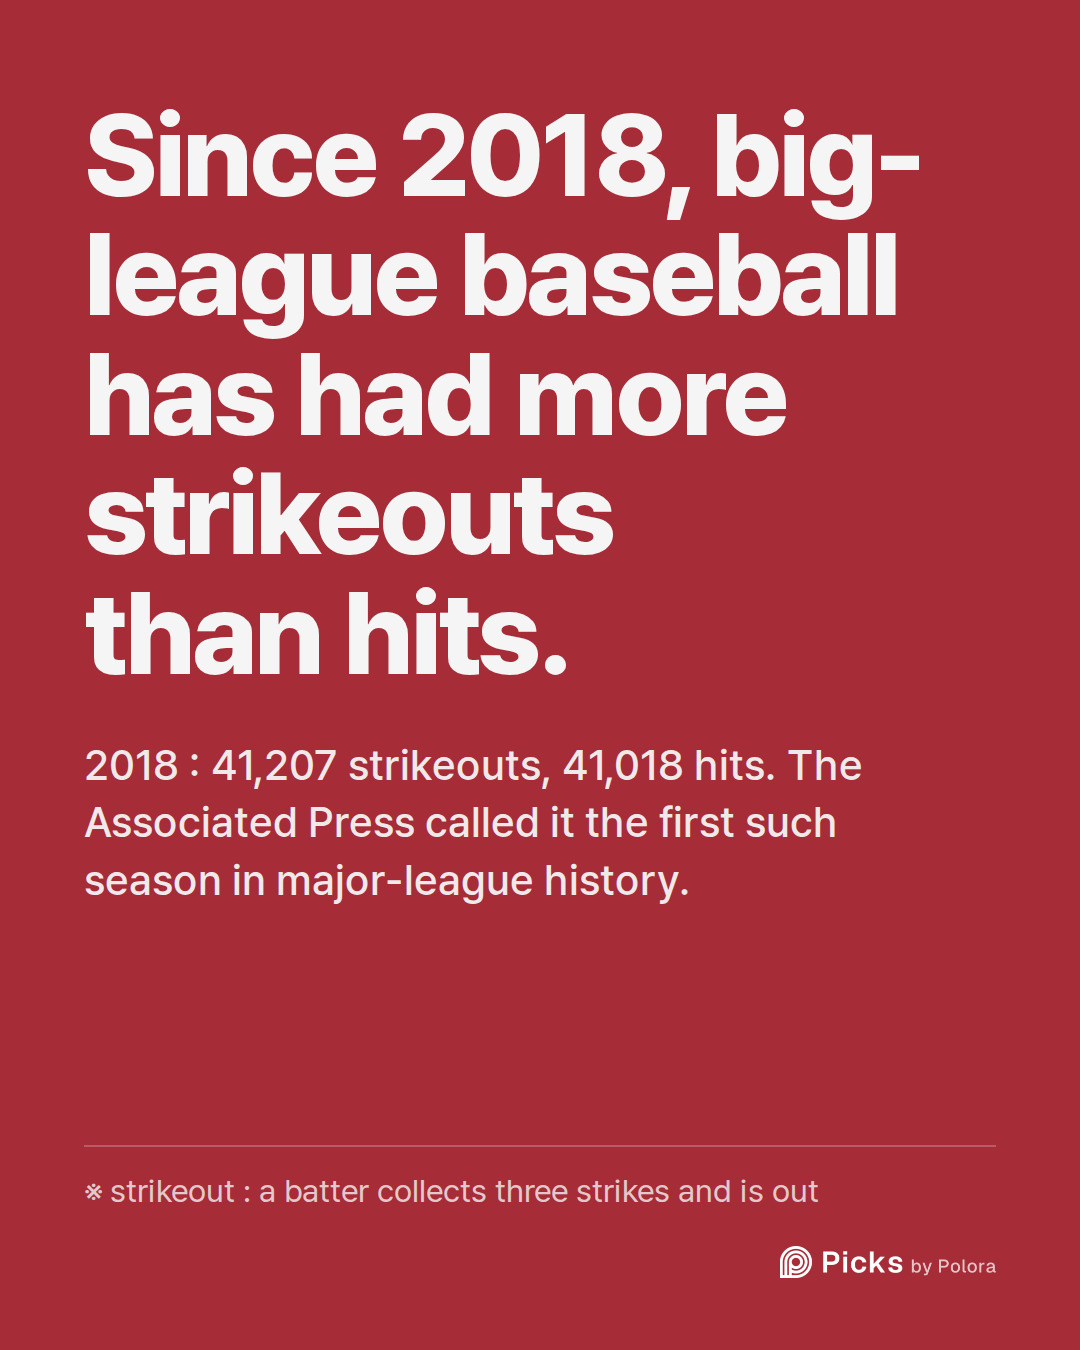
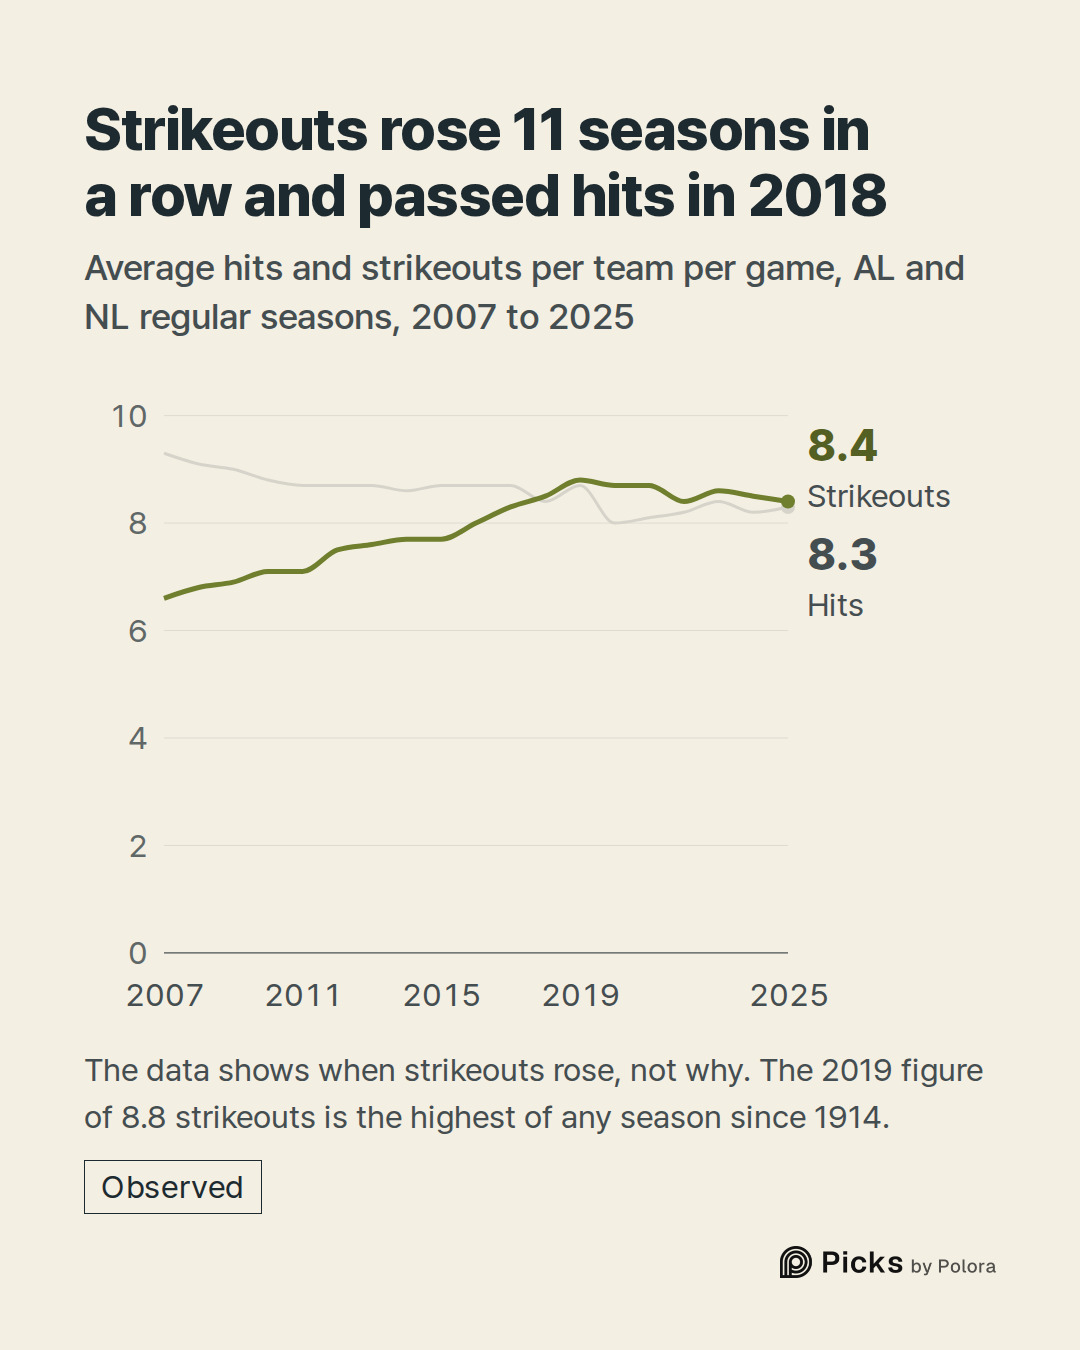
In 2018 strikeouts outnumbered hits, in what the Associated Press called the first such season in major-league history : 41,207 strikeouts against 41,018 hits across the two leagues, a margin of 189. Strikeouts stayed ahead in every season since, through 2025, the latest season in the data. In 2025 a team averaged 8.4 strikeouts and 8.3 hits a game, or 0.99 hits for every strikeout.
A hit is credited when a batter puts the ball in fair territory and reaches base safely, without the help of a fielding error or a fielder's choice. A strikeout is recorded when a batter collects three strikes ; the batter is out, unless the catcher fails to hold the third strike and the batter reaches first. So a turn at bat that once ended in a hit far more often than in a strikeout now ends in a strikeout slightly more often.
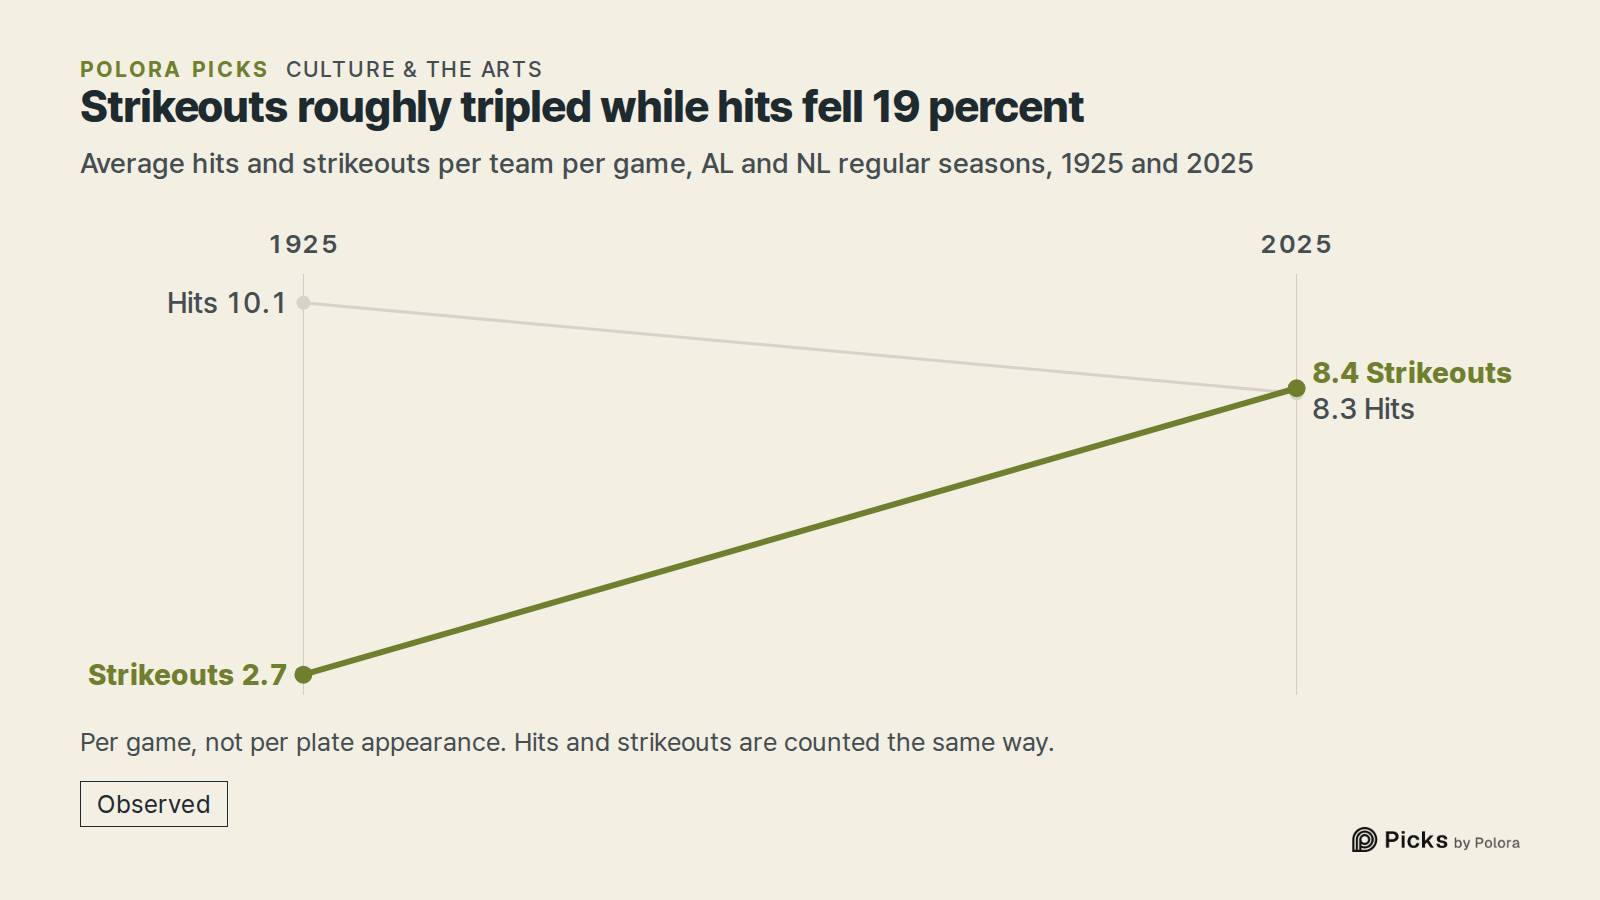
Hits fell 19 percent. Strikeouts roughly tripled.
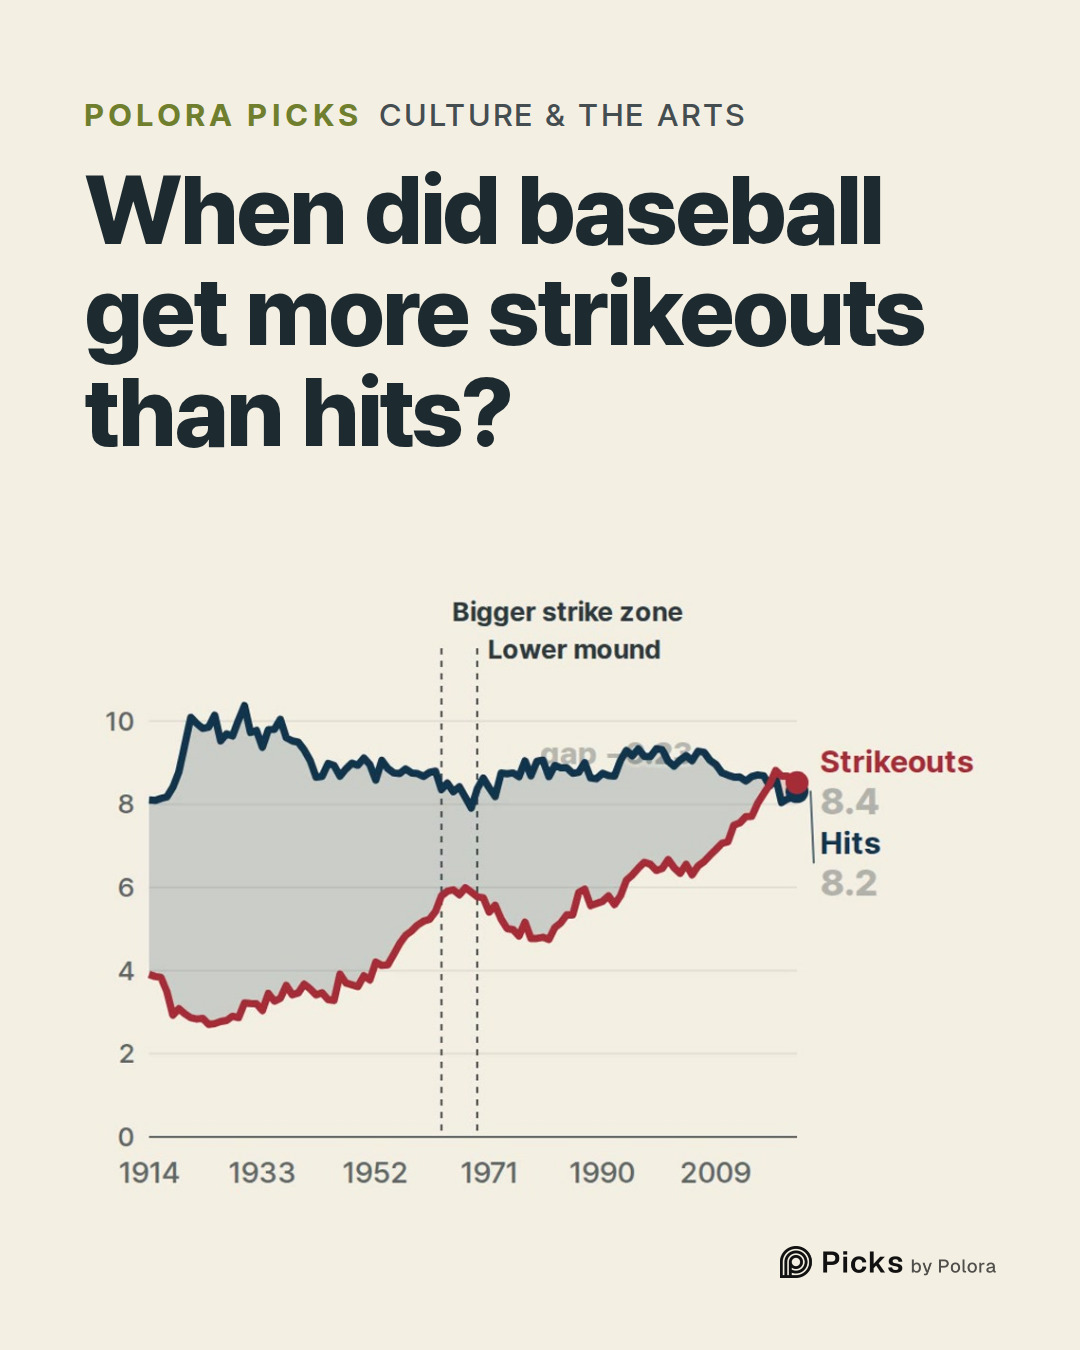
Hits have moved less than you might expect. Across all 112 seasons in the data, 1914 through 2025, a team's hits per game stayed between 7.9 (in 1968) and 10.4 (in 1930). In 2025 a team got 8.3 hits a game, about 19 percent fewer than the 10.1 of 1925.
Strikeouts roughly tripled over the same century, from 2.7 a game to 8.4. The lines crossed because one of them climbed, much more than because the other fell.
Rule changes along the way
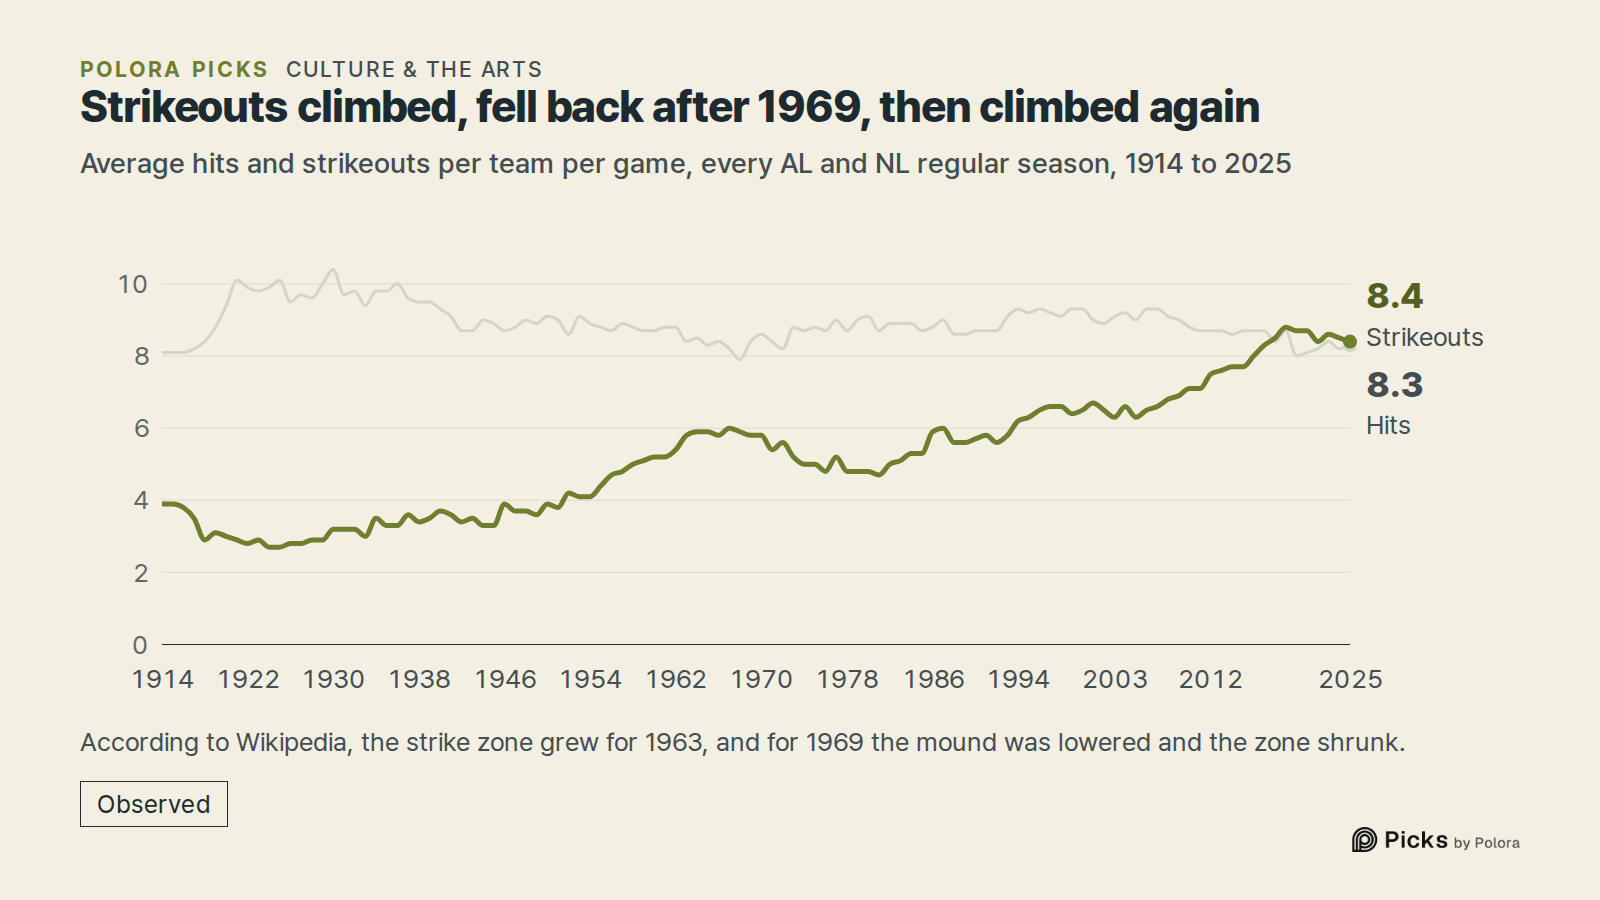
The climb was not steady. According to Wikipedia's history of the strike zone, after Roger Maris's record home-run season in 1961 baseball enlarged the zone for 1963, raising its top from the batter's armpits to the top of the shoulders. Strikeouts stayed high, and hits sank to 7.9 a game in 1968, the fewest of any season here. Wikipedia's history of 1968 calls it "The Year of the Pitcher" and says that, as a result of the falling offense, the rules committee lowered the pitcher's mound and shrank the strike zone for 1969.
In the following decade strikeouts fell back, to 4.8 a game by 1978. Then, with ups and downs, they climbed again through the 1980s, 1990s and 2000s, reaching 6.6 a game by 2007.
Eleven rises in a row, then a crossing
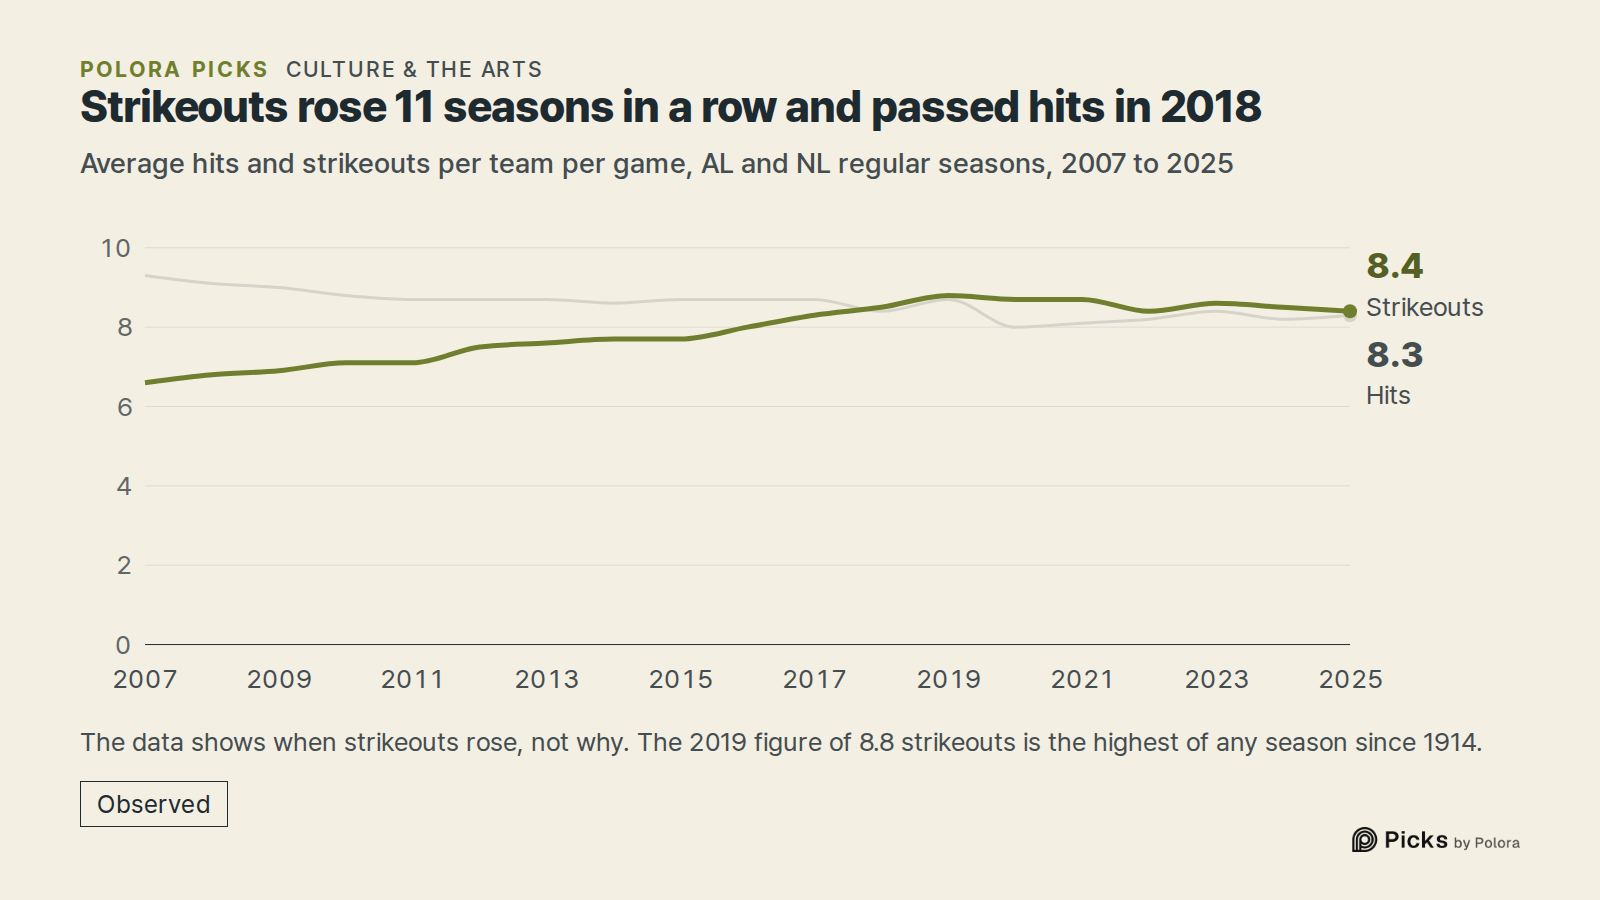
From 2008, strikeouts per game rose eleven seasons in a row, through the 2018 crossing. They rose once more after that : 2019's 8.8 a game is the highest of any season since 1914, and the Associated Press's season totals also peak that year. They have been lower since, 8.4 a game in 2025, but still above hits.
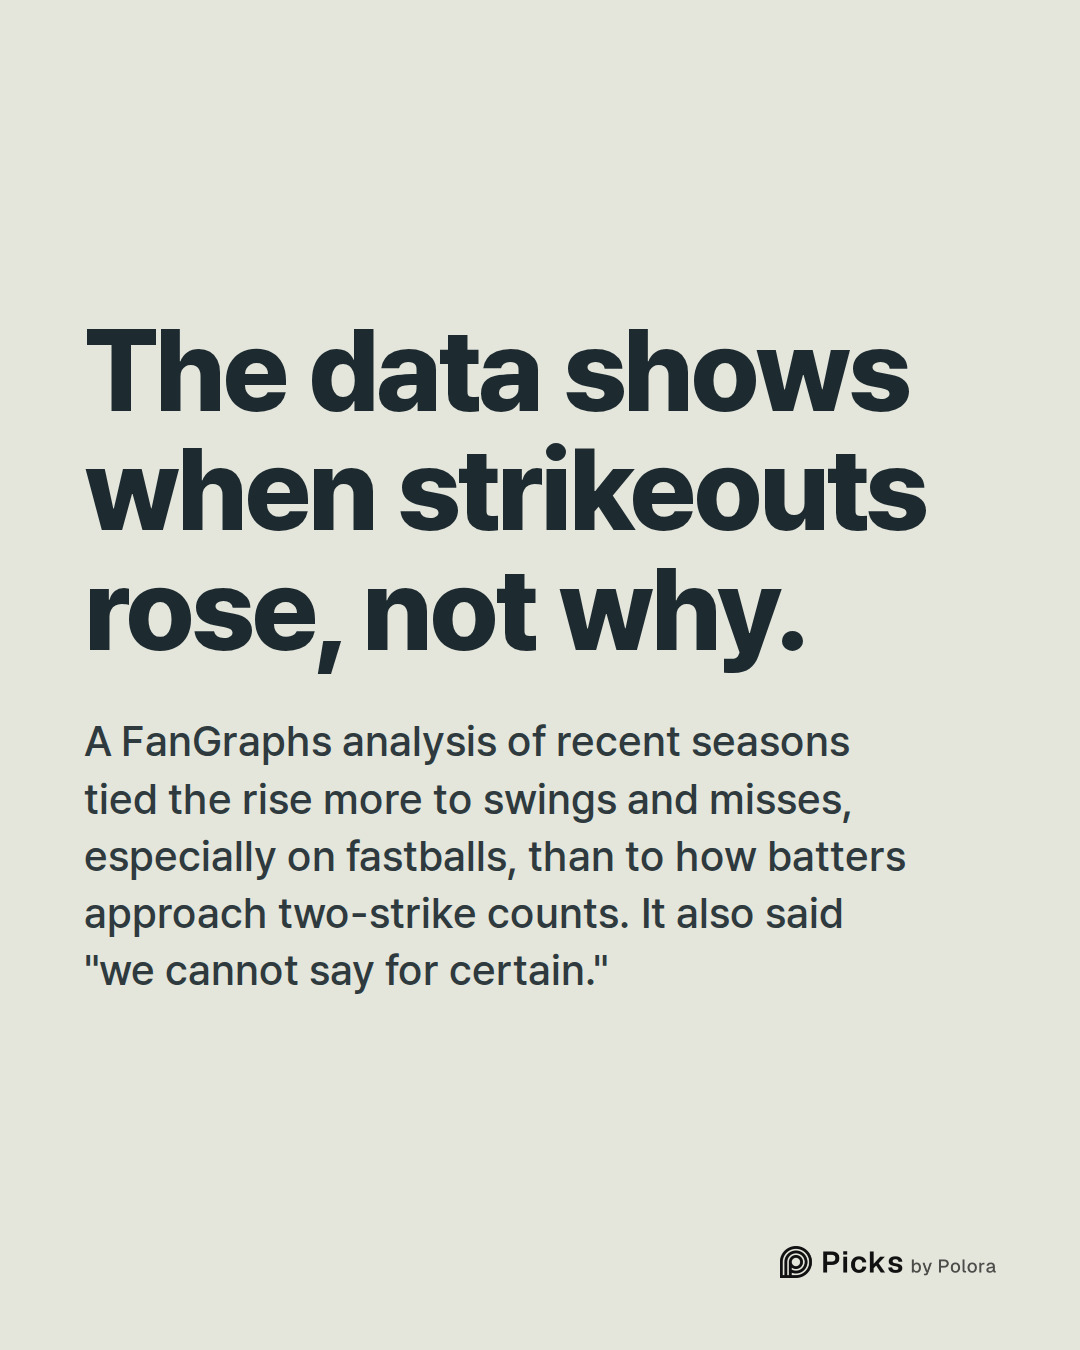
Why the long rise? The data shows when, not why. A FanGraphs analysis by Carmen Ciardiello looked at the recent seasons tracked pitch by pitch. It found that the rise had more to do with swings and misses in every count, especially on fastballs, than with how batters approach two-strike counts, and it pointed to ever-faster pitching. It also said that without a controlled experiment "we cannot say for certain." Its measure is strikeouts per plate appearance rather than per game, and it covers recent seasons, not the whole run since 2008.
In 2023 Major League Baseball began barring teams from stacking infielders on one side of second base, the defensive "shift". Hits rose that season, from 8.2 a game to 8.4. The AP reported that left-handed batters gained the most from the shift restrictions. Strikeouts rose too, from 8.4 to 8.6, and stayed ahead.
How the numbers were made
The counts come from Retrosheet's game logs, a game-by-game record of major-league seasons. Only the American and National Leagues are counted, regular season only. For each season, the hits of both teams in every game with batting statistics recorded are added up and divided by twice the number of those games ; strikeouts are counted the same way. A handful of games listed without batting statistics are left out of both lines. That gives the average per team per game. It is not a rate per plate appearance or per nine innings, so it moves a little with how many batters come up in a game, but hits and strikeouts are measured identically, which is what lets the two lines cross.
The series starts in 1914 because the earliest logs are incomplete. Retrosheet says it includes team statistics "where our research is more complete", and before about 1912 its logs miss many strikeouts that the official league totals record. From 1914 on, the logs and the official totals published by Baseball Almanac agree closely : they differ by a few hundredths of a strikeout a game at most, and match exactly on 2018's totals. Where a few early seasons round to a different tenth, the figures here are Retrosheet's.
The "first in major-league history" is the AP's description. The data here covers the American and National Leagues from 1914 ; within it, no season before 2018 had more strikeouts than hits.
The information used here was obtained free of charge from and is copyrighted by Retrosheet. Interested parties may contact Retrosheet at www.retrosheet.org.
- Retrosheet, Game Logs]
- Retrosheet, notice for users of its data]
- Associated Press via Sports Illustrated, "Strikeouts Reach Record High for 11th Straight Year" (2018)]
- Associated Press via KPRC Click2Houston, "MLB game time drops 24 minutes to 2:40 with pitch clock" (2023)]
- FanGraphs, Carmen Ciardiello, "Let's Take Another Stab at Unpacking the Rising Strikeout Rate" (2021)]
- Wikipedia, 1963 Major League Baseball season]
- Wikipedia, 1968 in baseball]
- Wikipedia, Strike zone]
![Sources 8 : retrosheet.org · Retrosheet, Game Logs], retrosheet.org · Retrosheet, notice for users of its data], si.com · Associated Press via Sports Illustrated, "Strikeouts Reach Record High for 11th Straight Year" (2018)] + 5](https://media.cdn.polora.ai/picks/2026/10/pickrun_5ba08a76ae5240d8/DLumpHwjyT37iKa4-slide-07--when-did-strikeouts-start.jpg)