How the comparison works
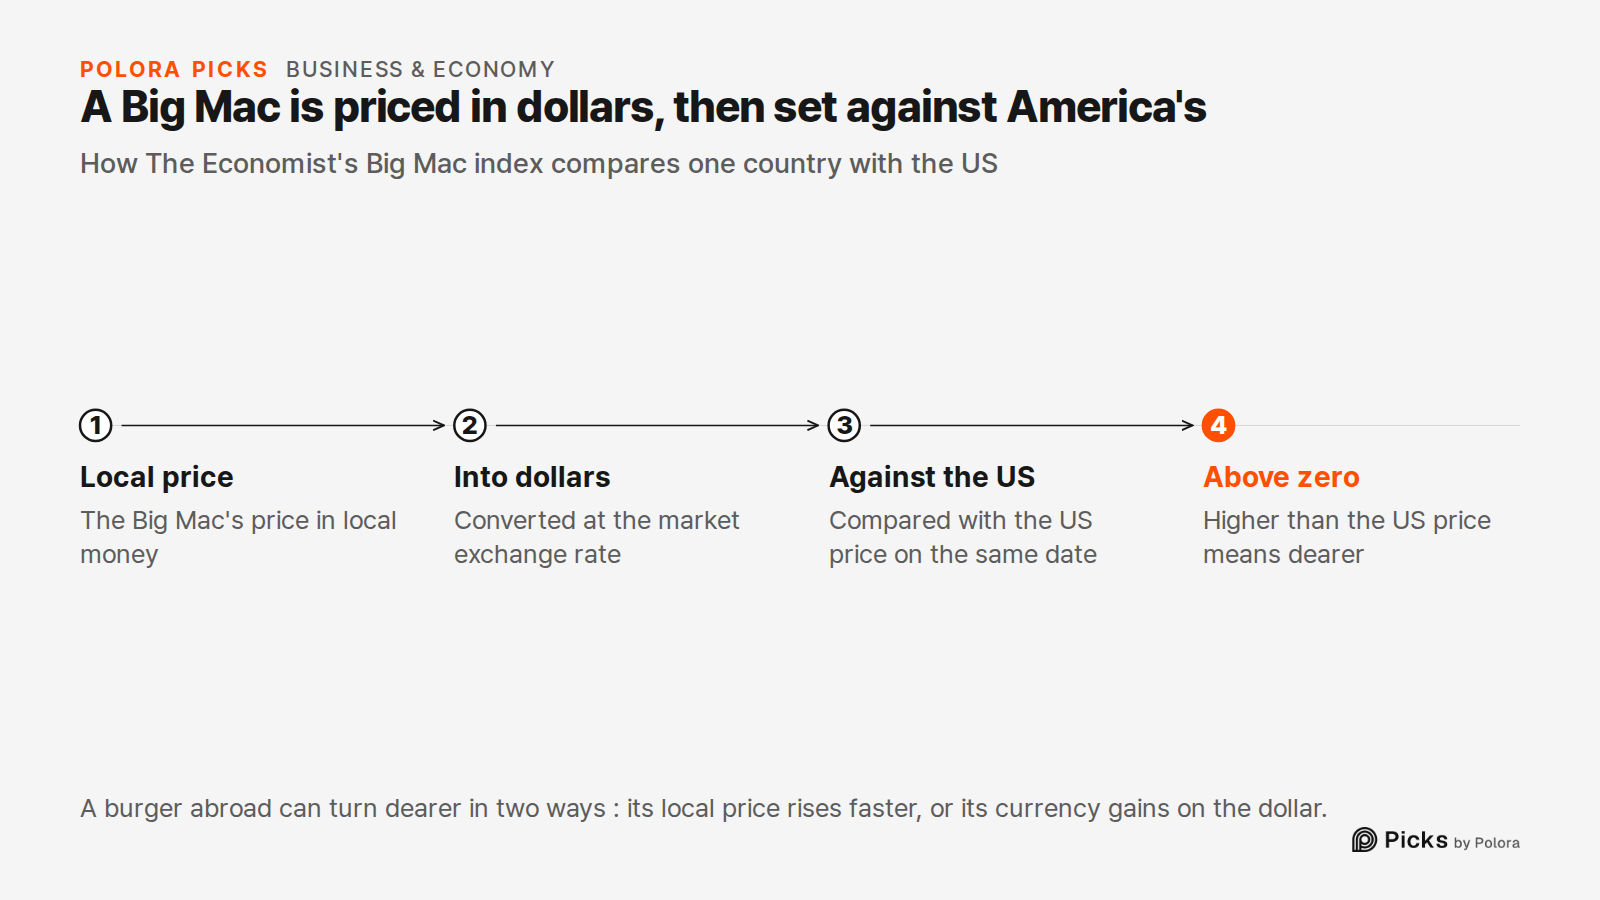
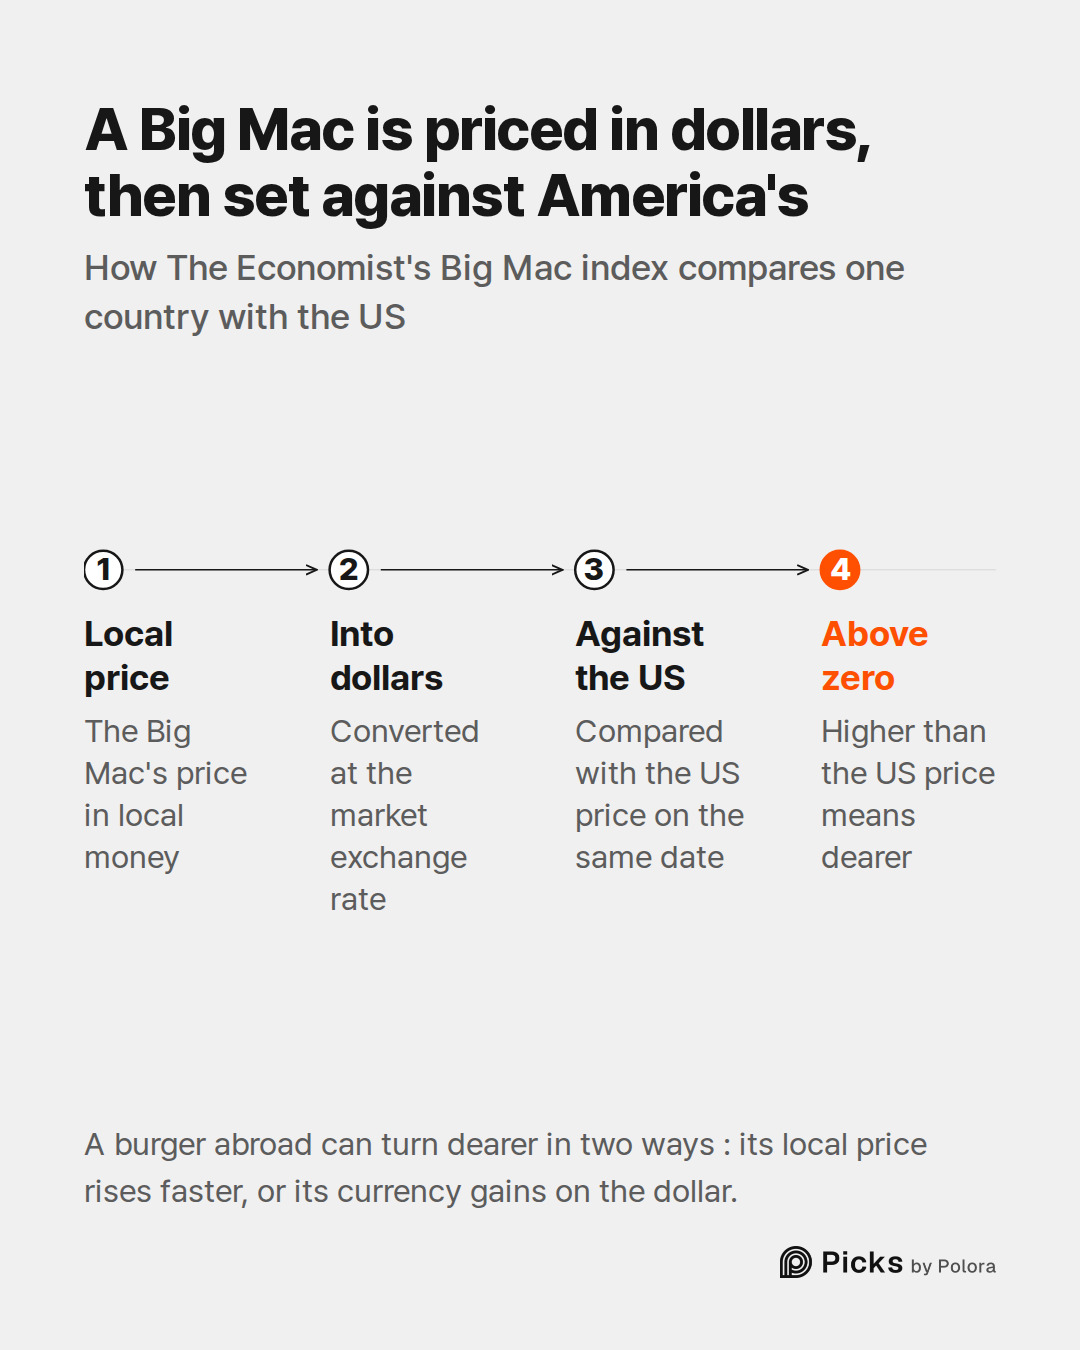
The Big Mac index is The Economist's long-running, half-serious way of asking whether currencies are cheap or dear. It takes the price of a Big Mac in local money, converts it to dollars at the market exchange rate, and compares the result with the price of a Big Mac in the United States on the same date. If the converted price is higher, the burger is dearer than in America, and the index reads above zero.
That means a Big Mac abroad can turn dearer, in dollars, for two different reasons. Its local price can rise faster than the American price, or the local currency can gain against the dollar. The count shown in the film that goes with this piece moves with both, and telling them apart is most of the story.
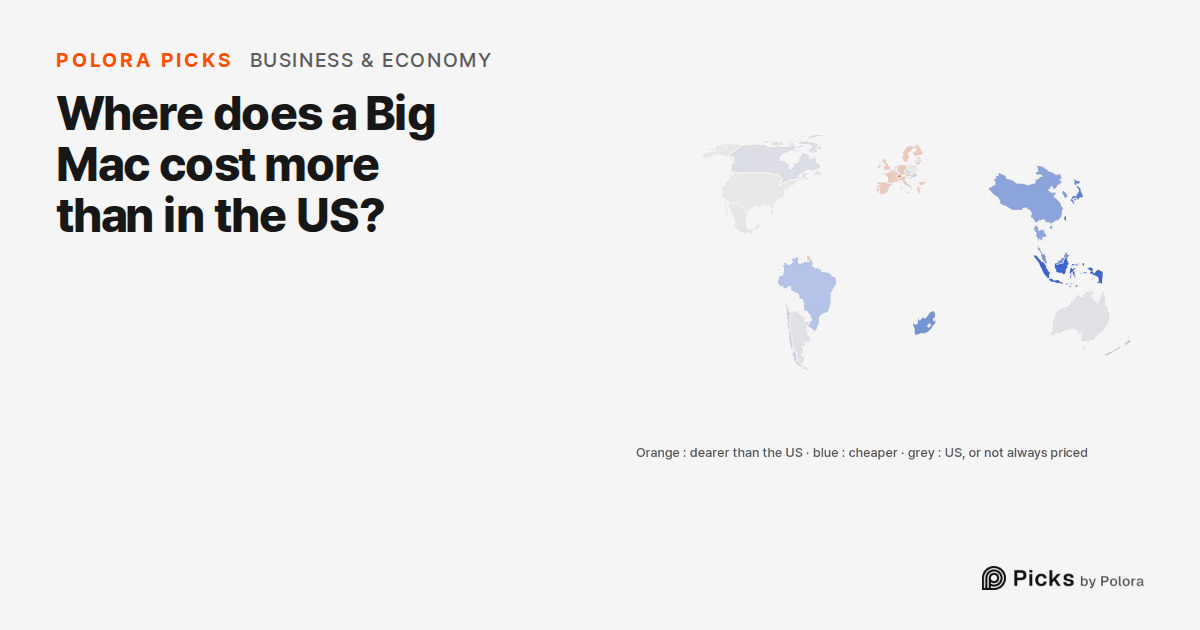
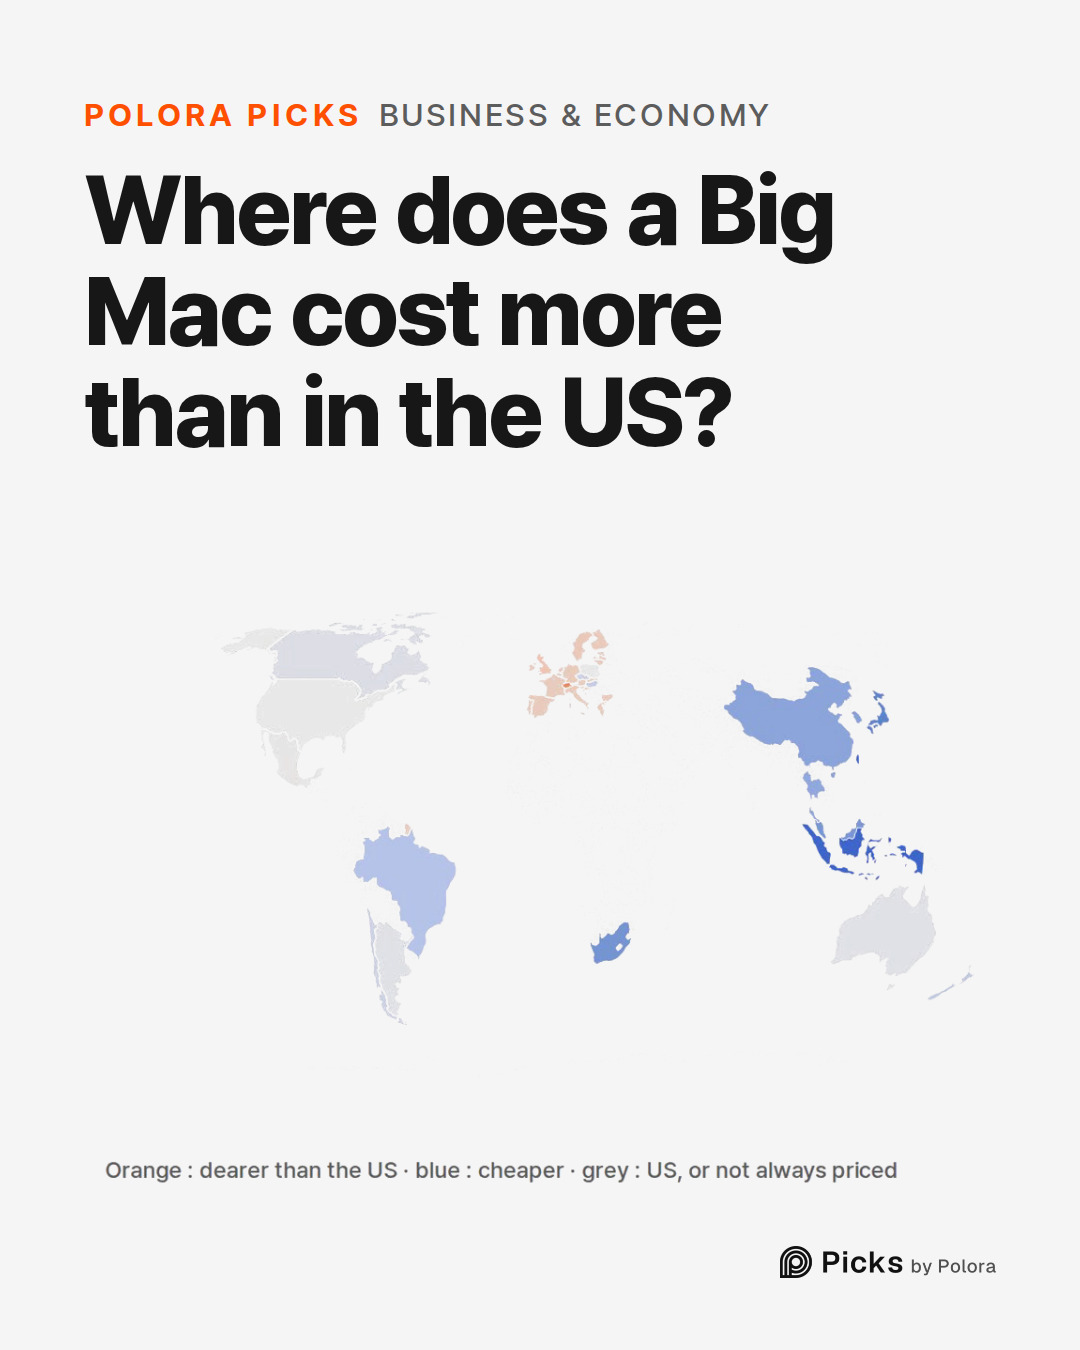
The film follows a fixed group : the 24 economies The Economist has priced at every survey since April 2000, so the count is not moved by countries joining or leaving the list. The euro area is one entry, a single average price over a membership that has grown since 2000, shown on the map for each country that belonged at the time. Hong Kong and Singapore are counted but are too small to draw on the map.
2011 : the high point
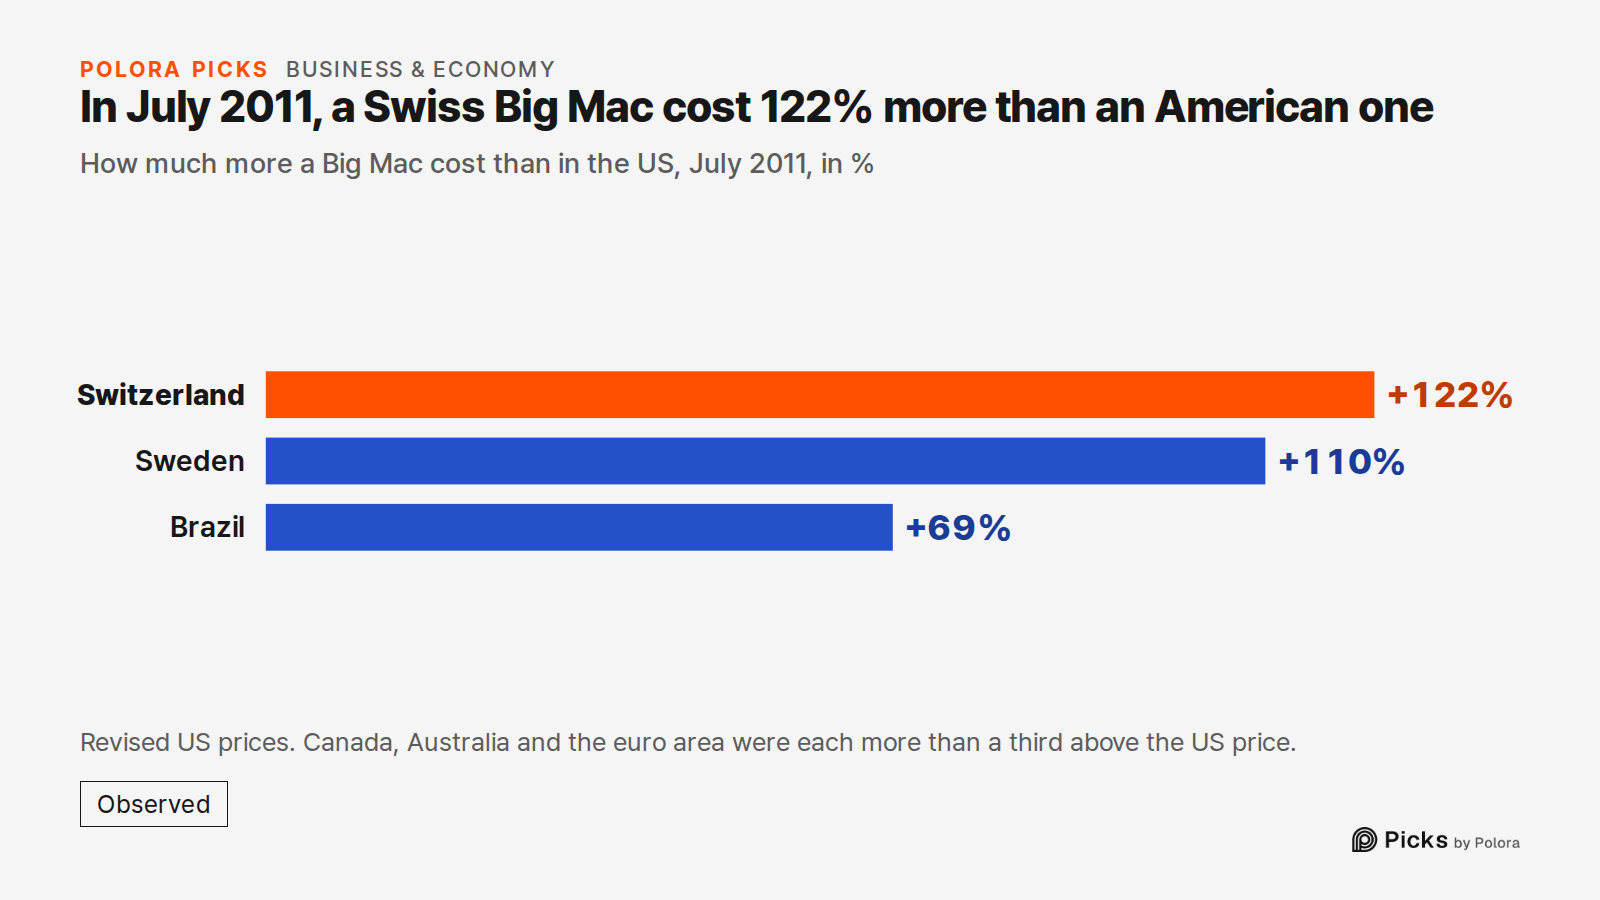
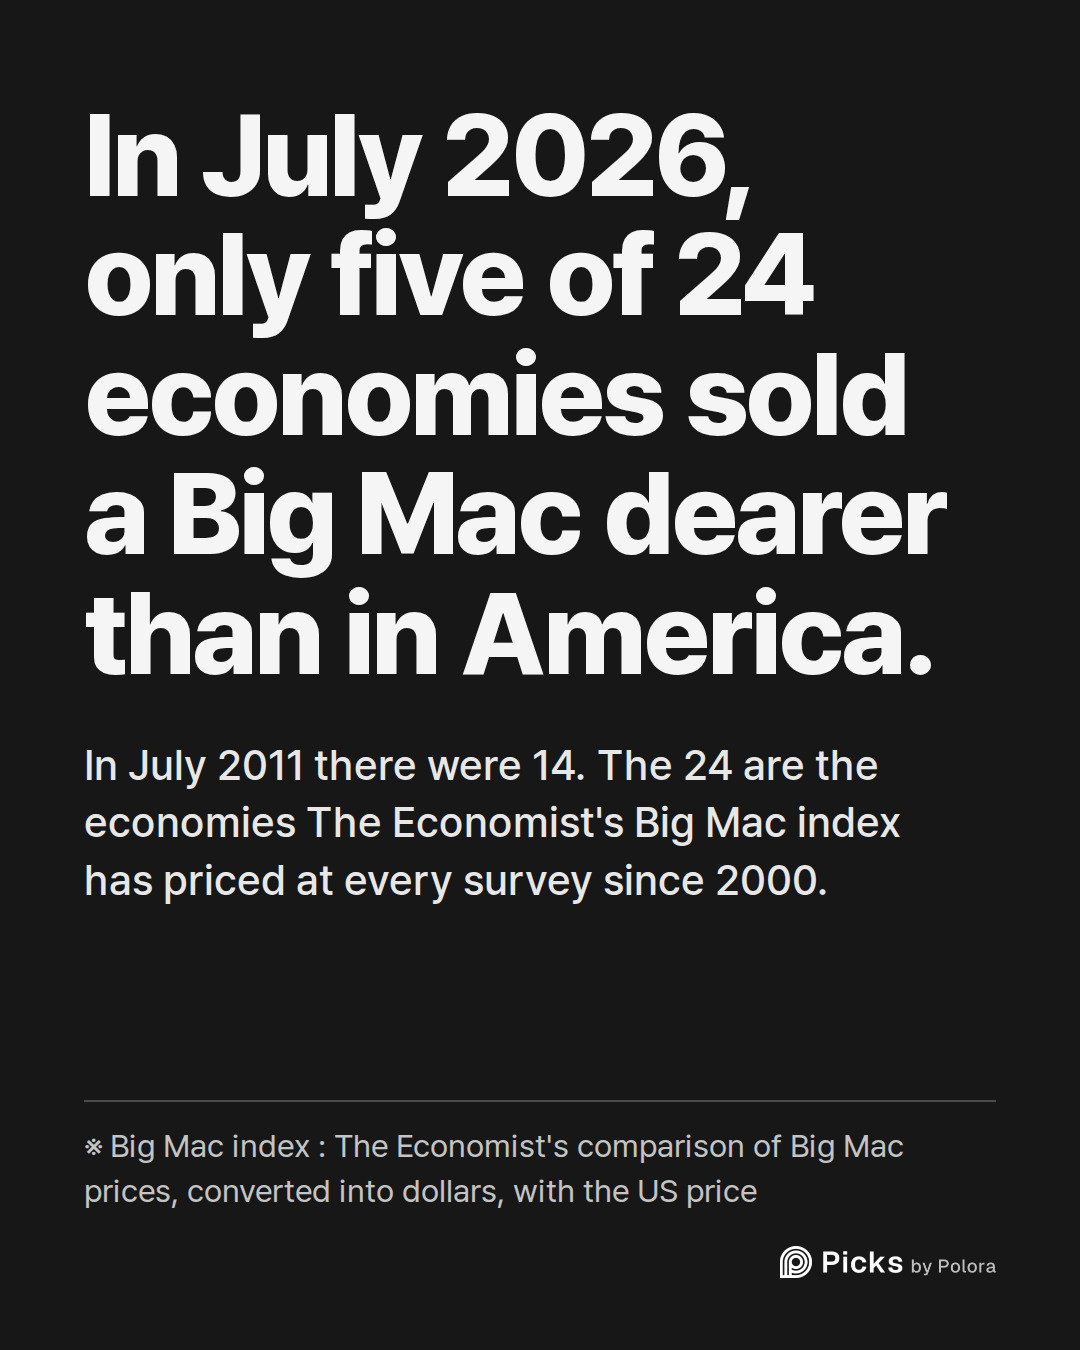
In July 2011, the Big Mac was dearer than in America in 14 of the 24. Switzerland's cost $8.06, against $3.64 in the US, 122% more. Sweden's was 110% dearer, Brazil's 69%, and Canada, Australia and the euro area were each more than a third above the US price.
One revision matters here. In July 2022, The Economist stopped averaging the US price from four big cities and switched to a price provided by McDonald's, and it applied the new US price to the whole history. The new US prices are lower, which makes every other country look dearer by comparison. On the US prices The Economist used before that revision, July 2011 was dearer in 10 of the 24, not 14. The film and this piece use the publisher's current, revised figures ; on either set, 2011 is near the top of the range.
2011 to 2016 : the exchange rate did most of the work
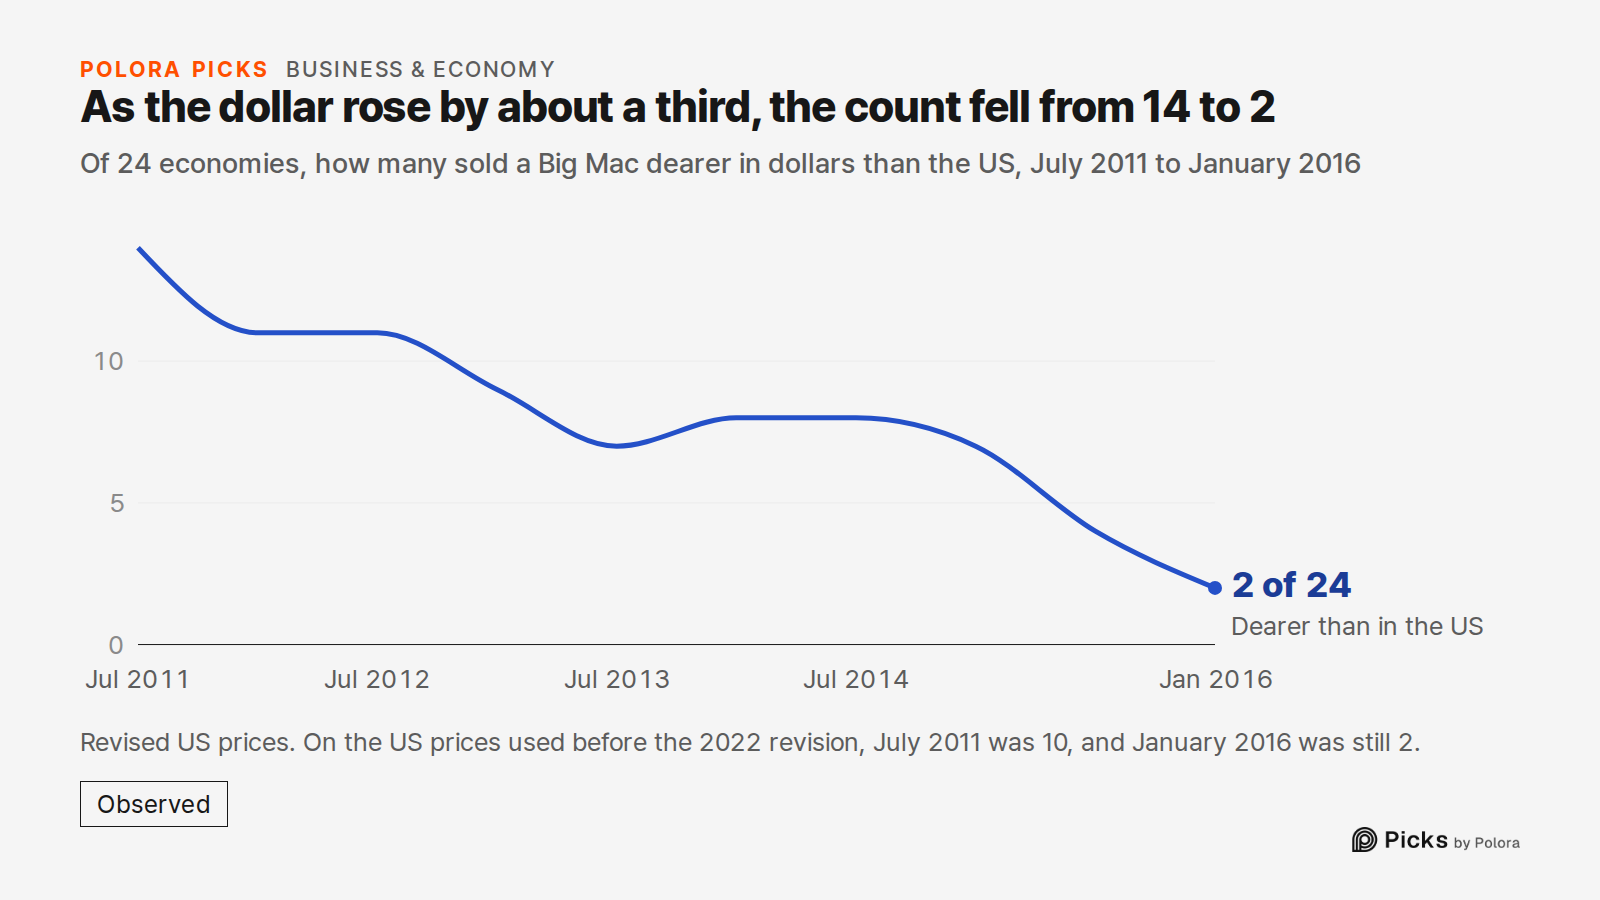
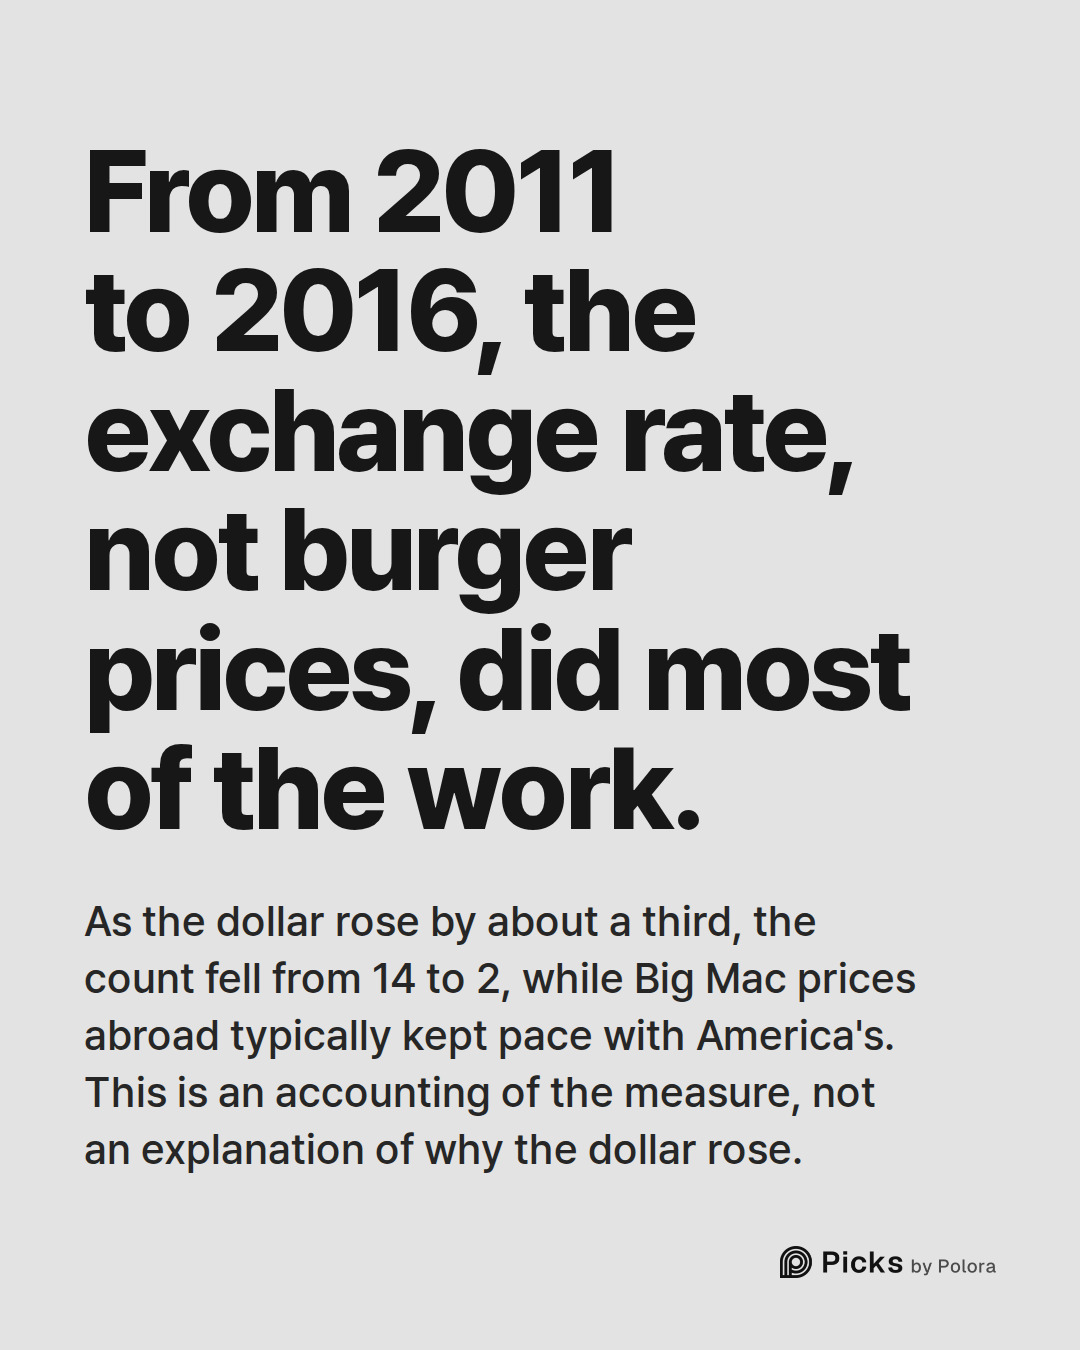
Over the next four and a half years the count fell to two. By January 2016 only Switzerland and Sweden were dearer than America, and that is true on the US prices used before the revision as well as on the revised ones : two of 24 either way.
In the same stretch the dollar strengthened a lot. The Federal Reserve's broad dollar index, which measures the dollar against the currencies of America's trading partners, averaged 86.3 in July 2011 and 115.2 in January 2016, a rise of about a third.
The index's own arithmetic shows where the fall came from. Each economy's change relative to America can be split into two parts : how its local Big Mac price moved against the US price, and how its currency moved against the dollar. Across the 24, the typical price part was close to zero, so local prices kept pace with America's, while the typical currency part was large. In most of the 24, the currency did more to cut the burger's price relative to America's than local prices did. That is an accounting of the measure, not an explanation of why currencies moved ; this piece does not try to say why the dollar rose.
Japan shows the same pull over a longer stretch. Its Big Mac cost $4.08 in July 2011 and $3.04 in January 2024, when it was 47% cheaper than in America, about half the US price.
Europe turns dearer again
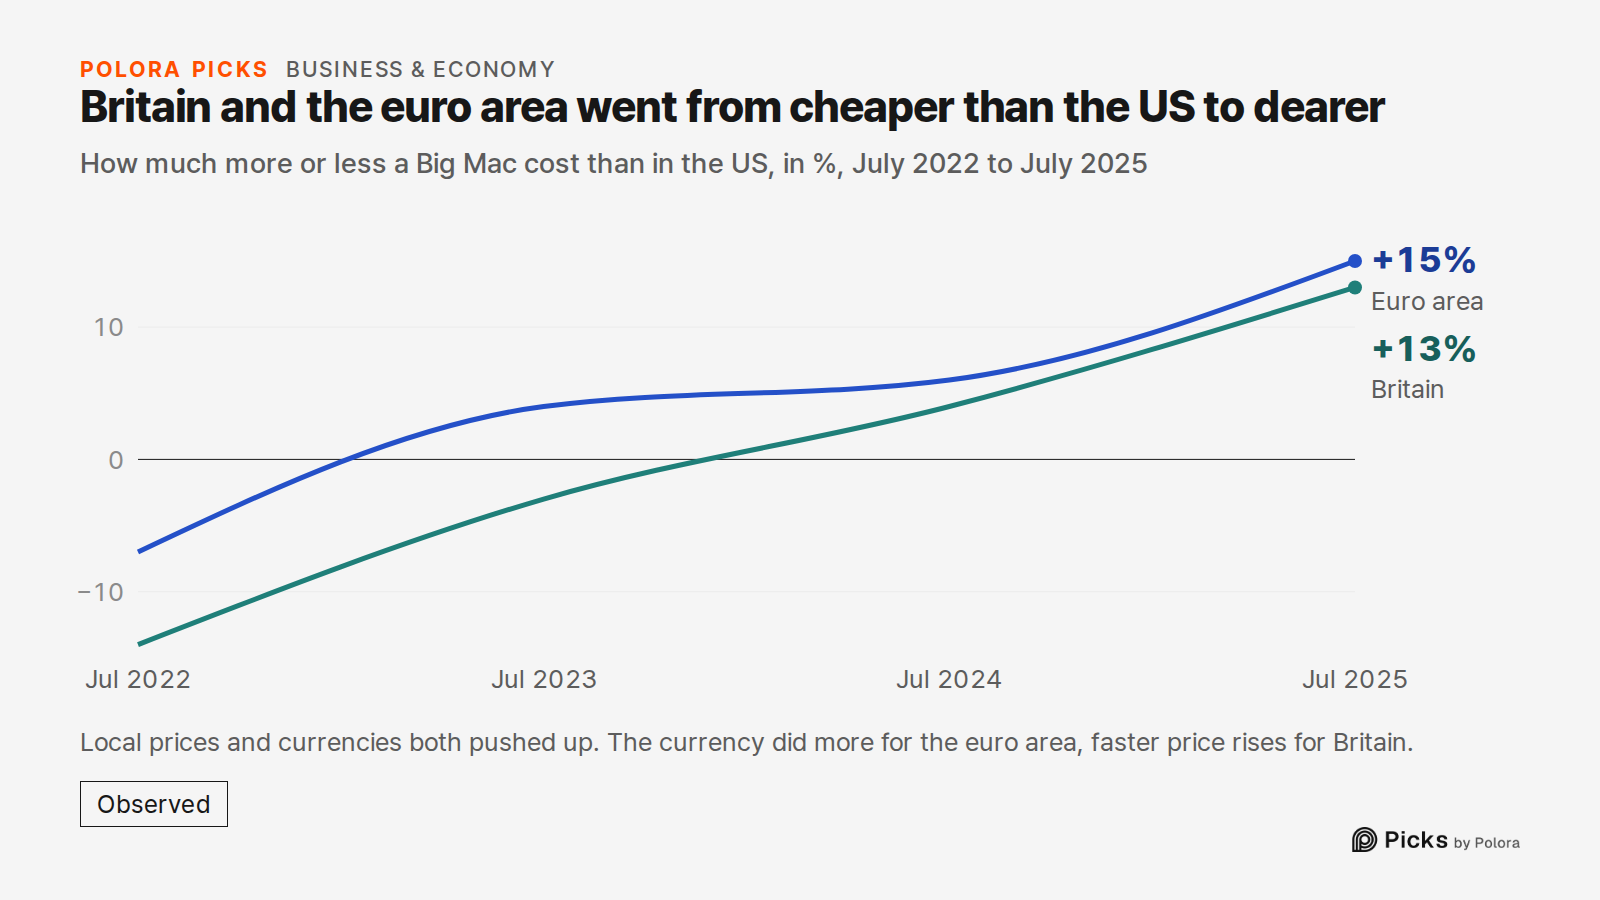
In July 2022, both Britain and the euro area were cheaper than America. By July 2025 both were dearer : the euro area by 15% and Britain by 13%.
This time both parts moved the same way. Between July 2022 and July 2025, Big Mac prices in euros and pounds rose faster than the US price, and the euro and the pound gained against the dollar. For the euro area the currency did more of the work ; for Britain, faster price rises did. The broad dollar index itself changed little over those three years, so this was not simply the dollar weakening across the board.
July 2026 : five of 24
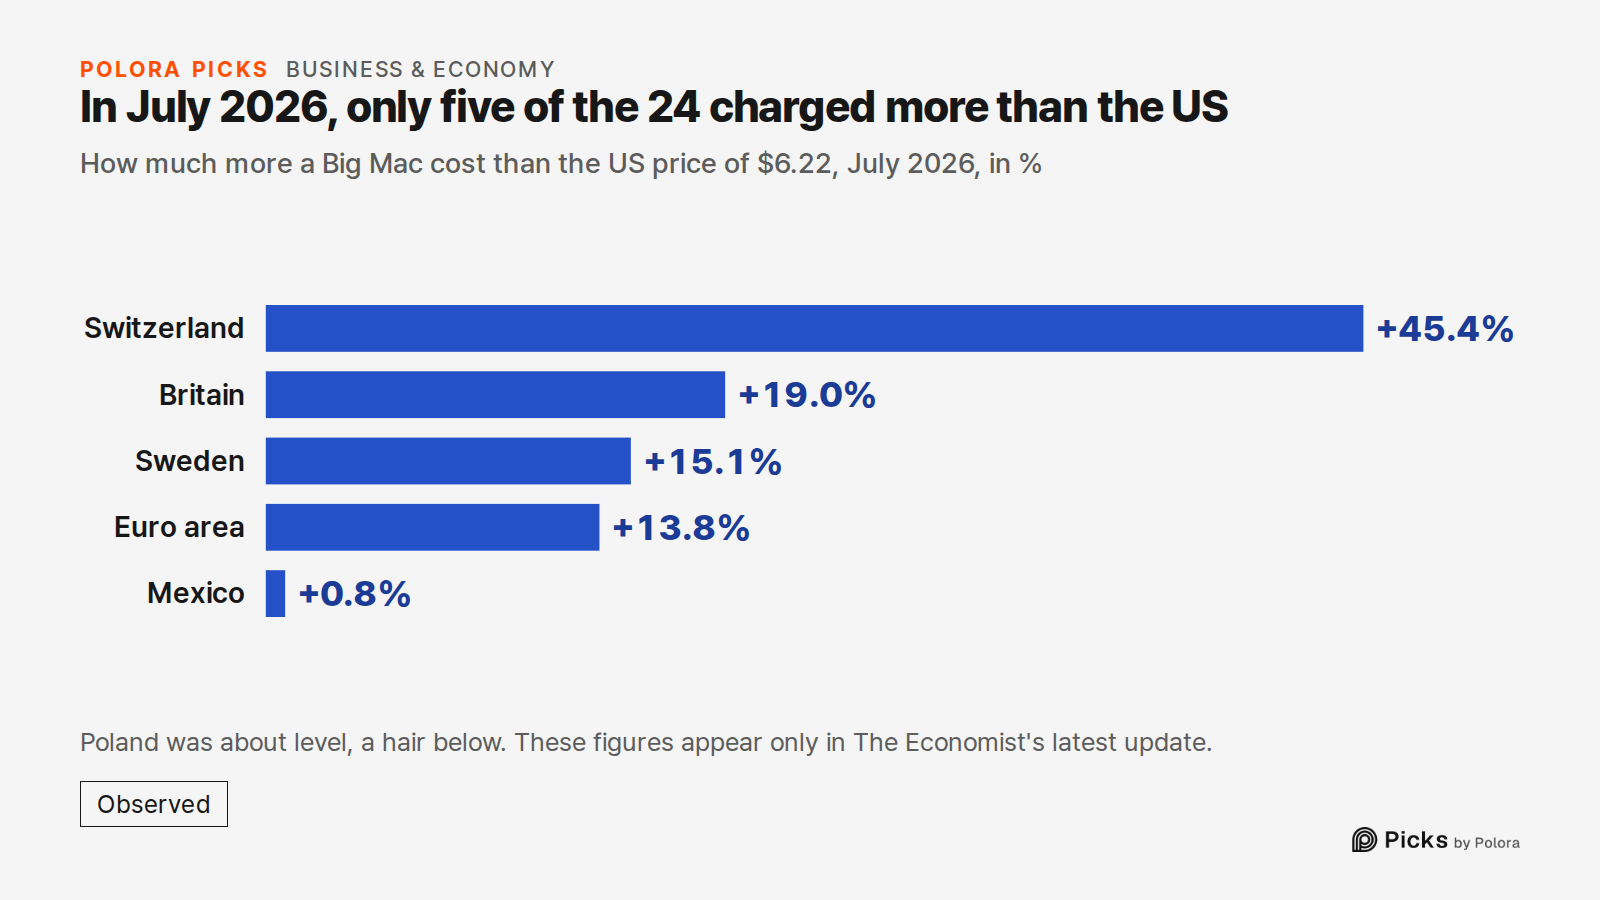
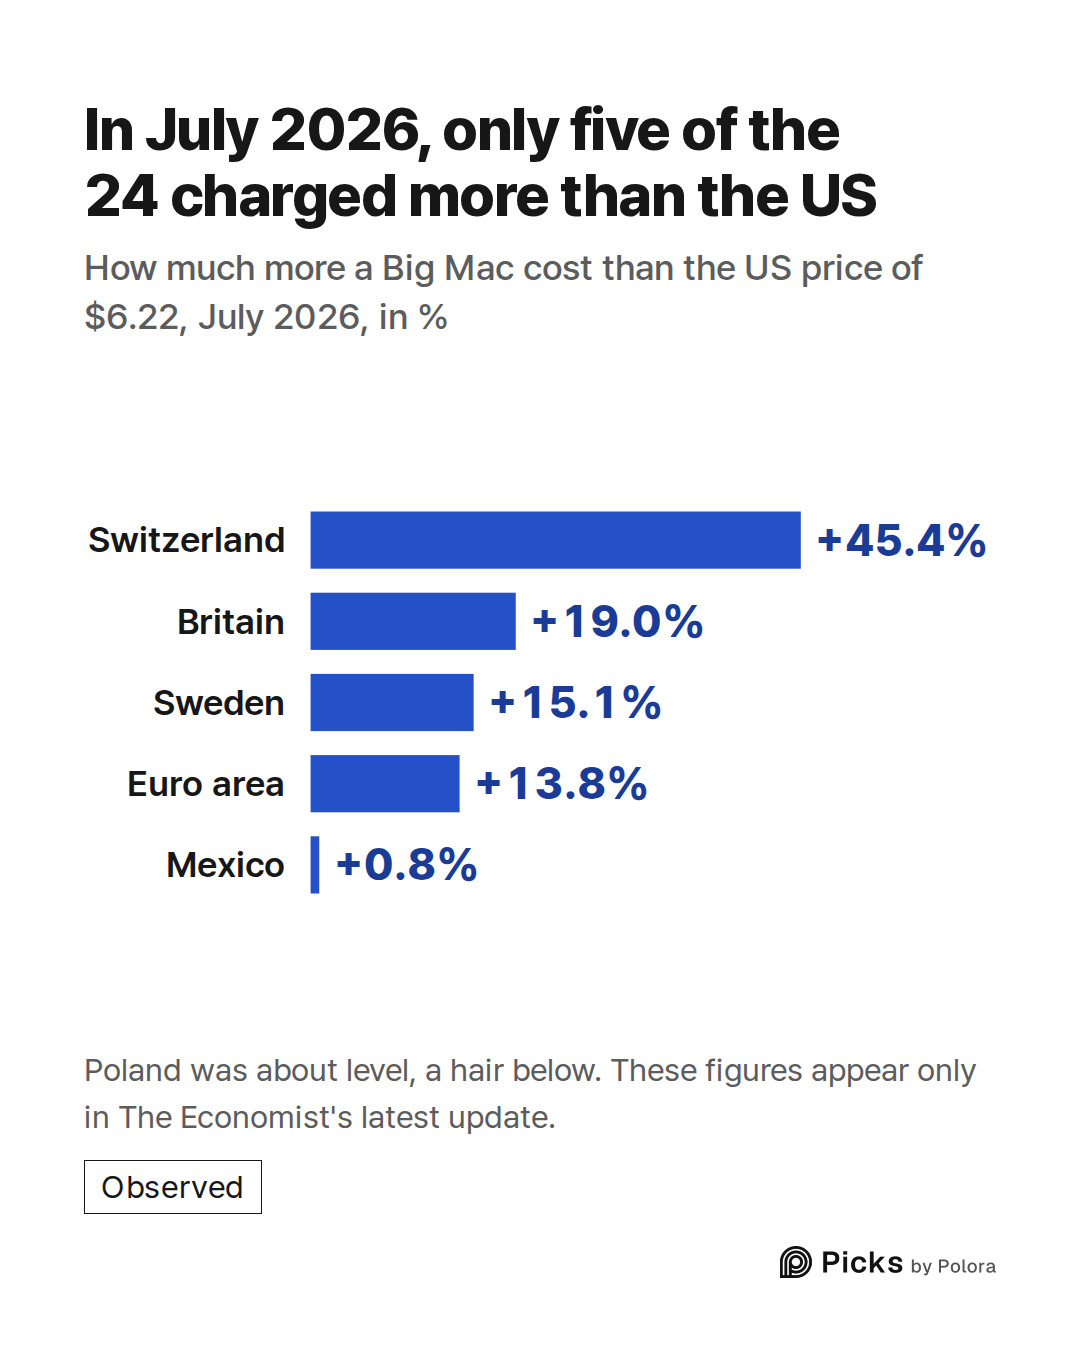
By July 2026, a Big Mac in the US cost $6.22, up from $3.64 in 2011 and $2.24 in April 2000 on the revised series. Five of the 24 charged more : Switzerland by 45.4%, Britain by 19.0%, Sweden by 15.1%, the euro area by 13.8%, and Mexico by just 0.8%. Poland was about level, a hair below the US price.
That makes the latest count fragile. Mexico and Poland sit so close to zero that a small move in either country's price or currency could make it four or six. These July 2025 and July 2026 figures also appear only in The Economist's latest update, so unlike the earlier ones they could not be checked against a previous release. The film skips January 2026, because The Economist later revised its euro-area figure for that date, and the change could not be checked against its stated reason.
What the index is not
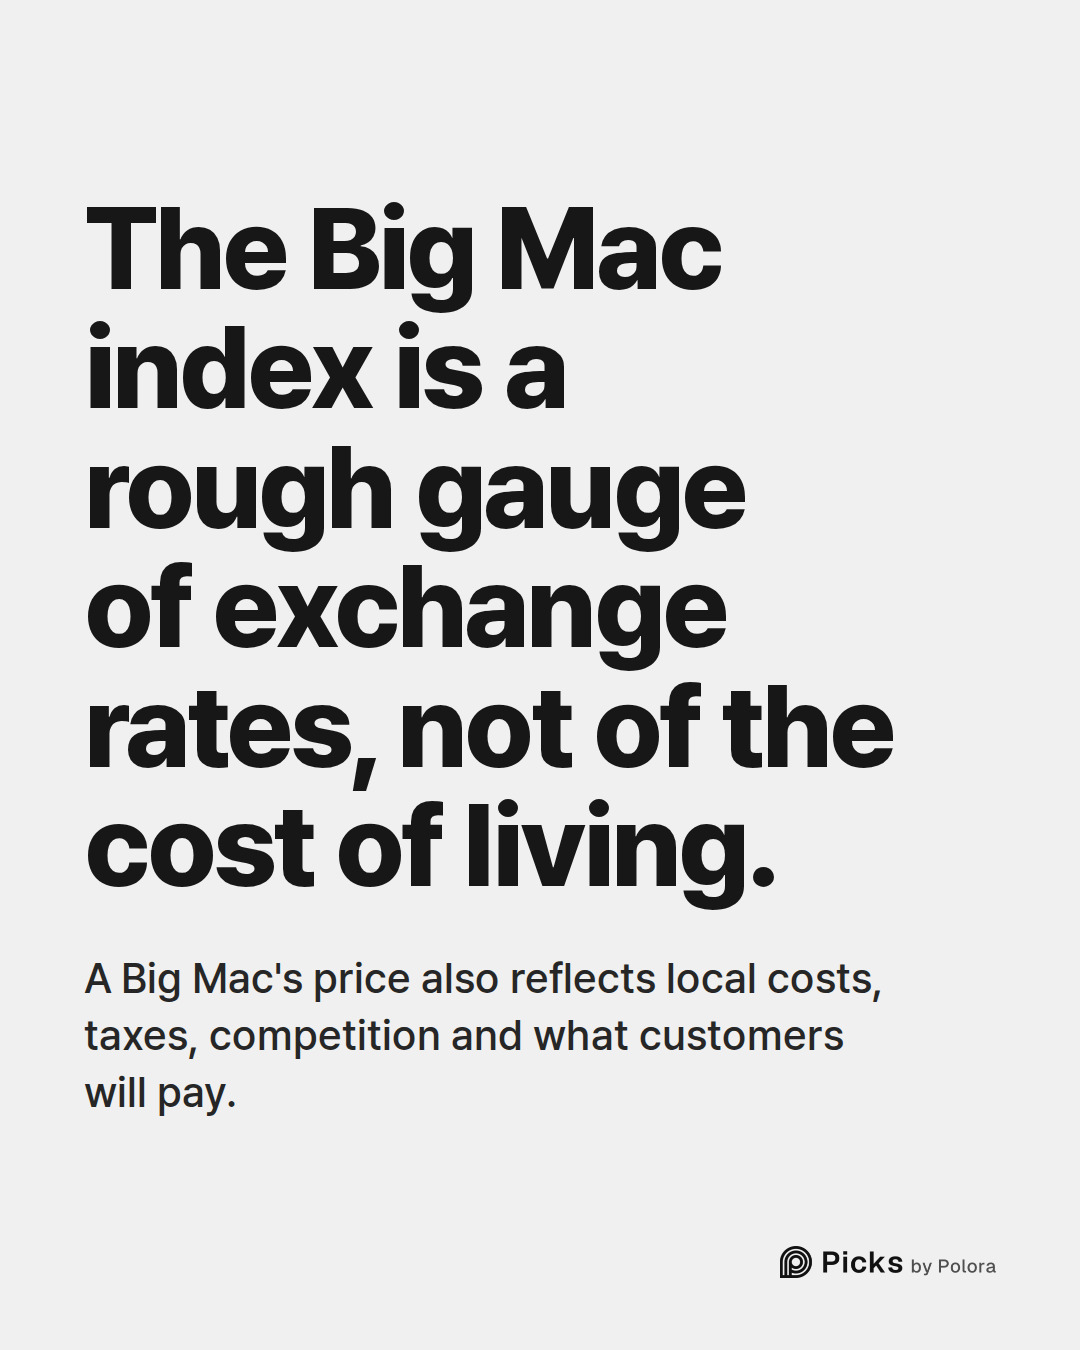
A Big Mac is one product, and its price reflects local costs, taxes, competition and what customers will pay, not only the value of a currency. The index is a rough, readable gauge of exchange rates, not a measure of the cost of living. What the 24 economies show, most clearly between 2011 and 2016, is how much a Big Mac's price abroad, measured against America's, can move with the exchange rate rather than with burger prices themselves.
- The Economist, The Big Mac index: data and methodology (The Economist's own data CC BY 4.0; exchange rates are Reuters/Refinitiv data)
- The Economist, big-mac-data commit history (the July 2026 update)
- Federal Reserve Board, H.10 Foreign Exchange Rates: Nominal Broad Dollar Index, monthly
- Federal Reserve Bank of St. Louis, FRED: Nominal Broad U.S. Dollar Index (DTWEXBGS)
- Wikipedia, Big Mac Index
- Wikipedia, Eurozone
![Sources 6 : github.com · The Economist, The Big Mac index: data and methodology (The Economist's own data CC BY 4.0; exchange rates are Reuters/Refinitiv data)], github.com · The Economist, big-mac-data commit history (the July 2026 update)], federalreserve.gov · Federal Reserve Board, H.10 Foreign](https://media.cdn.polora.ai/picks/2026/11/pickrun_2361c3d269ec49d1/rQzWwXp1DmdEYHAw-slide-07--where-does-a-big.jpg)