Family, then coworkers, then children, then a partner
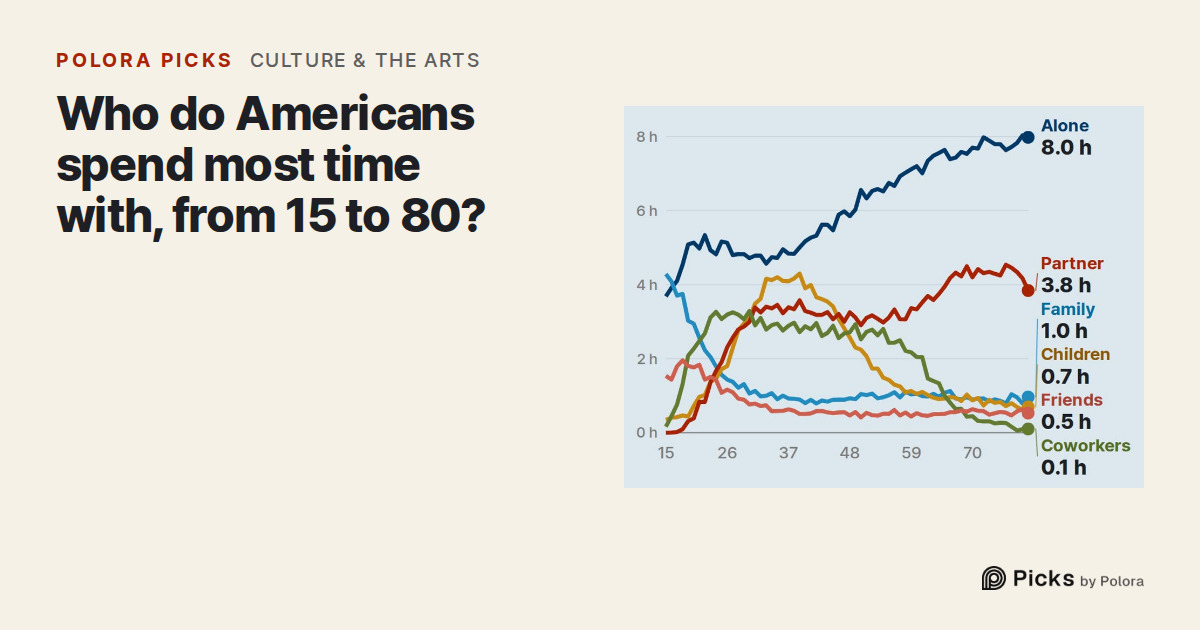
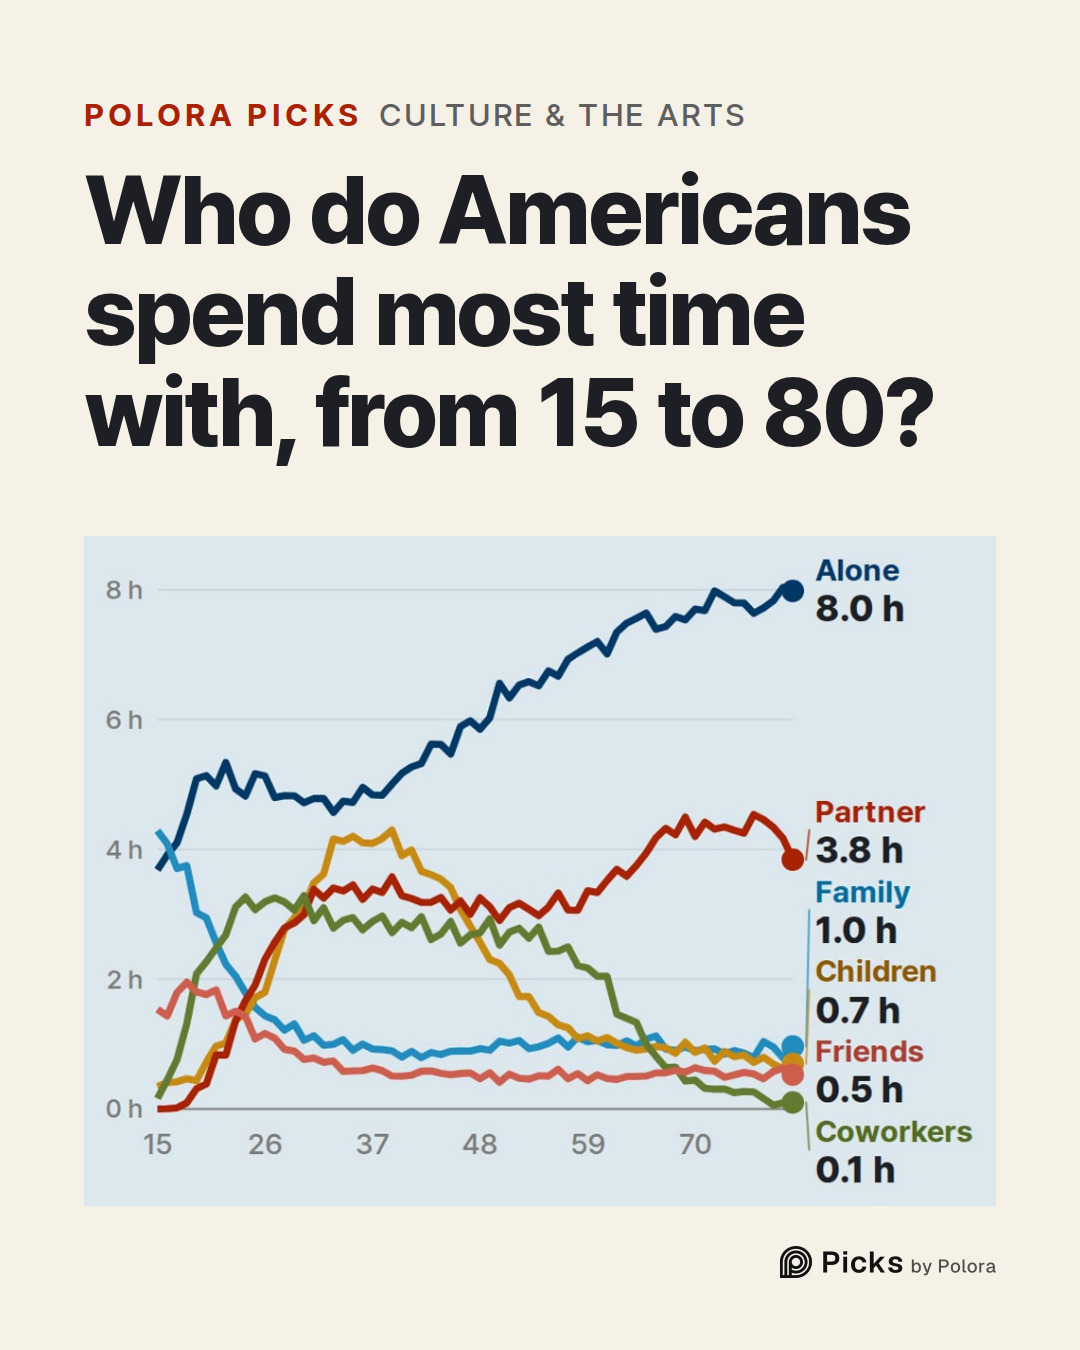
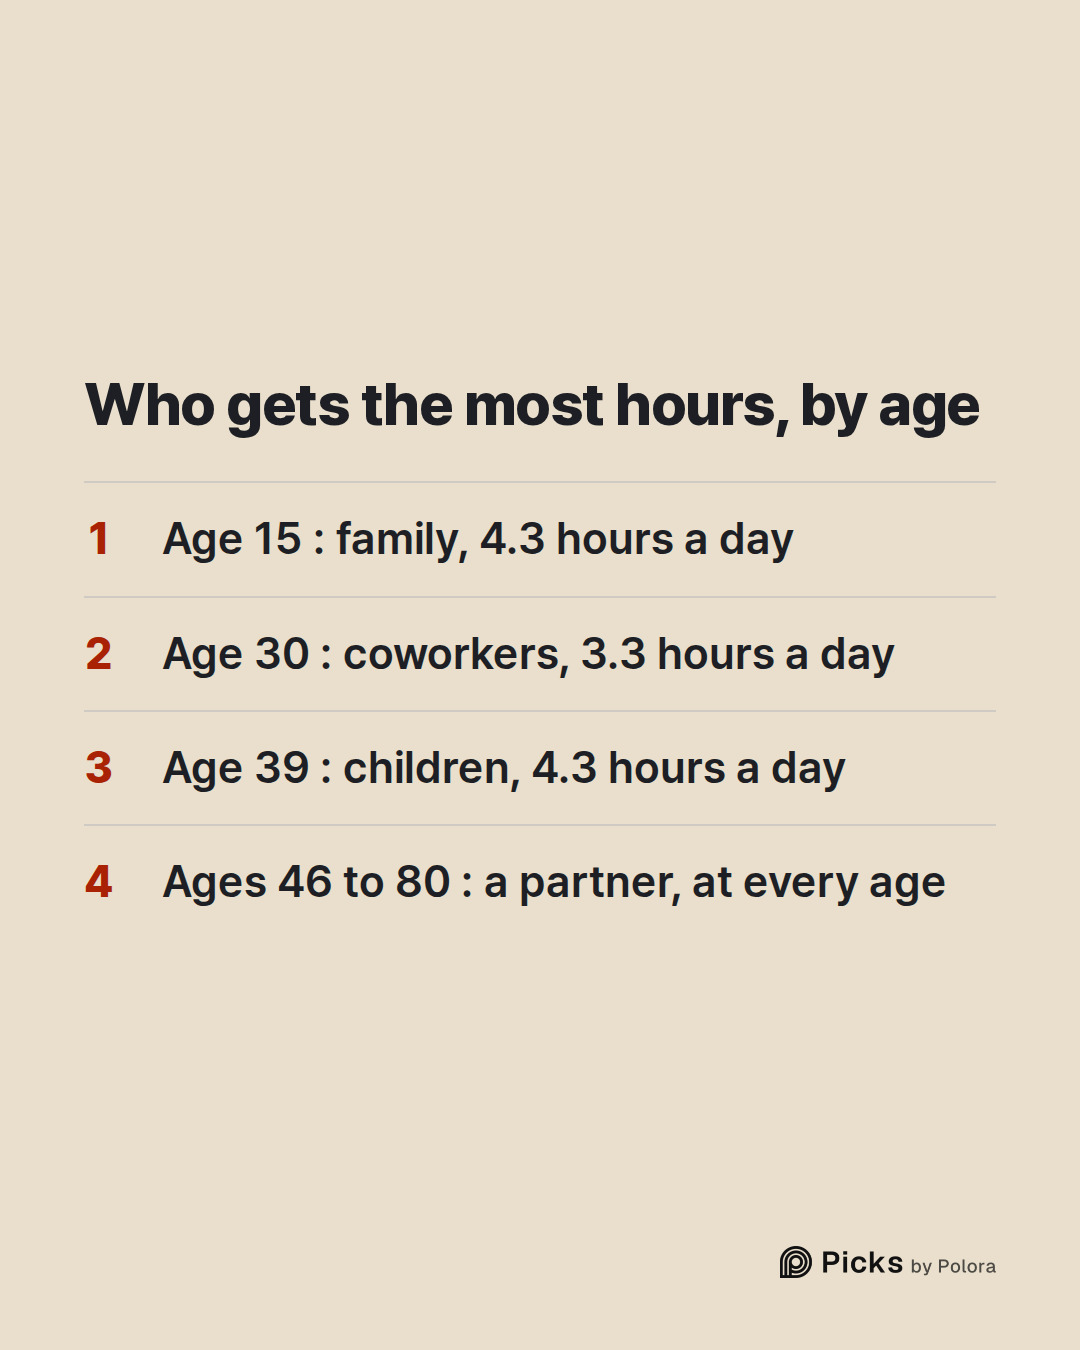
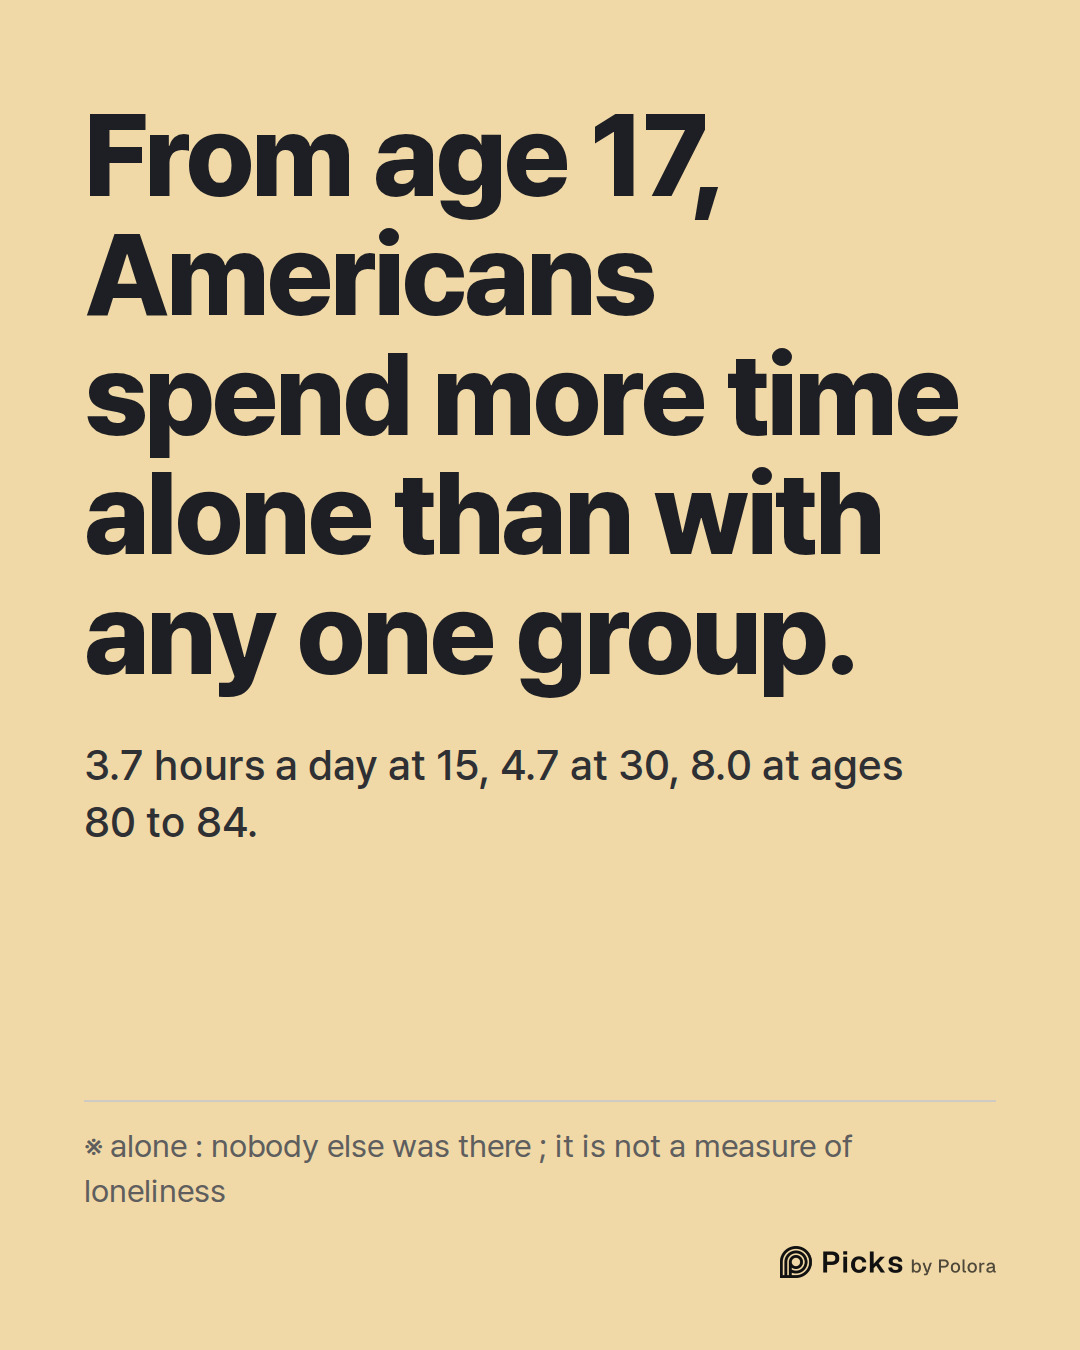
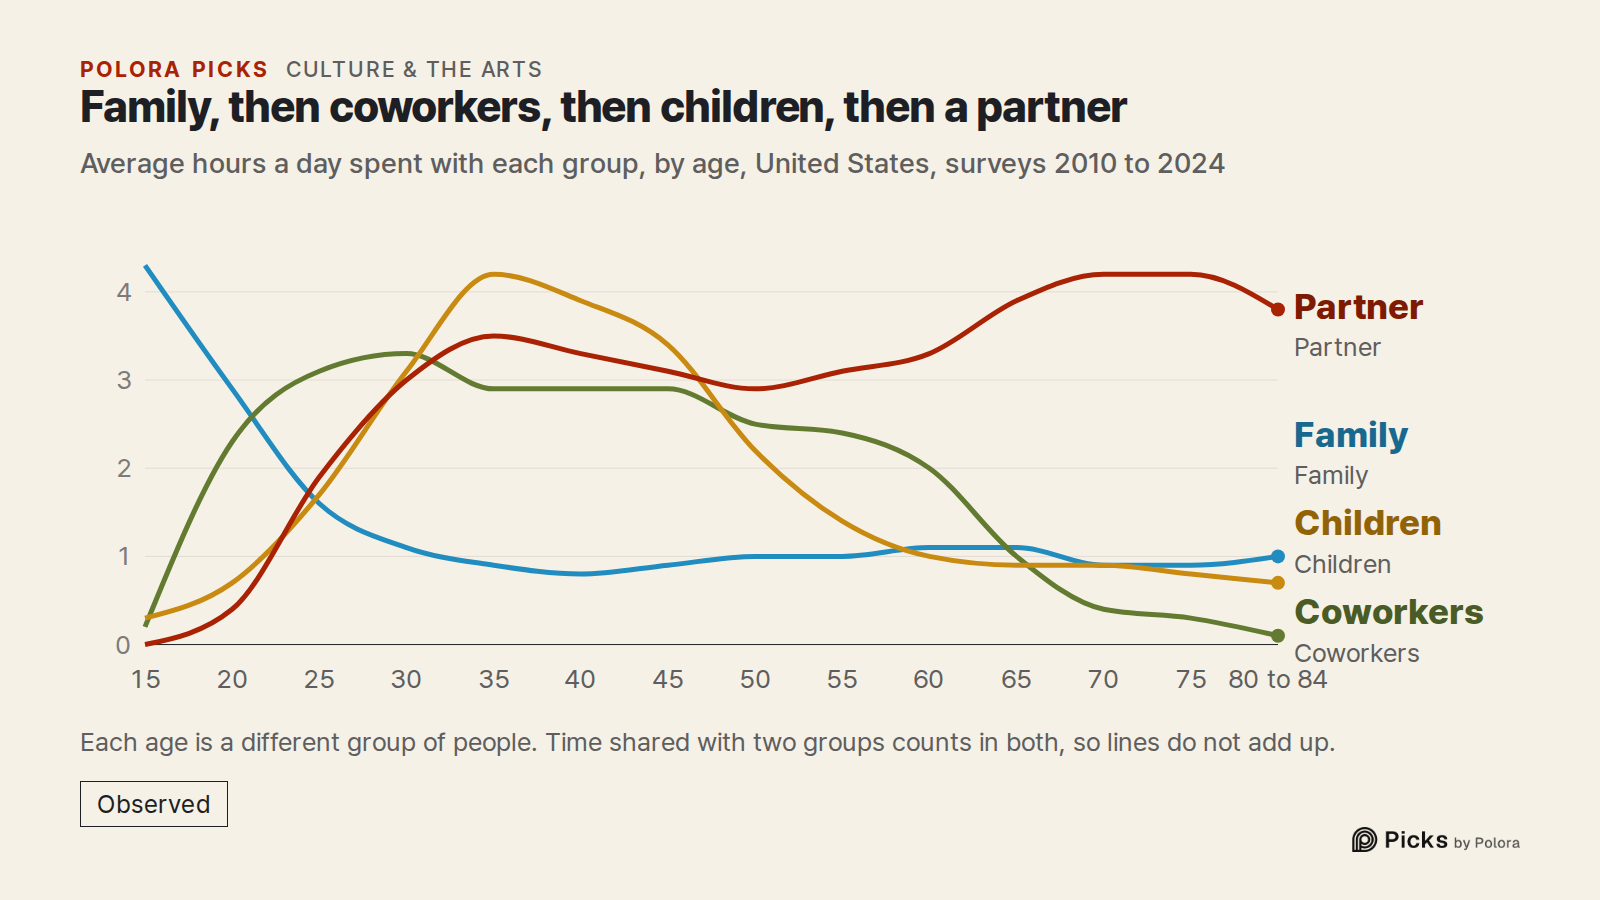
At 15, Americans spend 4.3 hours a day with family, more than with any of the other groups of people counted here. By 17, though, time alone is larger than time with any one of those groups, and it stays that way at every age up to the oldest group, 80 to 84.
Among the groups, coworkers lead from 22, reaching 3.3 hours a day at 30. Friends go the other way : from 28 on, they get less than an hour a day.
In the thirties, children take over. At 39, people spend 4.3 hours a day with children, against 3.6 with a partner. From 46 to 80, a partner leads at every age, while coworkers fade, to 1.0 hour a day by 65.
Beneath all of this, time alone keeps rising, with small dips along the way : 3.7 hours a day at 15, 4.7 at 30, at least 7 at every age from 58, and 8.0 at ages 80 to 84.
Women and men differ on children and partners
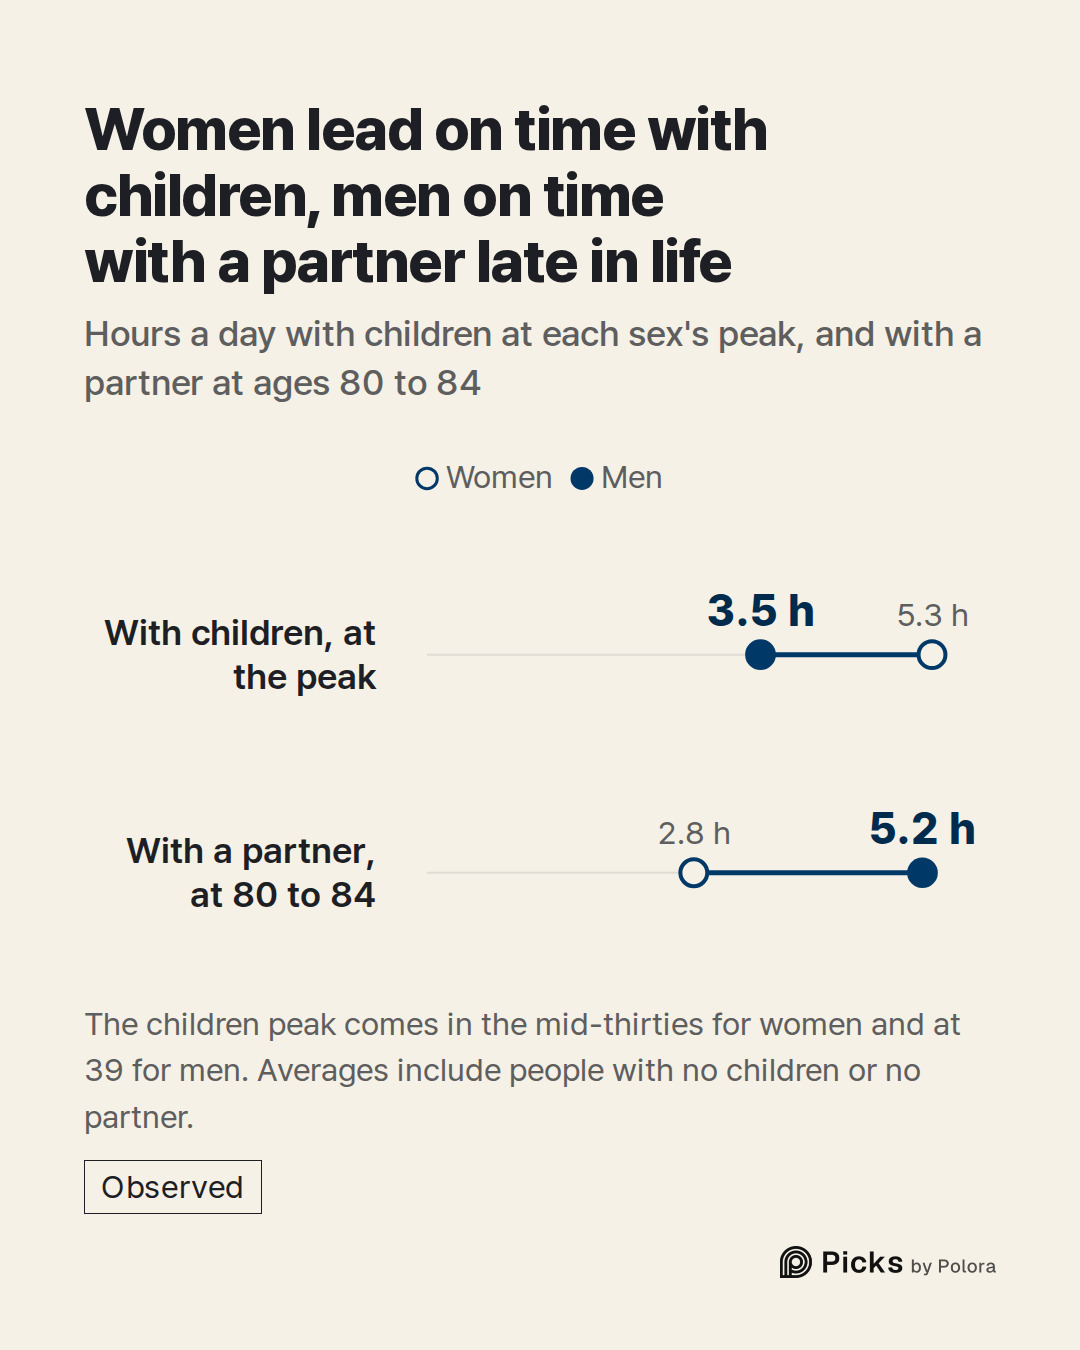
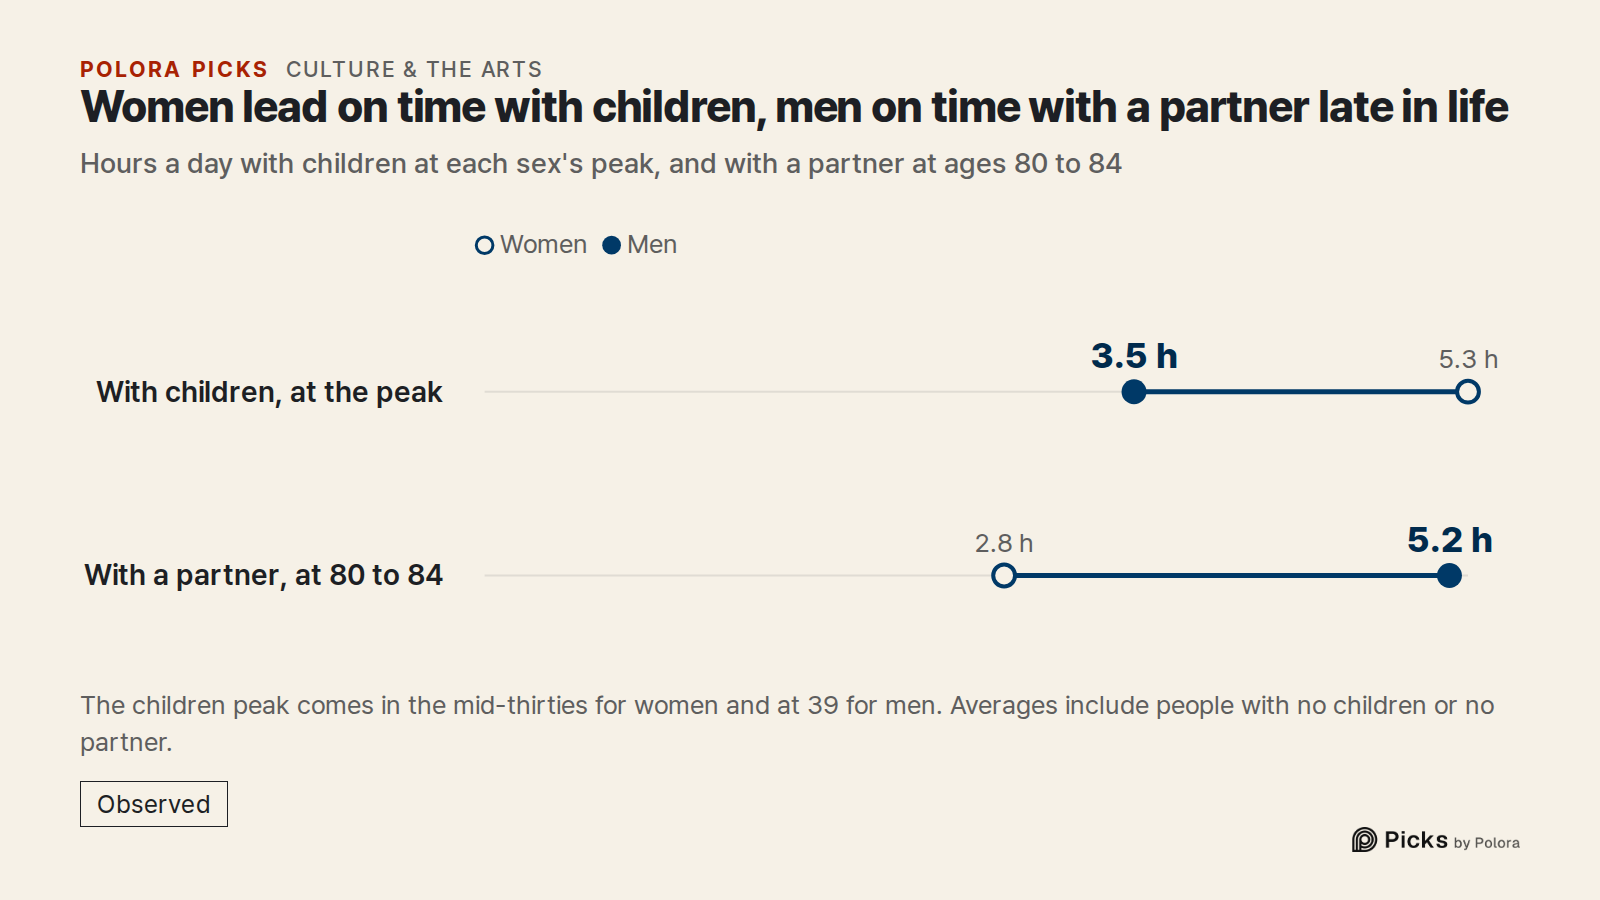
Those figures are for everyone together, which hides a large difference. For women, children are the group they spend the most time with at every age from 27 to 47, peaking at 5.3 hours a day in their mid-thirties. For men, children never come first; their time with children peaks at 3.5 hours a day at 39.
Late in life the gap turns to partners. At 80 to 84, men spend 5.2 hours a day with a partner and women 2.8. The survey does not say why. Like every figure here, it is an average over everyone of that age, including people with no partner at all, so it reflects how many people of that age have a partner as well as how much time couples spend together.
What counts as time "with" someone
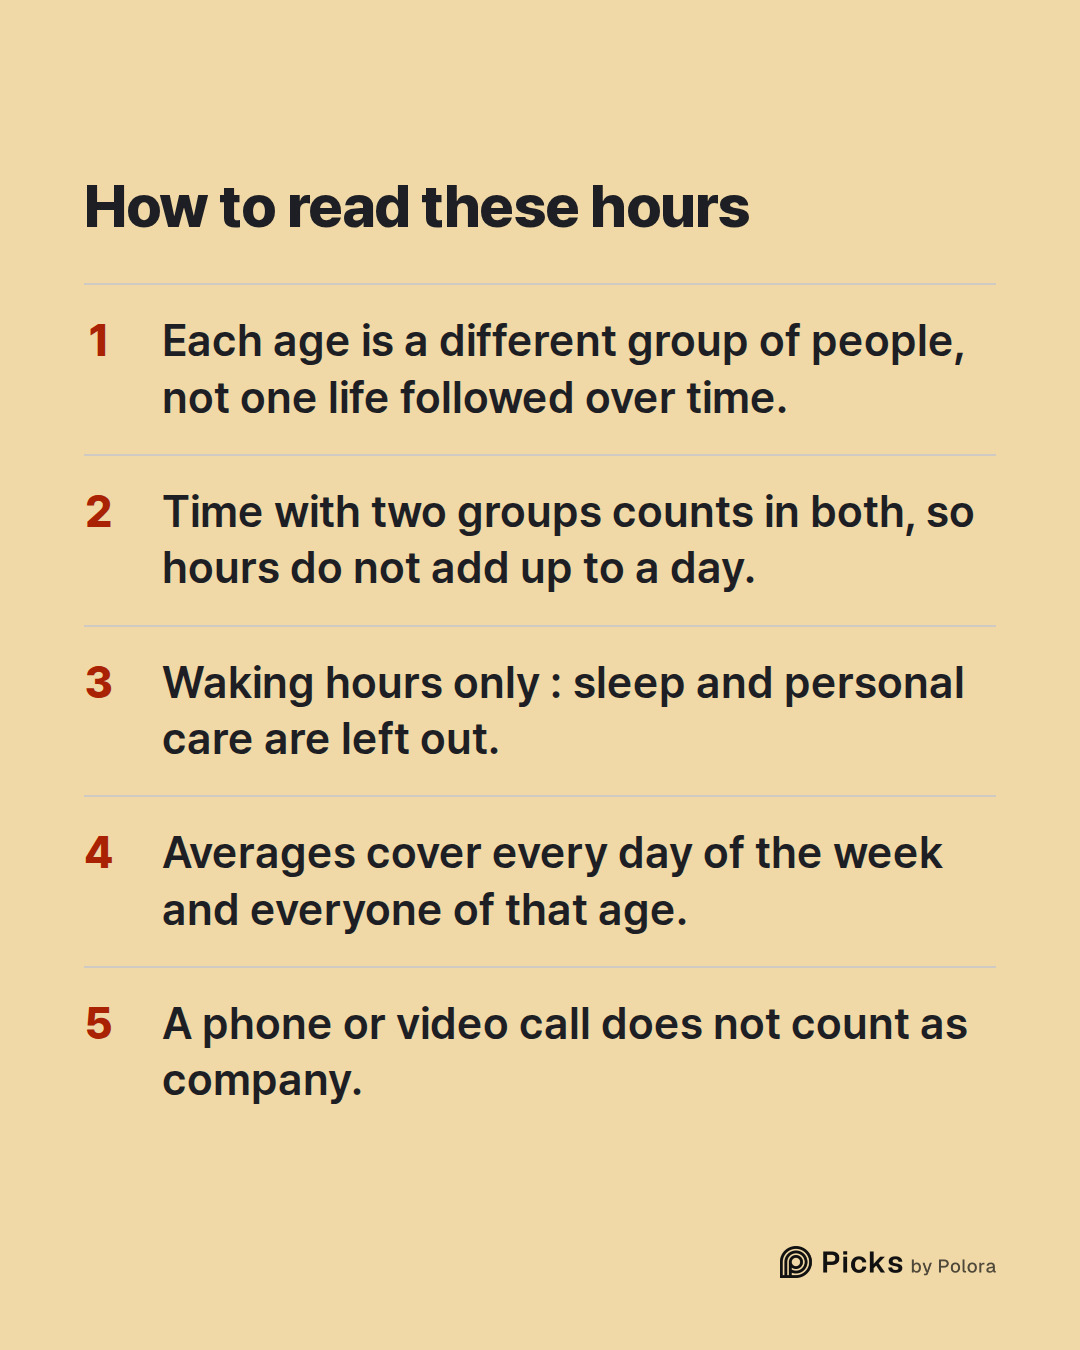
The figures come from the American Time Use Survey, run by the U.S. Bureau of Labor Statistics (BLS). One person aged 15 or over is picked from each sampled household, and the households are drawn from those that took part in the government's Current Population Survey. That person is interviewed about one assigned day, the day before the interview, activity by activity, and asked who was in the room or who came along. A phone or video call does not count as company.
Three things follow. Time with two kinds of people counts in both : a dinner with a partner and children adds to both, so the figures do not add up to a day. Sleep, grooming and personal care are left out of these figures; BLS records who people were with only during waking hours. And each average covers every day of the week and everyone of that age, with a job or without one. The 3.3 hours with coworkers at 30 is spread over weekends and over people not working; it is not a workday.
The groups are those of Our World in Data (OWID), which processed the survey, and they are not the whole picture : neighbors, customers and other people outside them go into an "Other" group not covered here. Partner includes spouses, boyfriends or girlfriends and partners living together. Children means under 18, in the household or related, grandchildren included. Friends include roommates and lodgers. Family is a group of relatives that OWID's notes do not define further. "Alone" means nobody else was there. It is not a measure of loneliness : the survey asks who was present, not how anyone felt.
Different people at each age
Each age here is a different group of people, not one life followed over time. As OWID notes, the survey draws a new sample every year, so the curve mixes two things : what changes as people age, and how generations differ from one another. Today's young adults will not necessarily spend old age the way today's older Americans do. The survey also covers only people living in households, so people living in institutions, such as care homes, are not in it.
An average of many years, not today
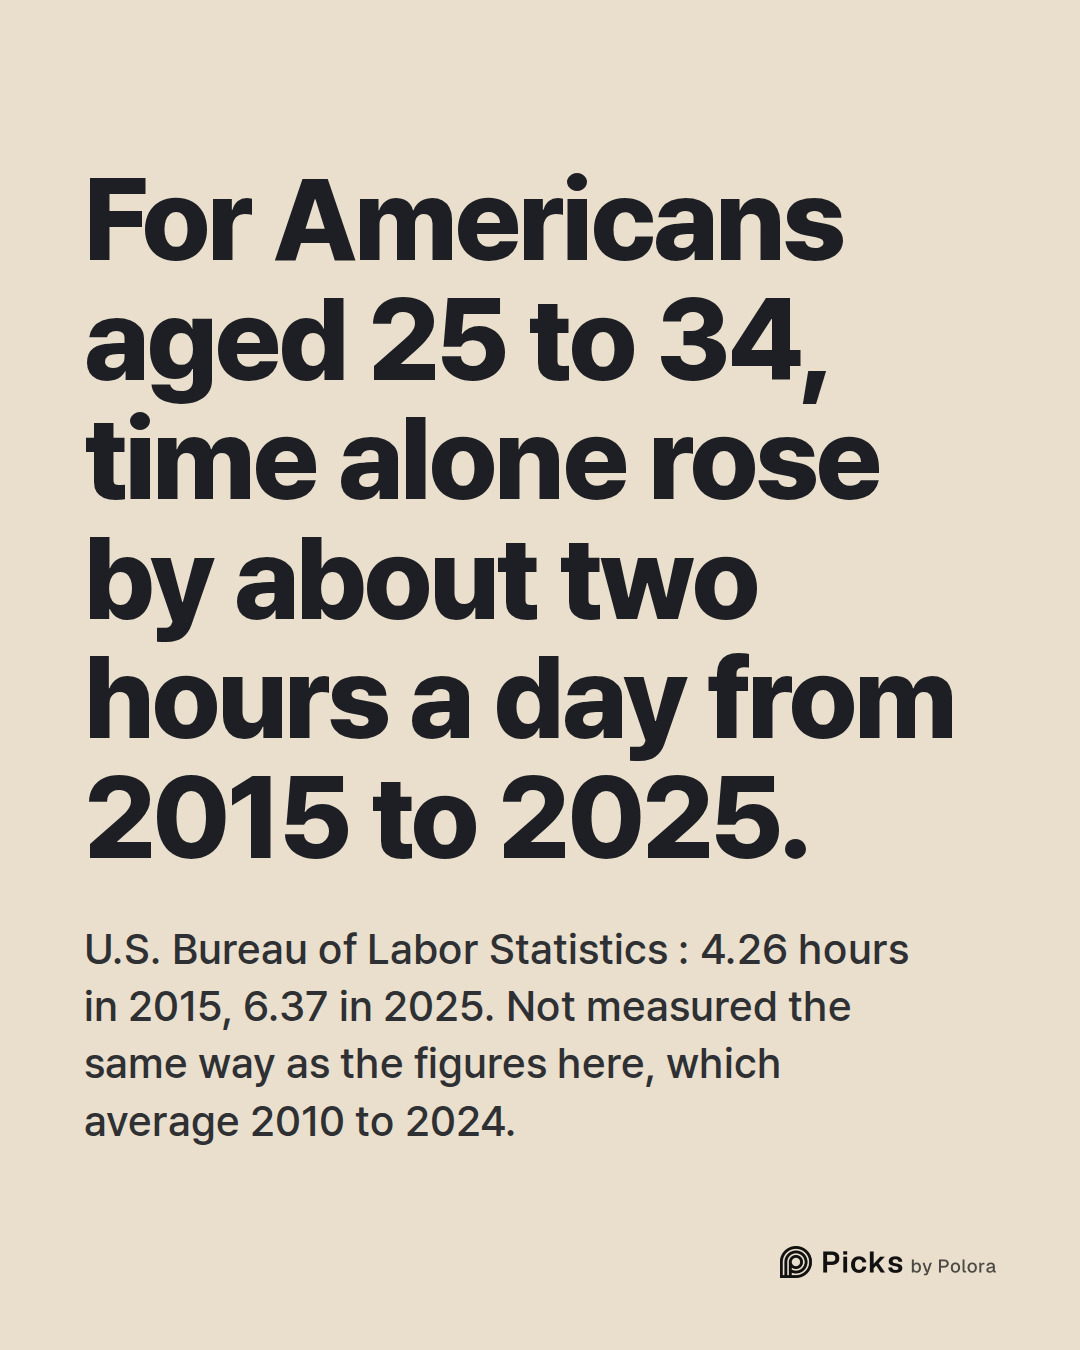
OWID pools the surveys from 2010 to 2024 and leaves out 2020, when the survey was not run for part of the spring. That pooling blurs change over time, and for at least one age band, time alone has risen. BLS's own yearly series for ages 25 to 34 puts their time alone at 4.26 hours a day in 2015, 4.73 in 2019 and 6.37 in 2025. That 2025 figure is more than an hour above the pooled figure used here for every single age from 25 to 34.
The two are not measured identically. Each BLS figure covers one year and a ten-year age band, while OWID pools many years by single age. Their labels differ too : BLS calls its series awake time, while OWID's notes say grooming and personal care are left out as well as sleep, and neither says whether the two treat those activities the same way. So the gap between them need not all be change over time. But within BLS's own series, time alone for this age band rose by about two hours from 2015 to 2025, so for that band at least, recent years may well run above the pooled levels. Read the hours here as an average of 2010 to 2024, not as today's.
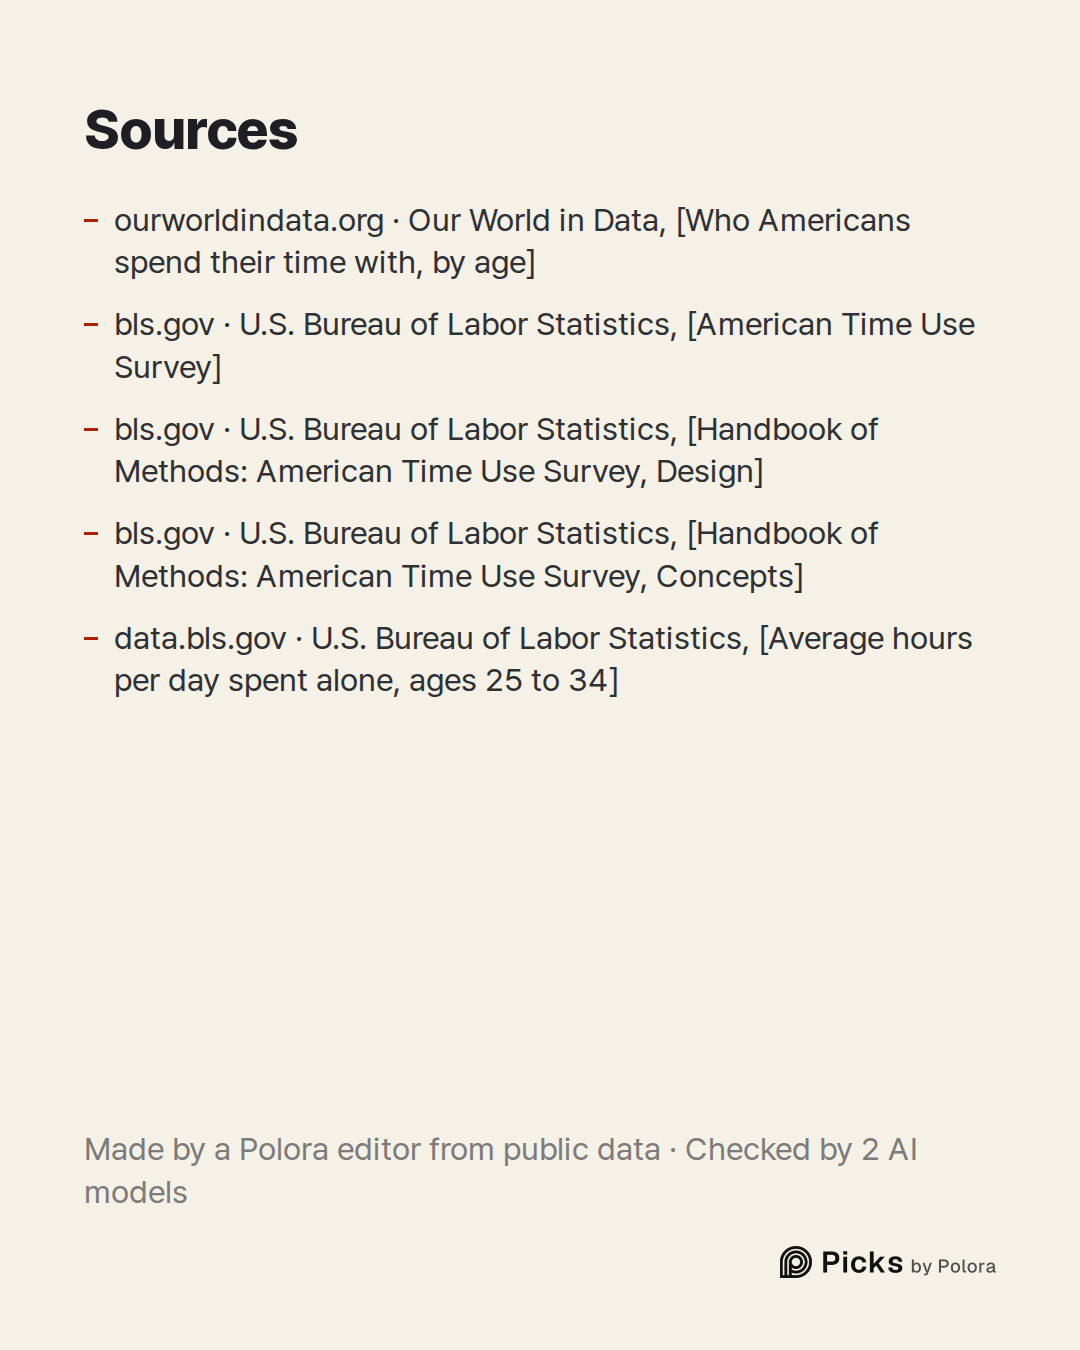
- Our World in Data, [Who Americans spend their time with, by age]
- U.S. Bureau of Labor Statistics, [American Time Use Survey]
- U.S. Bureau of Labor Statistics, [Handbook of Methods: American Time Use Survey, Design]
- U.S. Bureau of Labor Statistics, [Handbook of Methods: American Time Use Survey, Concepts]
- U.S. Bureau of Labor Statistics, [Average hours per day spent alone, ages 25 to 34]