What is being compared
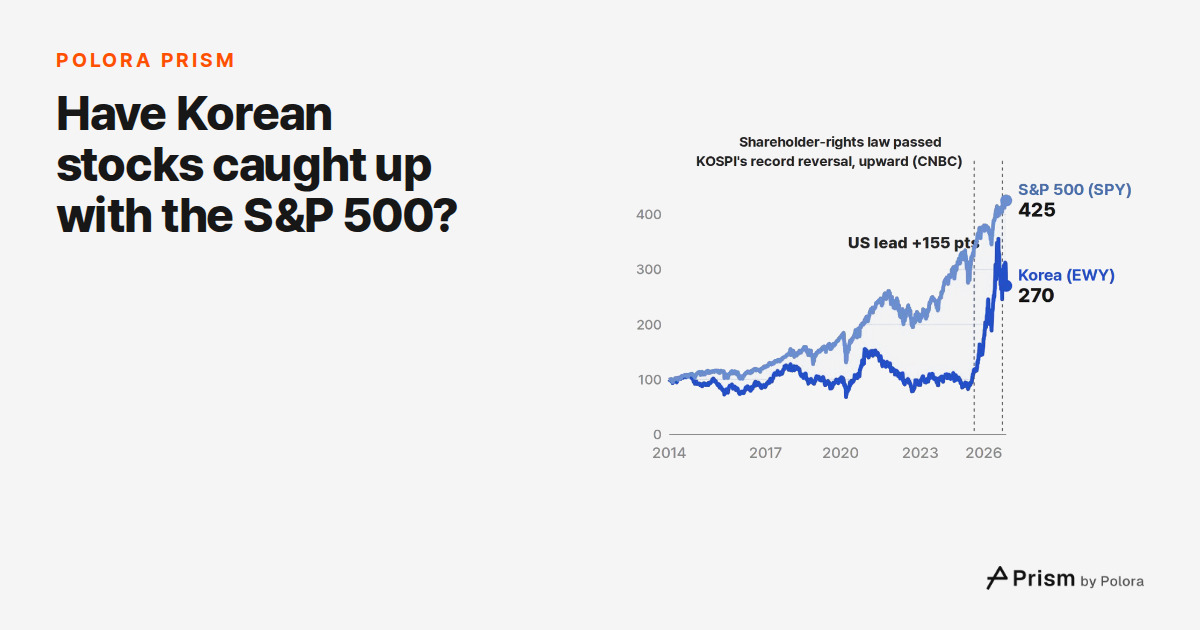
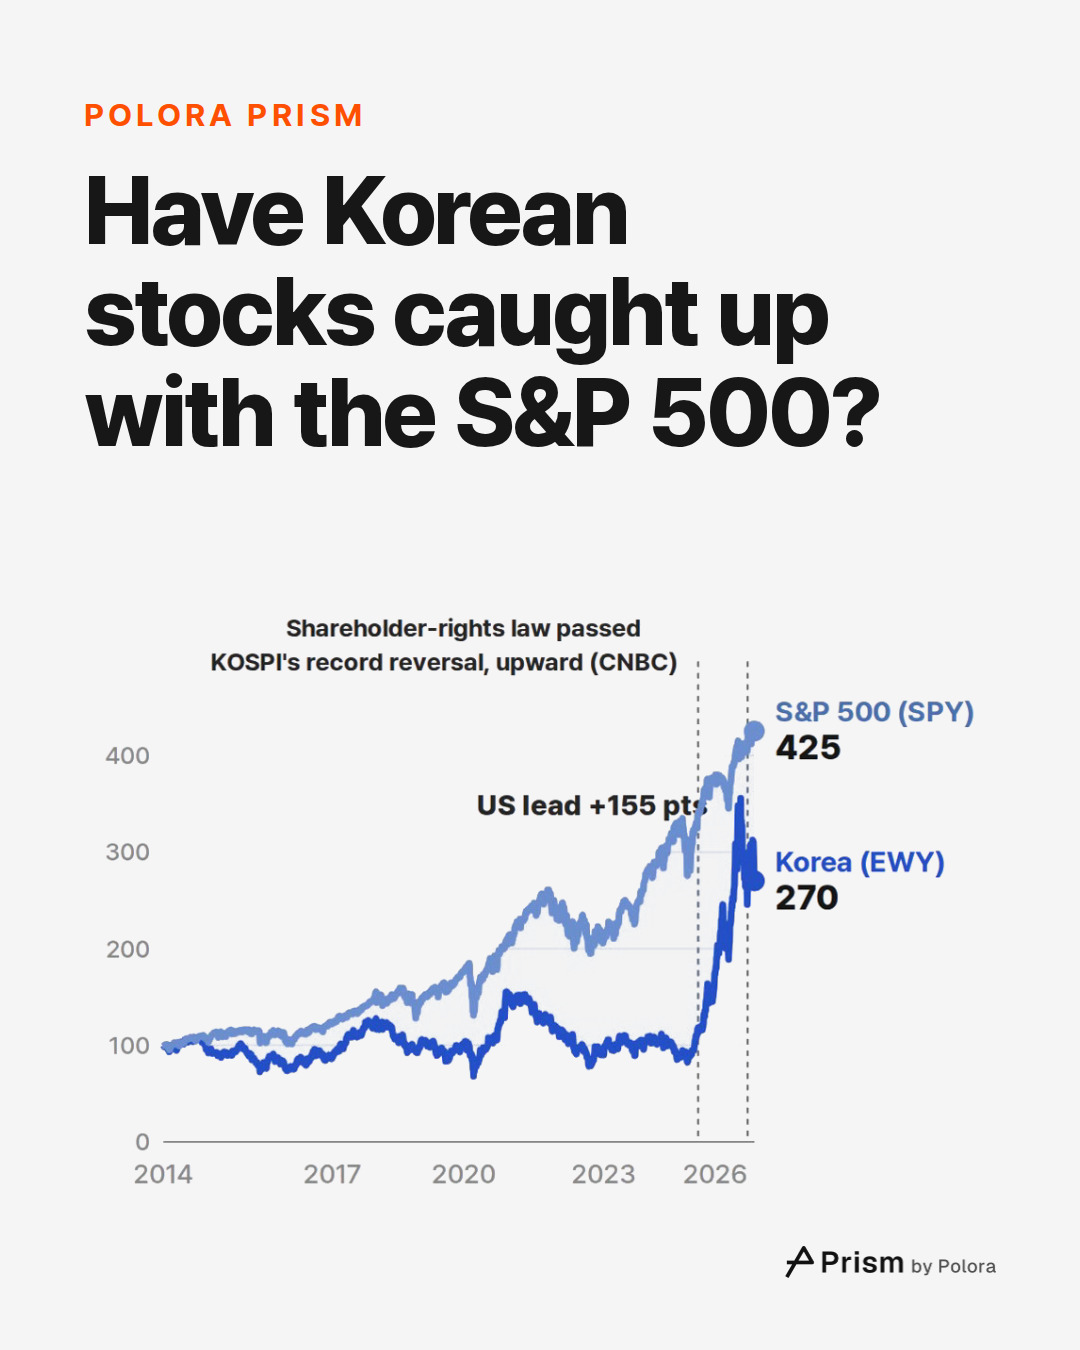
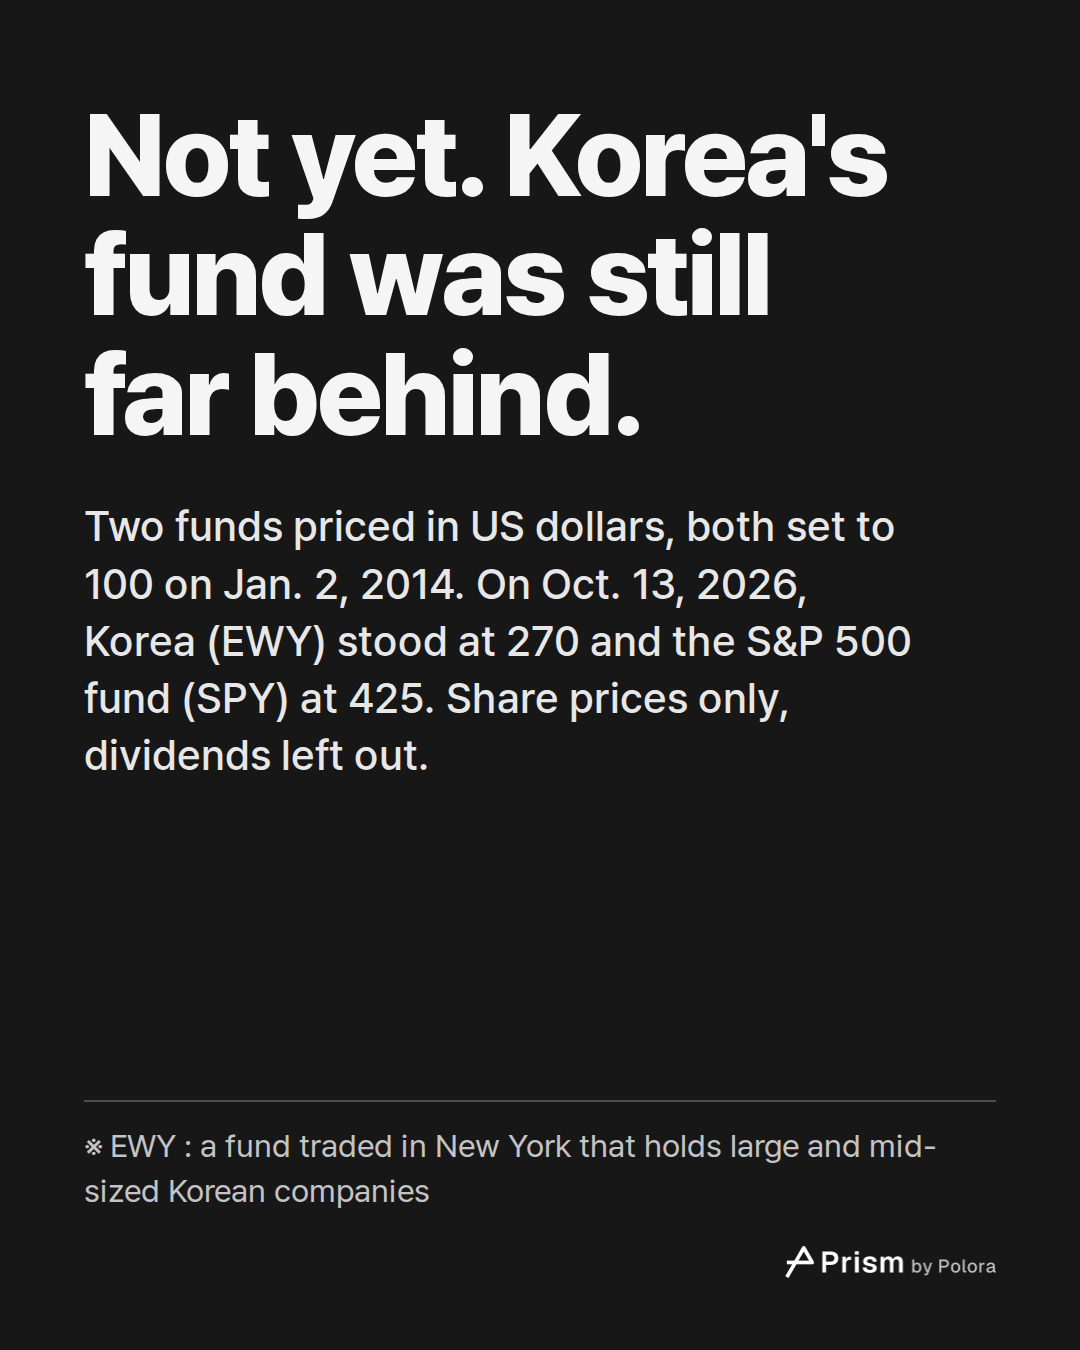
The short film that goes with this piece follows two funds that trade in New York, both priced in US dollars. EWY, the iShares MSCI South Korea ETF, holds large and mid-sized Korean companies. SPY, the State Street SPDR S&P 500 ETF Trust, follows the S&P 500. Each fund's closing price is set to 100 on Jan. 2, 2014, so the lines show how much each price changed, not what a share costs. A value of 270 means the price is 2.7 times what it was on that day.
These are share prices only. No dividends are added back for either fund, and no trading costs or taxes are taken off. Each fund's own running costs are already reflected in its price. Because EWY is priced in dollars, its line moves with Korean share prices and also with the won against the dollar. It is not the KOSPI, Korea's main index, which is counted in won.
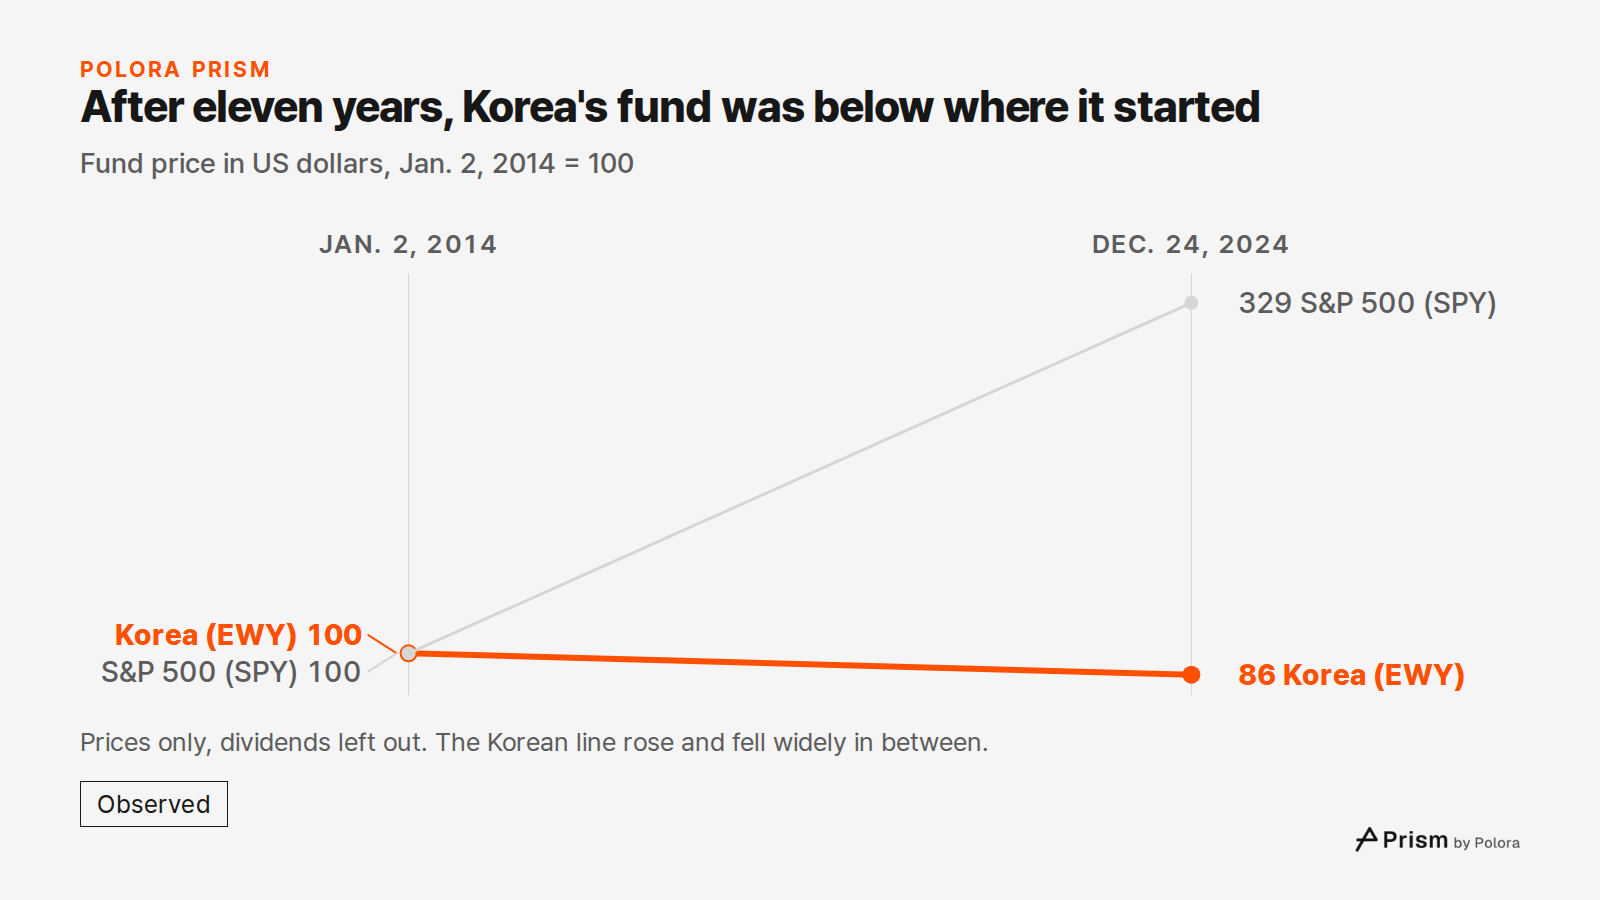
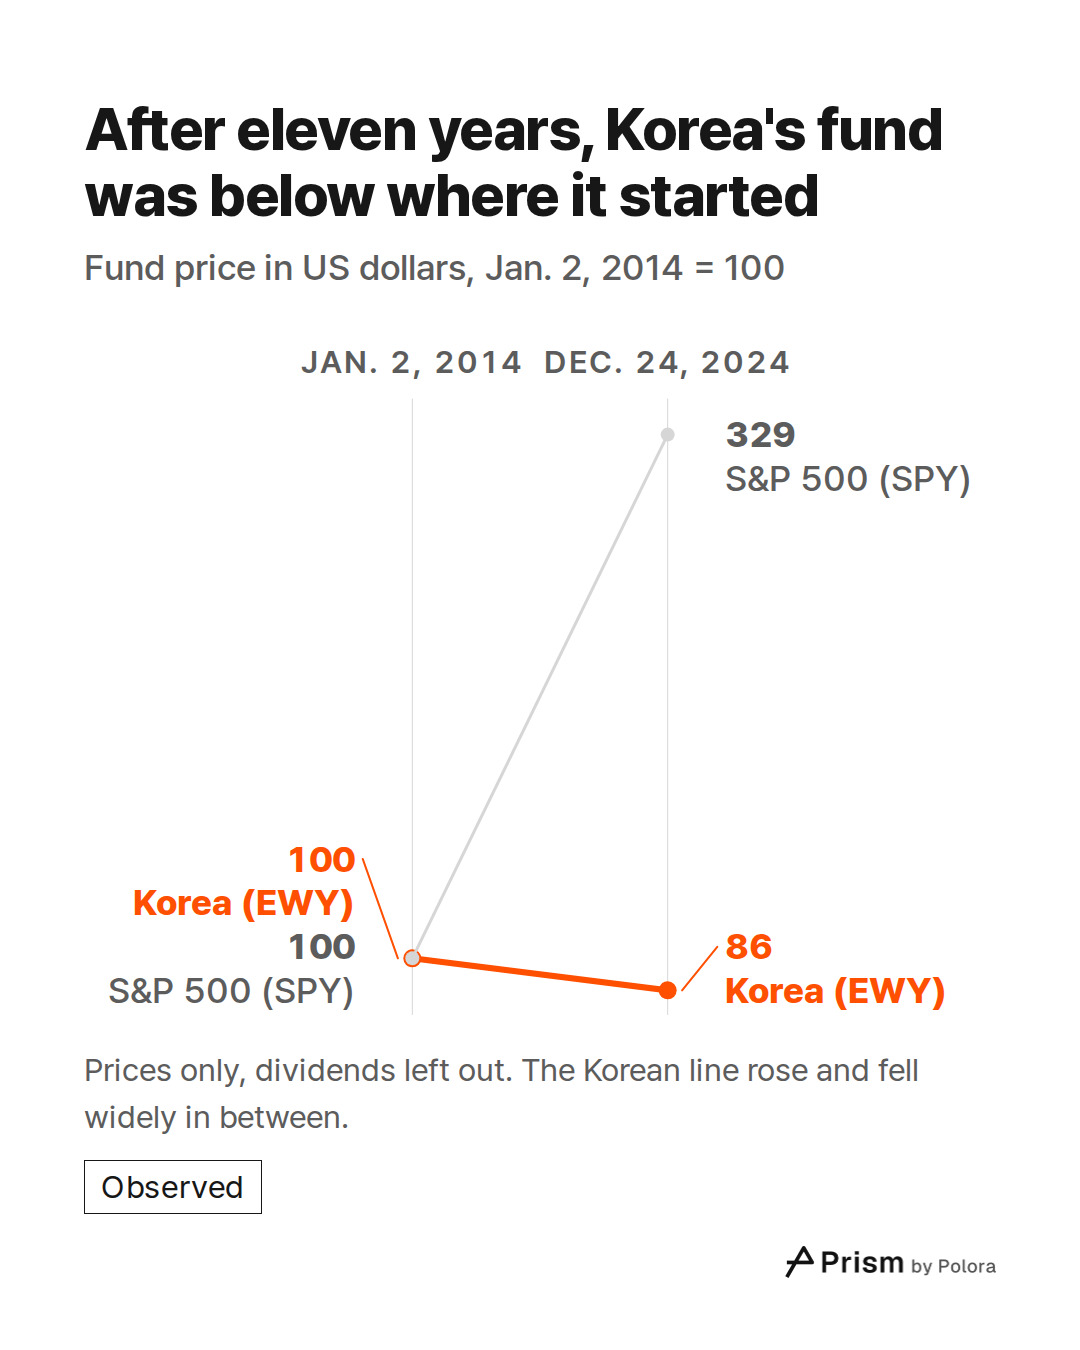
Eleven years, ending below the start
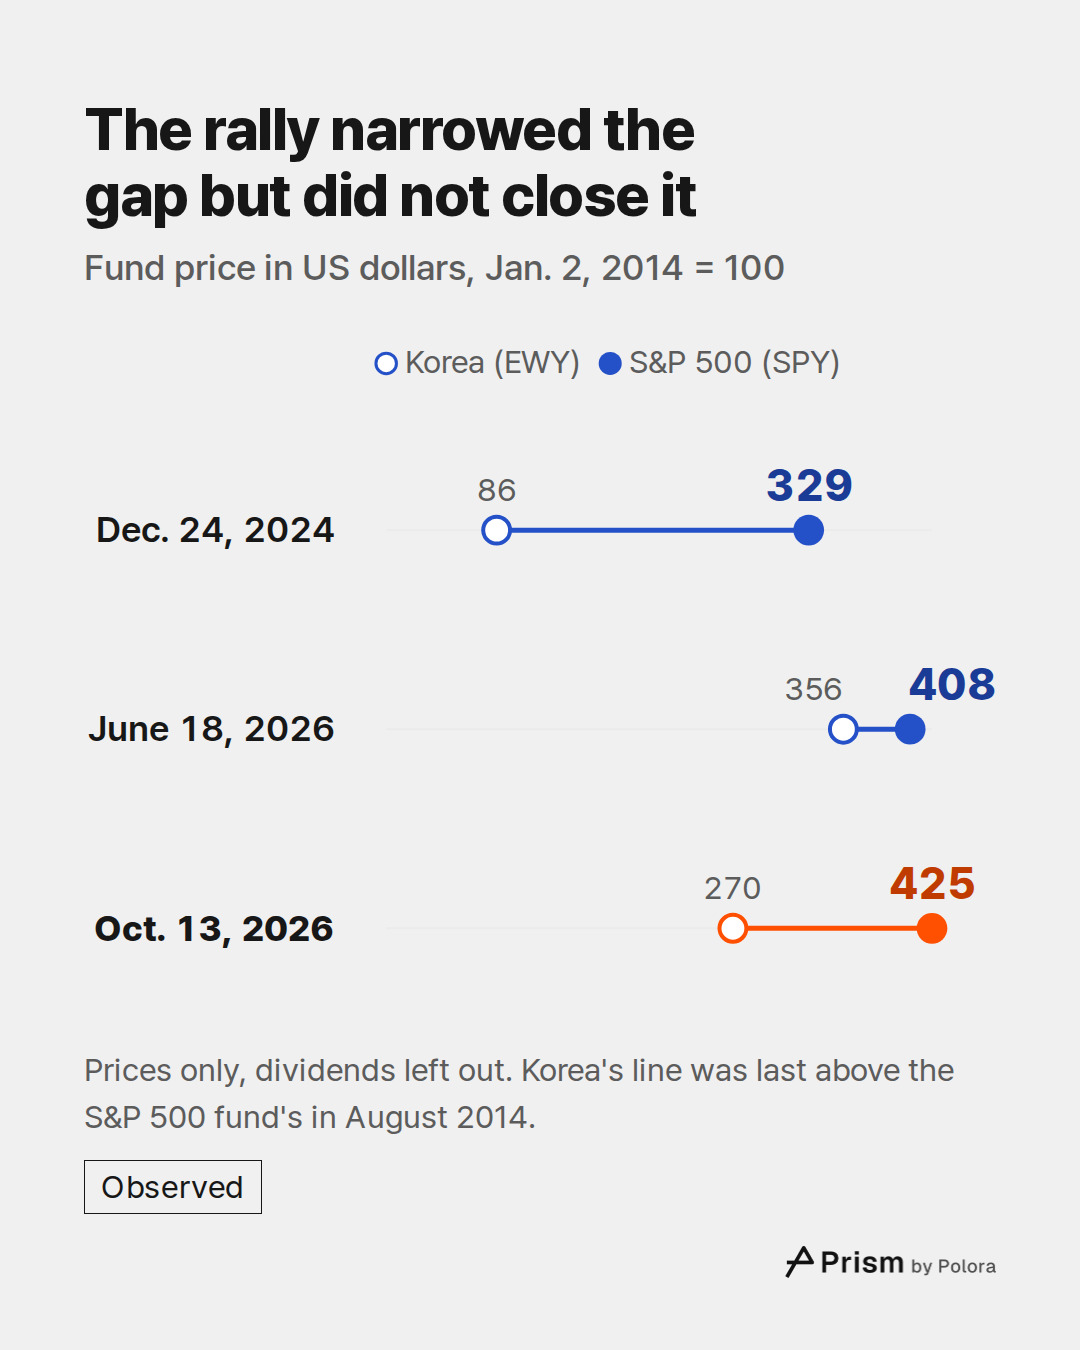
Korea's line was not flat during those years, and it spent long stretches above 100. It fell to 68 in March 2020, climbed to 155 in January 2021, then lost all of that and more. By Dec. 24, 2024, the last day of that year with a close on file for both funds, EWY stood at 86, or $52.71 a share. The S&P 500 fund stood at 329.
The Korea Economic Institute of America (KEIA), a Washington research institute, describes a long-standing "Korea discount" : Korean companies have traded at lower valuations than their global peers, many below the value of their net assets. It points to ownership structures at large family-controlled business groups that have favoured the founding families over minority shareholders, low dividend payouts, and a concentration in cyclical, capital-heavy industries. That describes how the market priced Korean companies. It is not a measure of the line in the film.
A year and a half that changed the picture
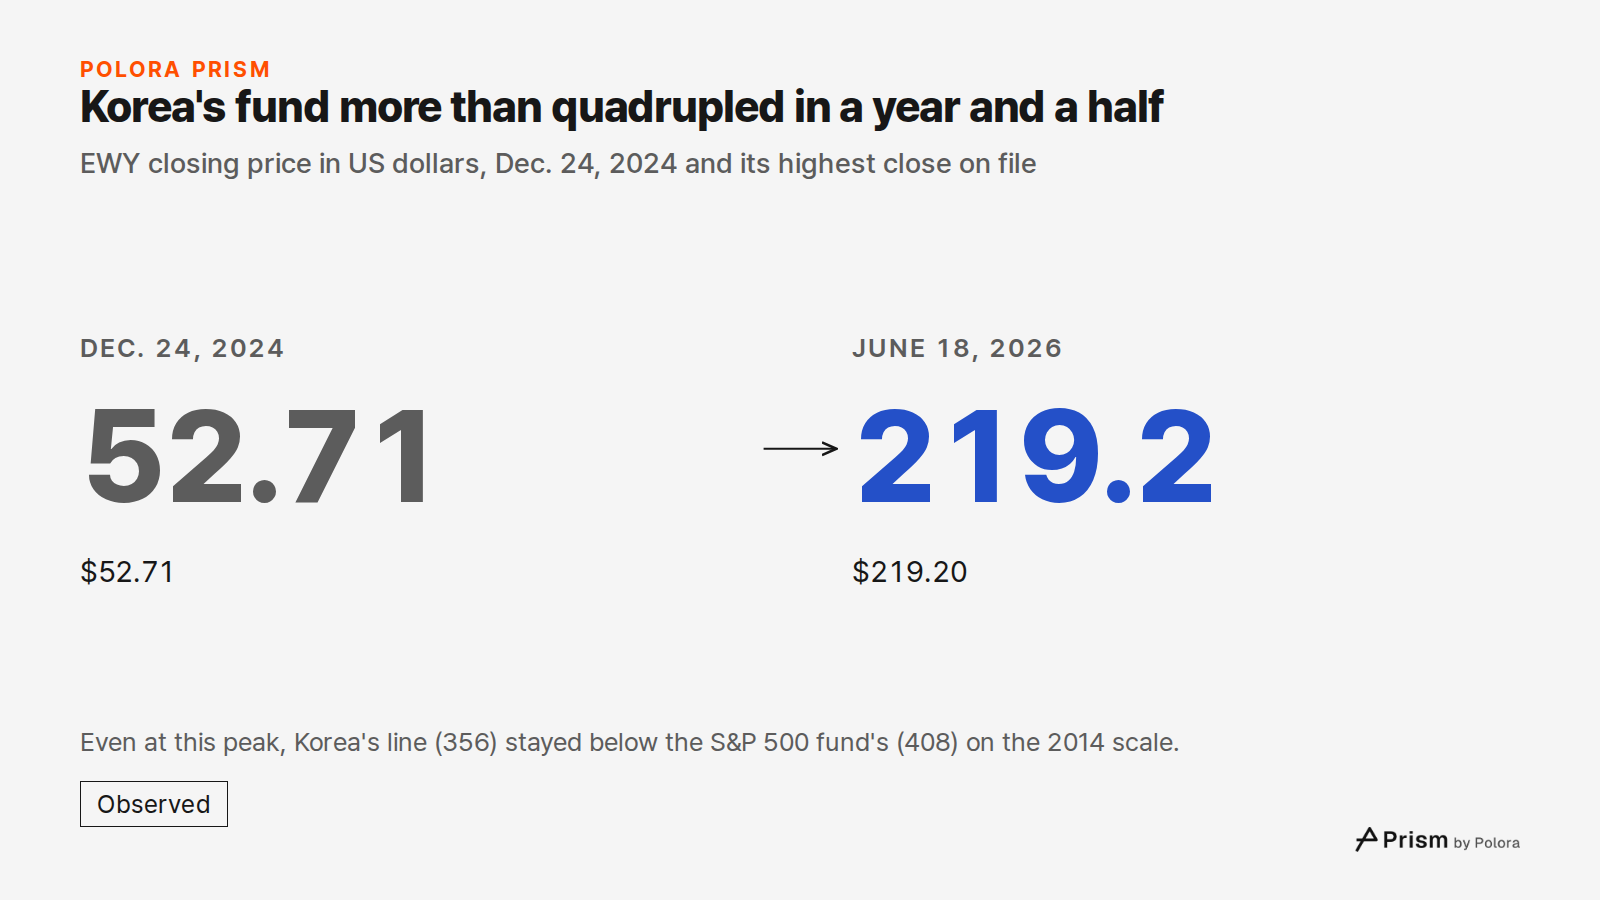
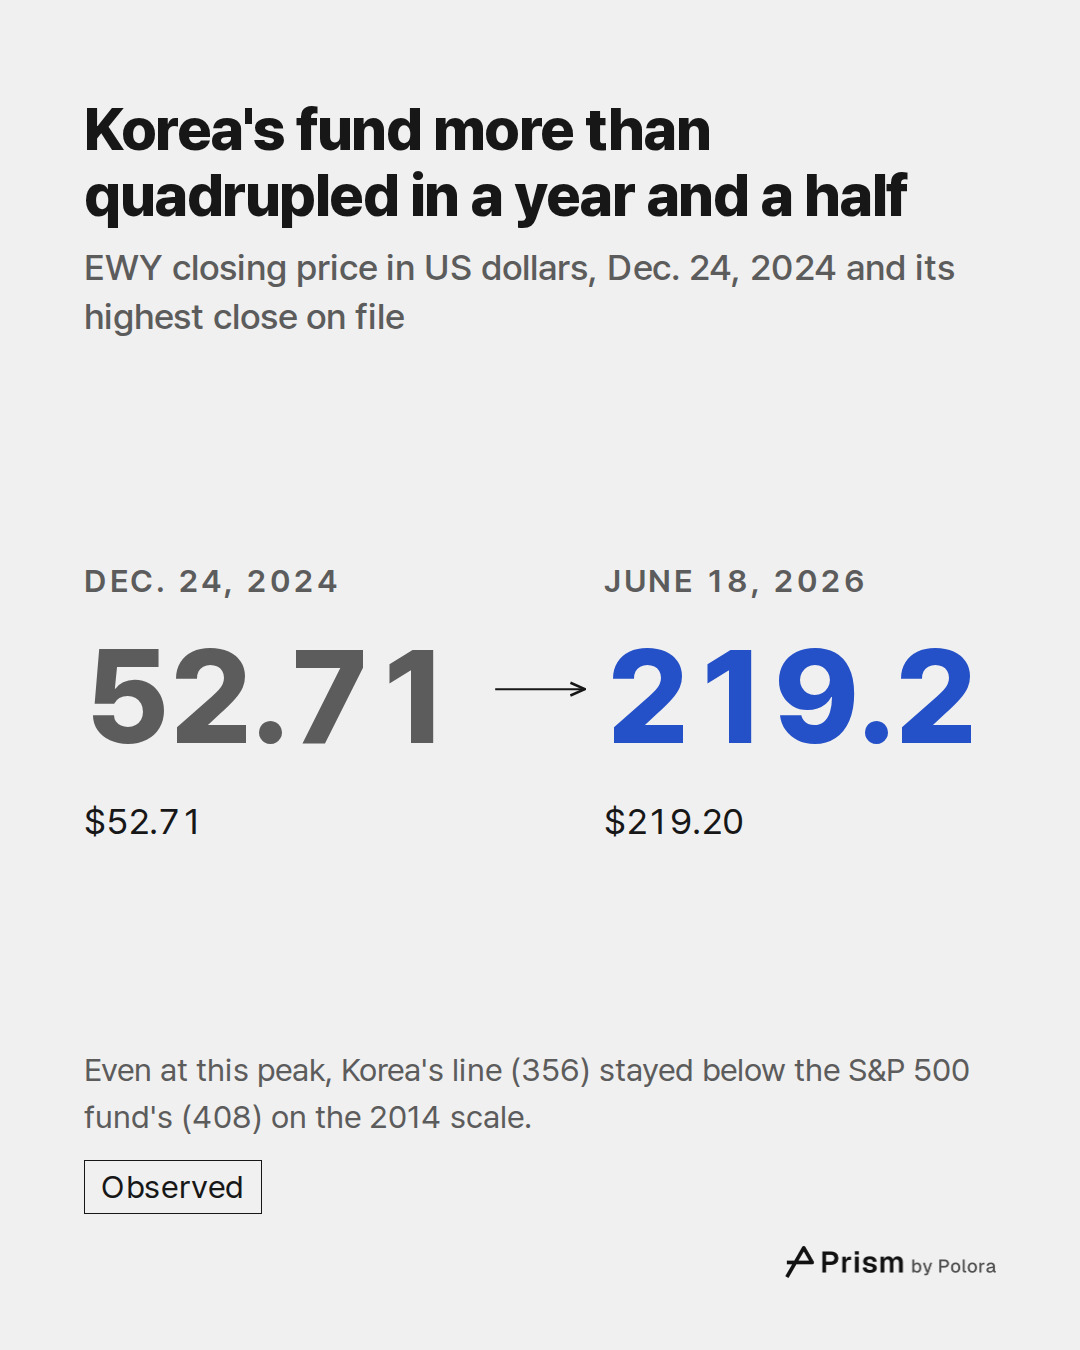
From $52.71 on Dec. 24, 2024, EWY rose to $219.20 on June 18, 2026, its highest close on file. That is more than four times the price. Even at that peak, the Korean line (356) stayed below the S&P 500 fund's (408).
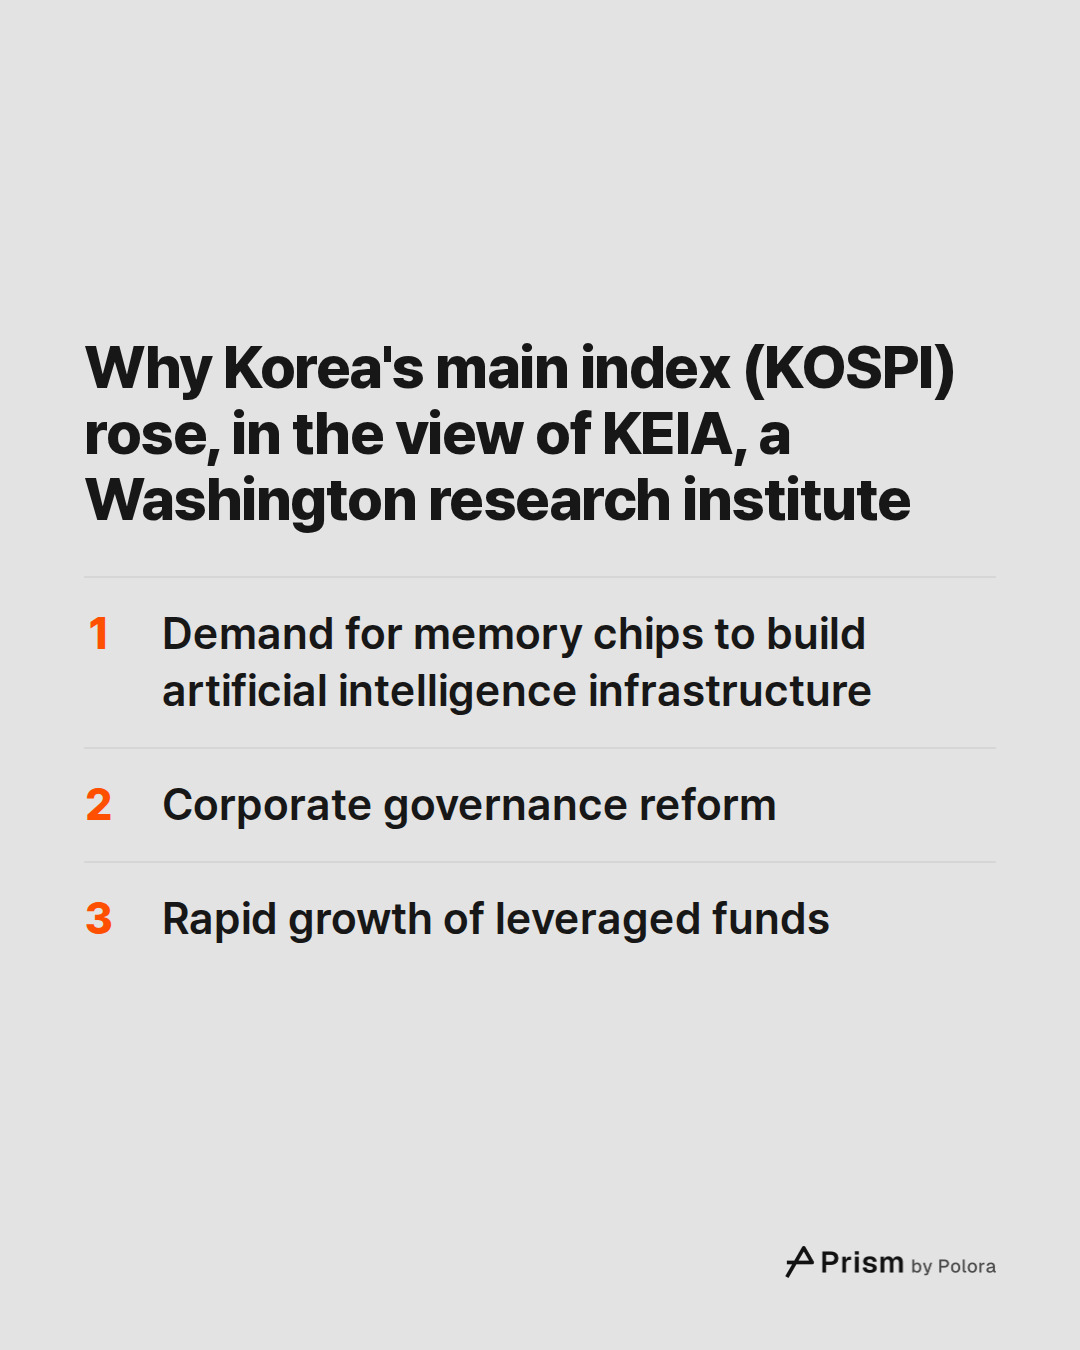
KEIA's explanation, published in July 2026, names three forces. The main one is demand for memory chips to build artificial intelligence infrastructure. Samsung Electronics and SK Hynix, the two leading chipmakers, came to account for more than half of the KOSPI's market value, by KEIA's count. The second is corporate governance reform. On July 3, 2025, the National Assembly passed a revision of the Commercial Act under which company directors owe their duty to shareholders as well as to the company, a provision set to apply once the law was promulgated, as The Korea Times reported that day. The third is the rapid growth of leveraged funds, which multiply the daily moves of an index. These are KEIA's reasons for the rise of the KOSPI, not a calculation in the film.
Then a sharp fall and a record rebound
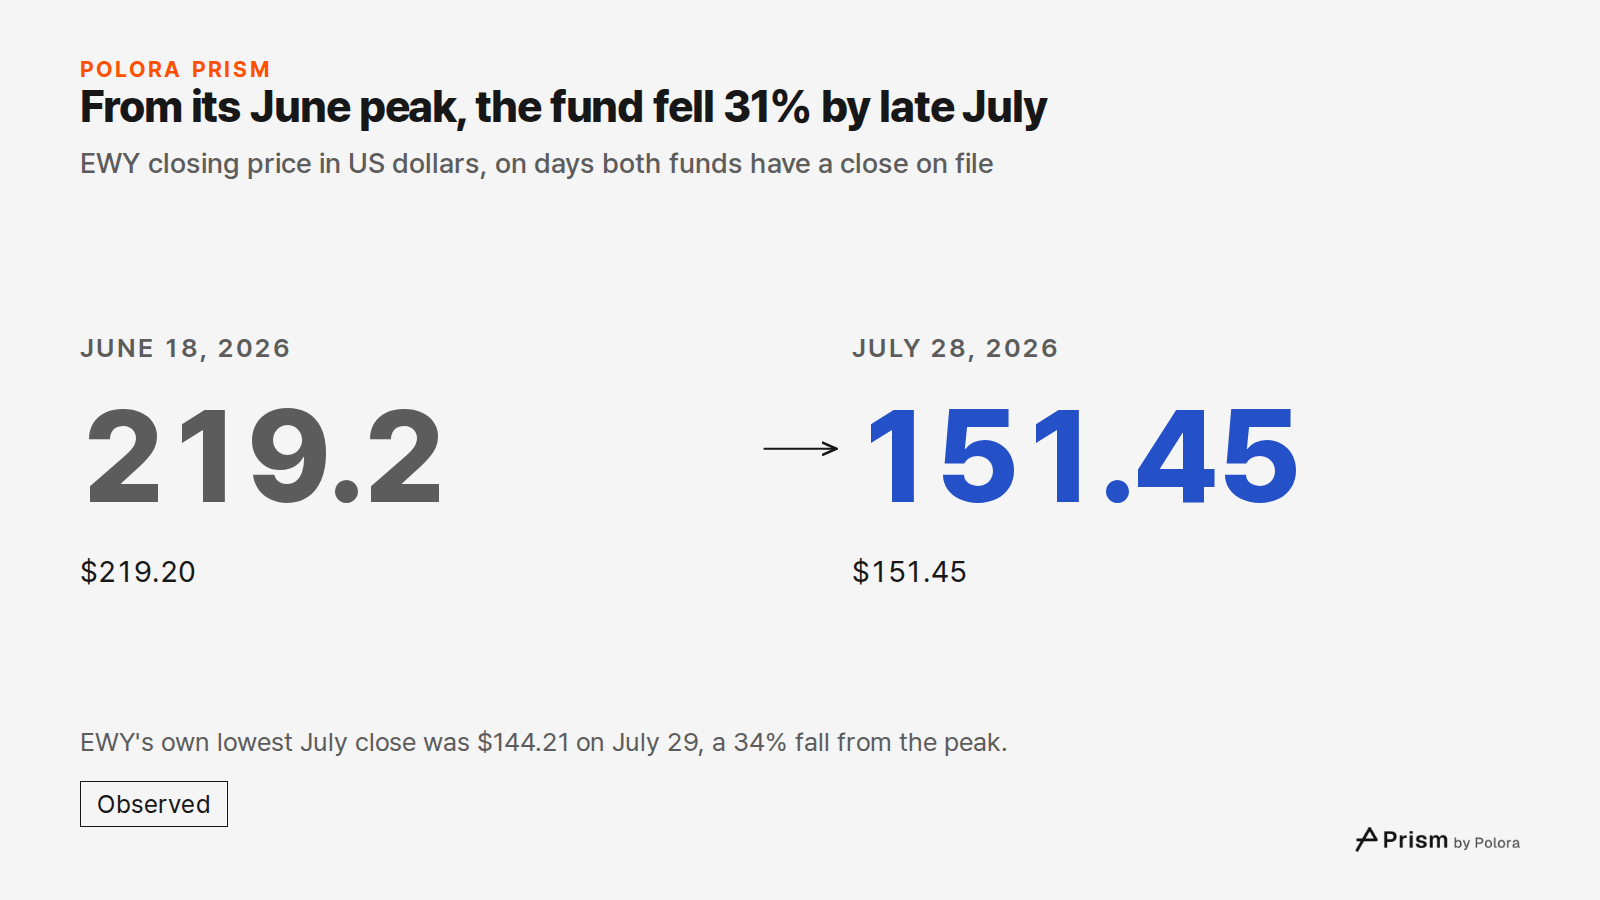
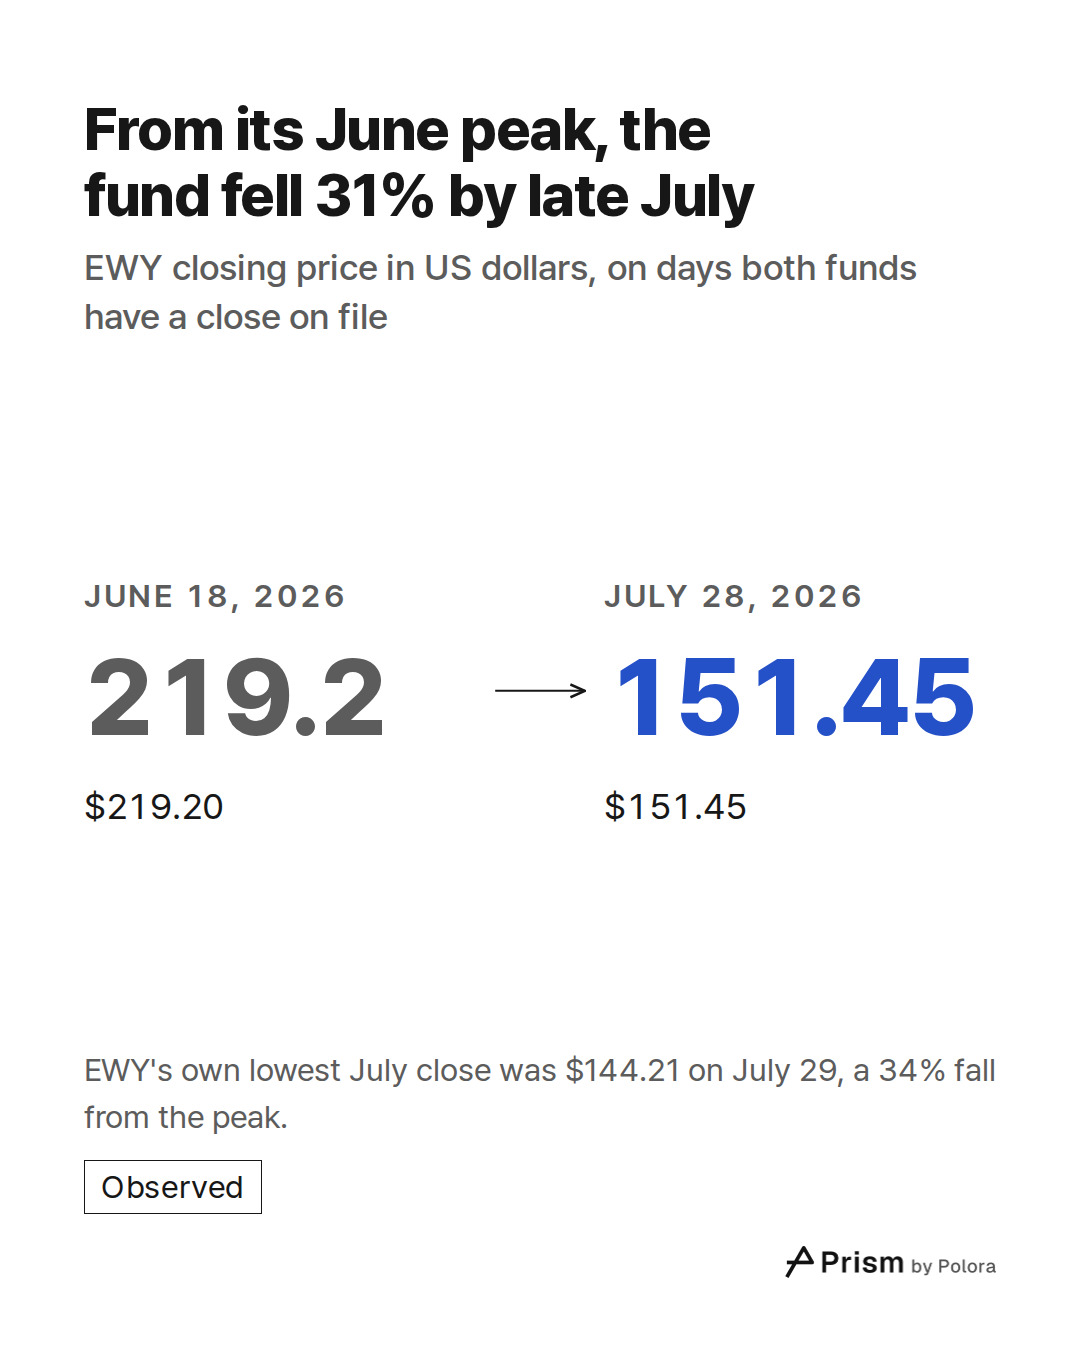
The price then swung hard. The film, which uses only days on which both funds have a close on file, shows EWY falling 31% from the June peak to $151.45 on July 28. EWY's own lowest close in July was $144.21 on July 29, a day with no close on file for the S&P 500 fund, so the film leaves it out. Measured from that close, the fall from the peak was 34%, about a third of the price.
On the last trading day of July, CNBC reported that the KOSPI staged its sharpest reversal on record. It linked the rebound to a rally in US technology stocks after upbeat earnings from Microsoft, Amazon and Meta. A fund manager it quoted said short-covering and rebalancing by leveraged funds amplified the gains. KEIA had already warned about this kind of turbulence. It wrote that Korea's volatility index went past its 2008 financial-crisis peak and that the exchange repeatedly triggered market-wide trading halts in 2026. In its view, volatility and the market's reliance on two companies in one industry were bigger worries than the level of the index.
Where the lines stood in mid-October
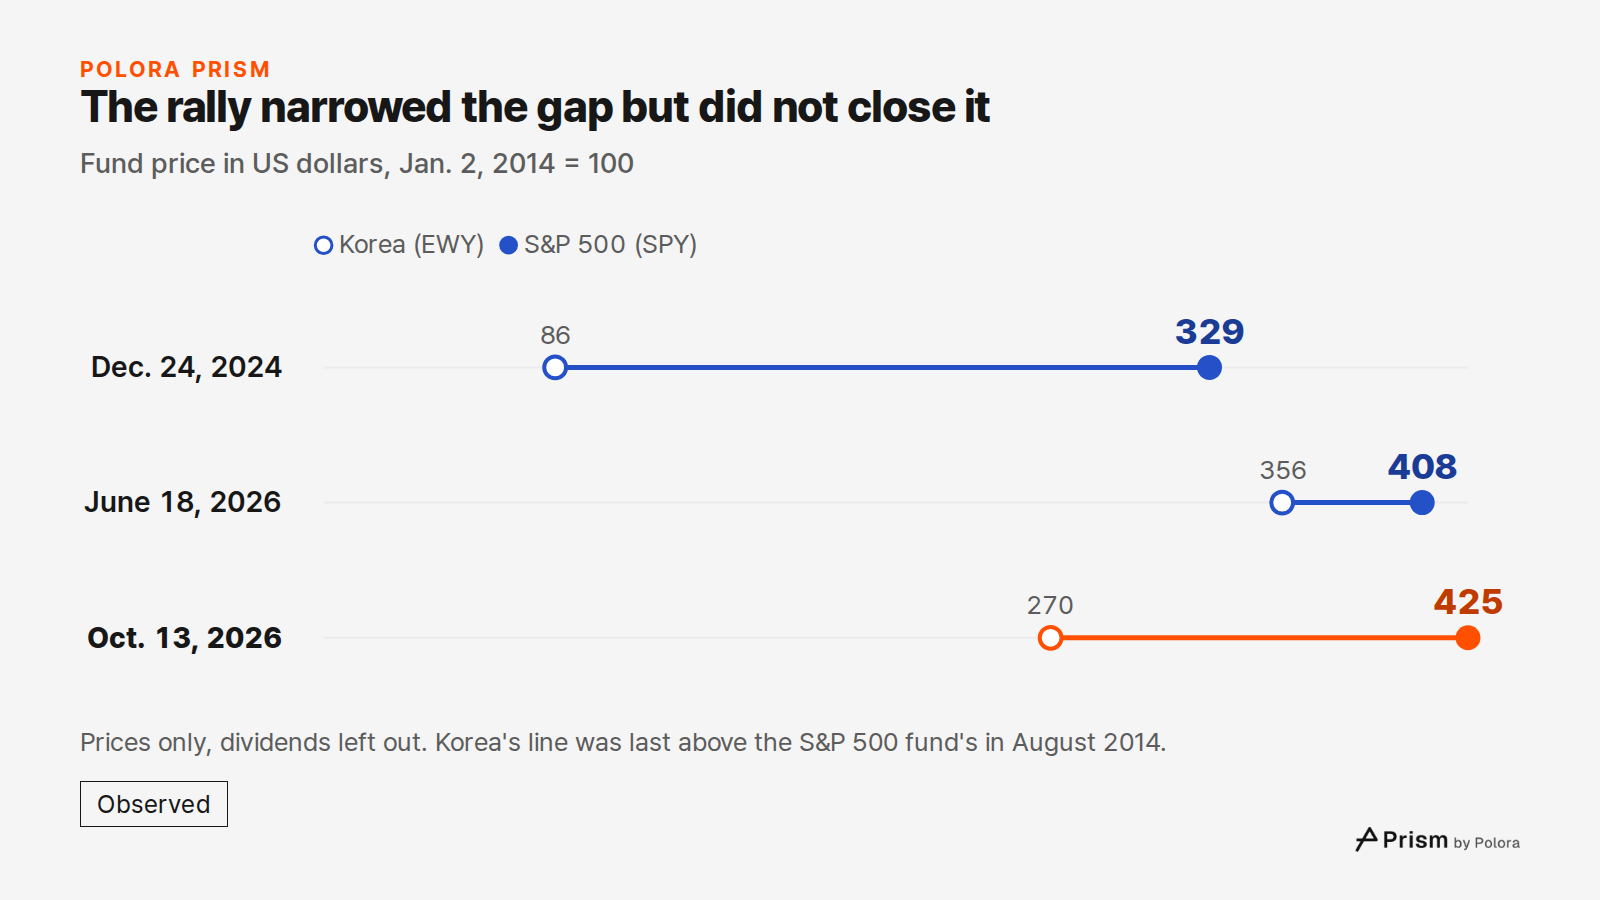
On Oct. 13, 2026, the latest close on file, EWY was at $166.56, about a quarter below its June peak. On the 2014 scale, Korea stood at 270 and the S&P 500 fund at 425. The rally narrowed the gap but did not close it. On the days on file, the Korean line was last above the S&P 500 fund's in August 2014.
How the numbers were made, and what they leave out
The closing prices come from the US Securities and Exchange Commission's fails-to-deliver data. These files list shares that were not delivered on time, along with the previous day's closing price. A fund appears only on days when it had such a fail, so some days are missing. The film uses only the 1,821 trading days on which both funds have a close on file, and fills none in. The SEC says it cannot guarantee that its prices match closing prices from other sources. Every close was checked against the exchange closing prices in a separate daily price history. On some days they differ by a fraction of a percent, most of all before 2017. That is enough to move a handful of plotted values, all from 2014 to 2016, by one point. None of the figures quoted here changes.
The SEC publishes these files in half-month batches, with the second half of a month posted around the middle of the next. The latest file available when this was written covers the first half of October, and Oct. 13, 2026 is the last day in it with a close for both funds. Korean stocks have kept moving since, and this piece does not cover that period.
Both funds pay dividends. With them, both lines would sit higher, and this piece does not work out by how much. The window starts in January 2014. A different start would give different multiples. This is a record of the past, it assumes nothing about what either fund will do, and it promises nothing about what comes next.
- SEC, Fails-to-Deliver Data
- Korea Economic Institute of America, "Explaining South Korea's Stock Market Boom" (Randall S. Jones, July 22, 2026)]
- The Korea Times, "New regulation to enforce stricter governance for companies, commitment to shareholders" (July 3, 2025)]
- CNBC, "South Korea's Kospi, Samsung, SK Hynix: meltdown to record rebound" (July 31, 2026)]
- StockAnalysis, iShares MSCI South Korea ETF (EWY) profile
- State Street, SPDR S&P 500 ETF Trust (SPY)
![Sources 6 : sec.gov · SEC, Fails-to-Deliver Data], keia.org · Korea Economic Institute of America, "Explaining South Korea's Stock Market Boom" (Randall S. Jones, July 22, 2026)], koreatimes.co.kr · The Korea Times, "New regulation to enforce stricter governance for companies, commitment to sharehol](https://media.cdn.polora.ai/picks/2026/11/pickrun_e9845f2b34534201/kdvFrUH6p7LjvV7o-slide-08--have-korean-stocks-caught.jpg)