How the picture works
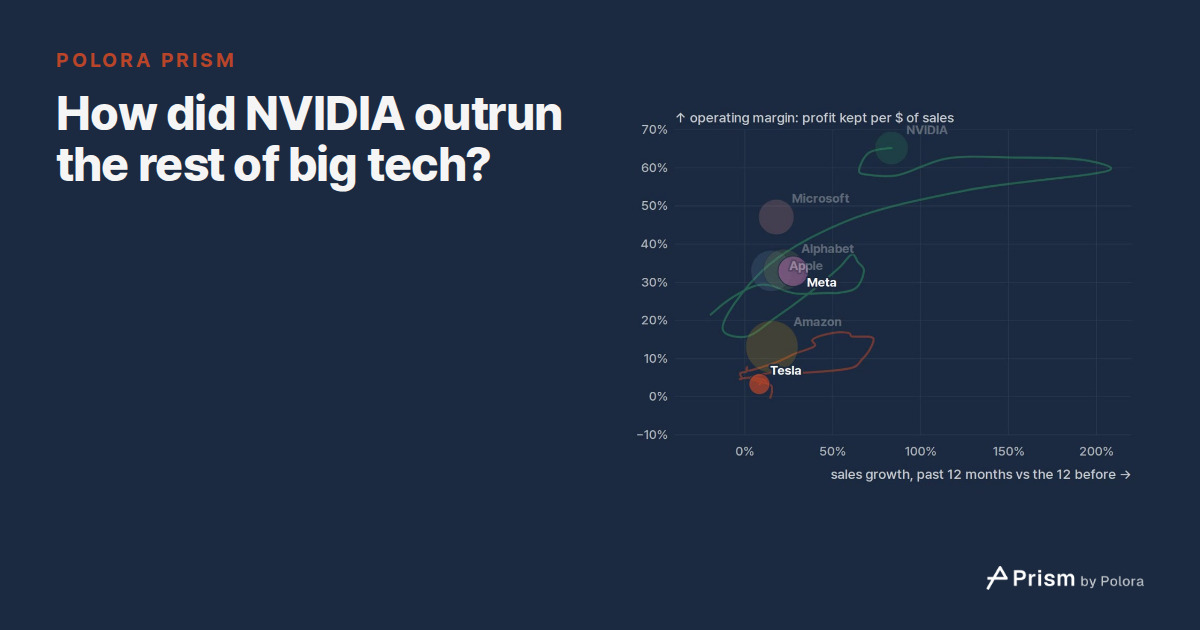
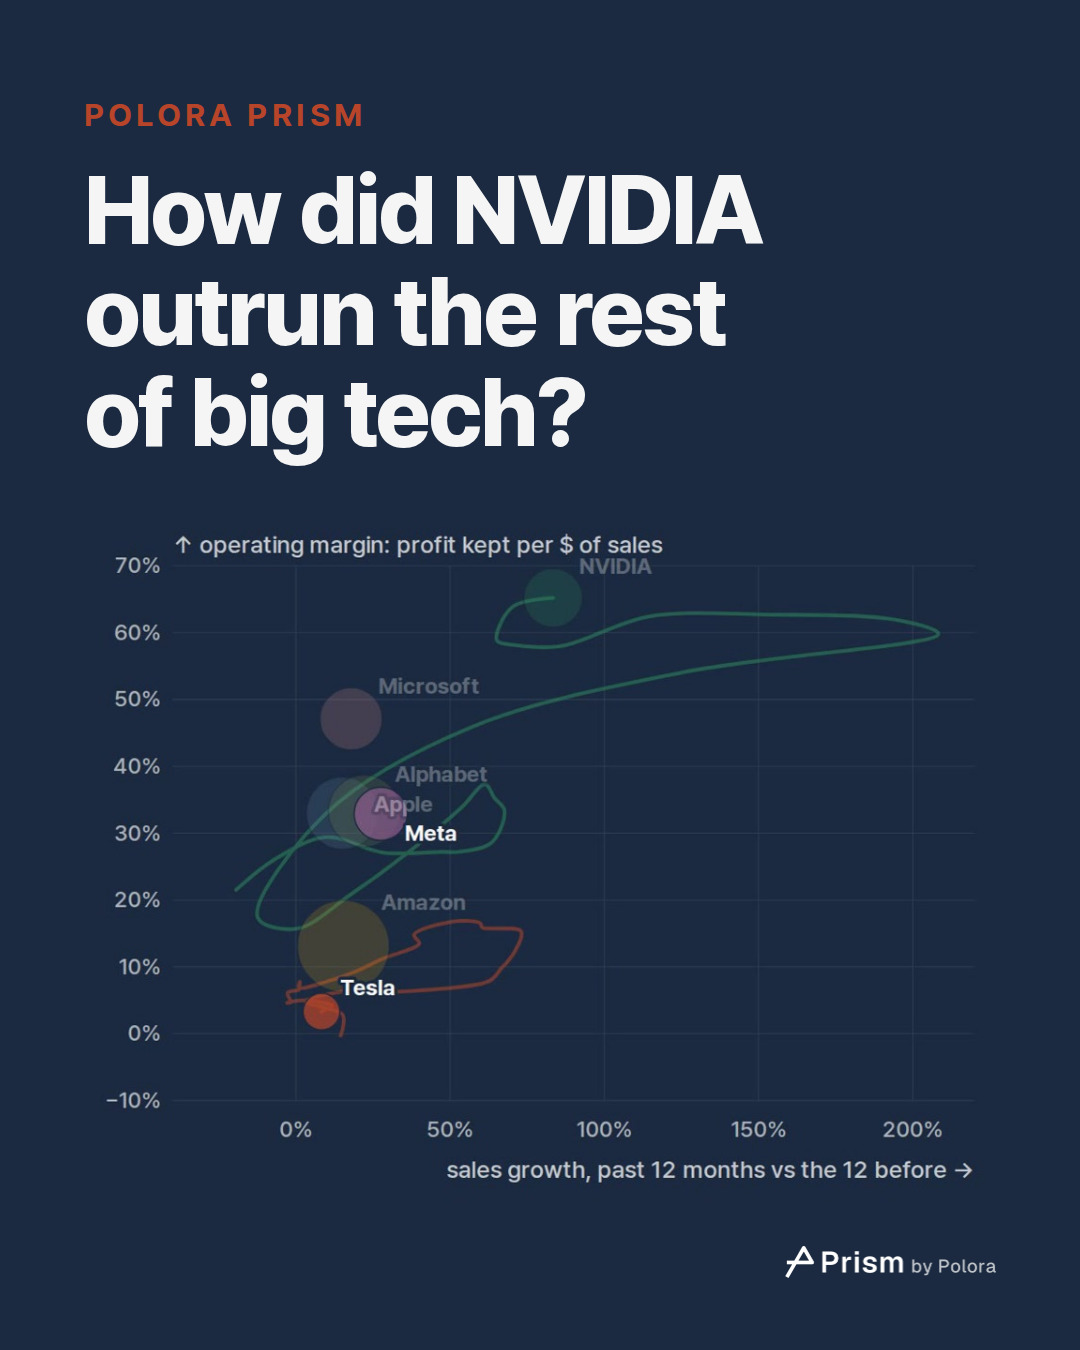
The film places seven companies (Apple, Microsoft, Alphabet, Amazon, Meta, NVIDIA and Tesla) on two measures, both taken over the past twelve months. Across the picture runs sales growth : the revenue of a company's latest four fiscal quarters compared with the four before them. Up the picture runs operating margin : operating income divided by revenue over the same four quarters. Operating income is what is left of sales after the costs of running the business, before interest and tax. Read as a percentage, the margin is the cents of operating profit kept from each dollar of sales. Each bubble is sized by the twelve months' sales.
Every figure comes from the companies' own quarterly and annual filings with the US Securities and Exchange Commission, and each was checked against a separate publication, mostly the companies' earnings releases. The picture moves one quarter at a time, from the twelve months to December 2019 to the twelve months to September 2026. Twelve-month totals smooth out the seasons. They also mean a single strong or weak quarter stays in a company's totals for a year.
A crowded middle
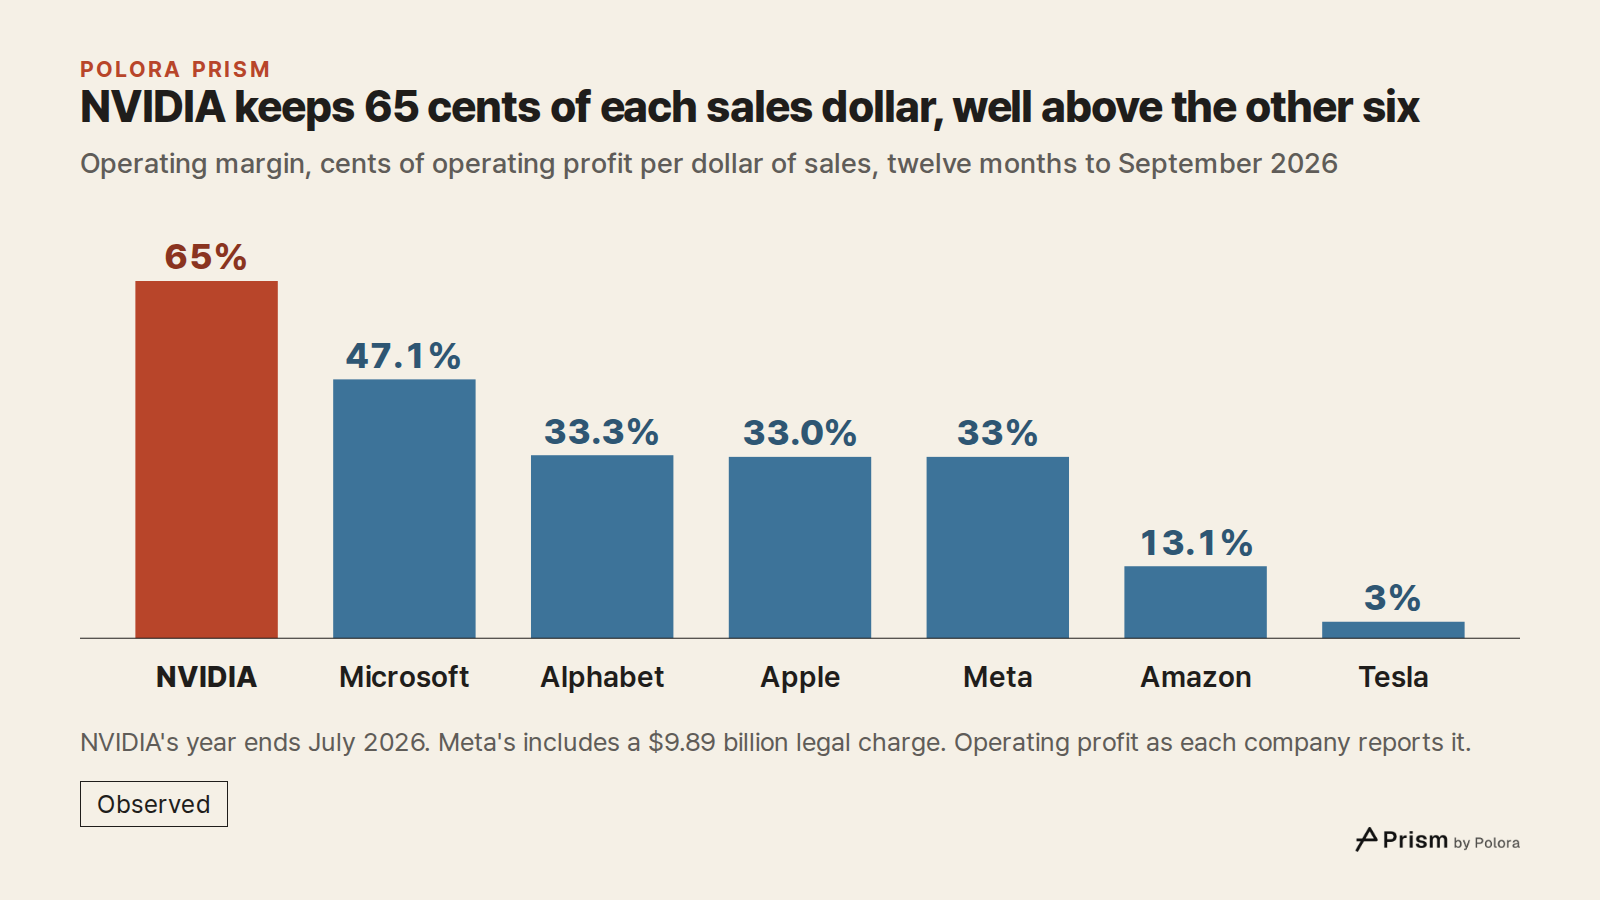
Since NVIDIA's breakaway, the other six have stayed in a much tighter group. In the twelve months to September 2026, Microsoft's operating margin was 47.1% while its sales grew 17.9%. Alphabet ran at 33.3% with growth of 22.2%, and Apple at 33.0% with growth of 15.1%. Amazon grew 15.4%, at a margin of only 13.1%.
Twice before that, the group moved broadly in the same direction. In 2021 most of them raced right, toward faster growth : Amazon's sales grew 41% in the year to March 2021, and its growth peaked before the others'. In 2022 they slid back : each of the seven ended that year growing more slowly than a year before. Meta's sales shrank 1% that year and its margin fell to 25%, a figure that includes the restructuring charges its earnings release reported for 2022. All the figures are in dollars of the day, not adjusted for inflation.
Why Amazon sits low
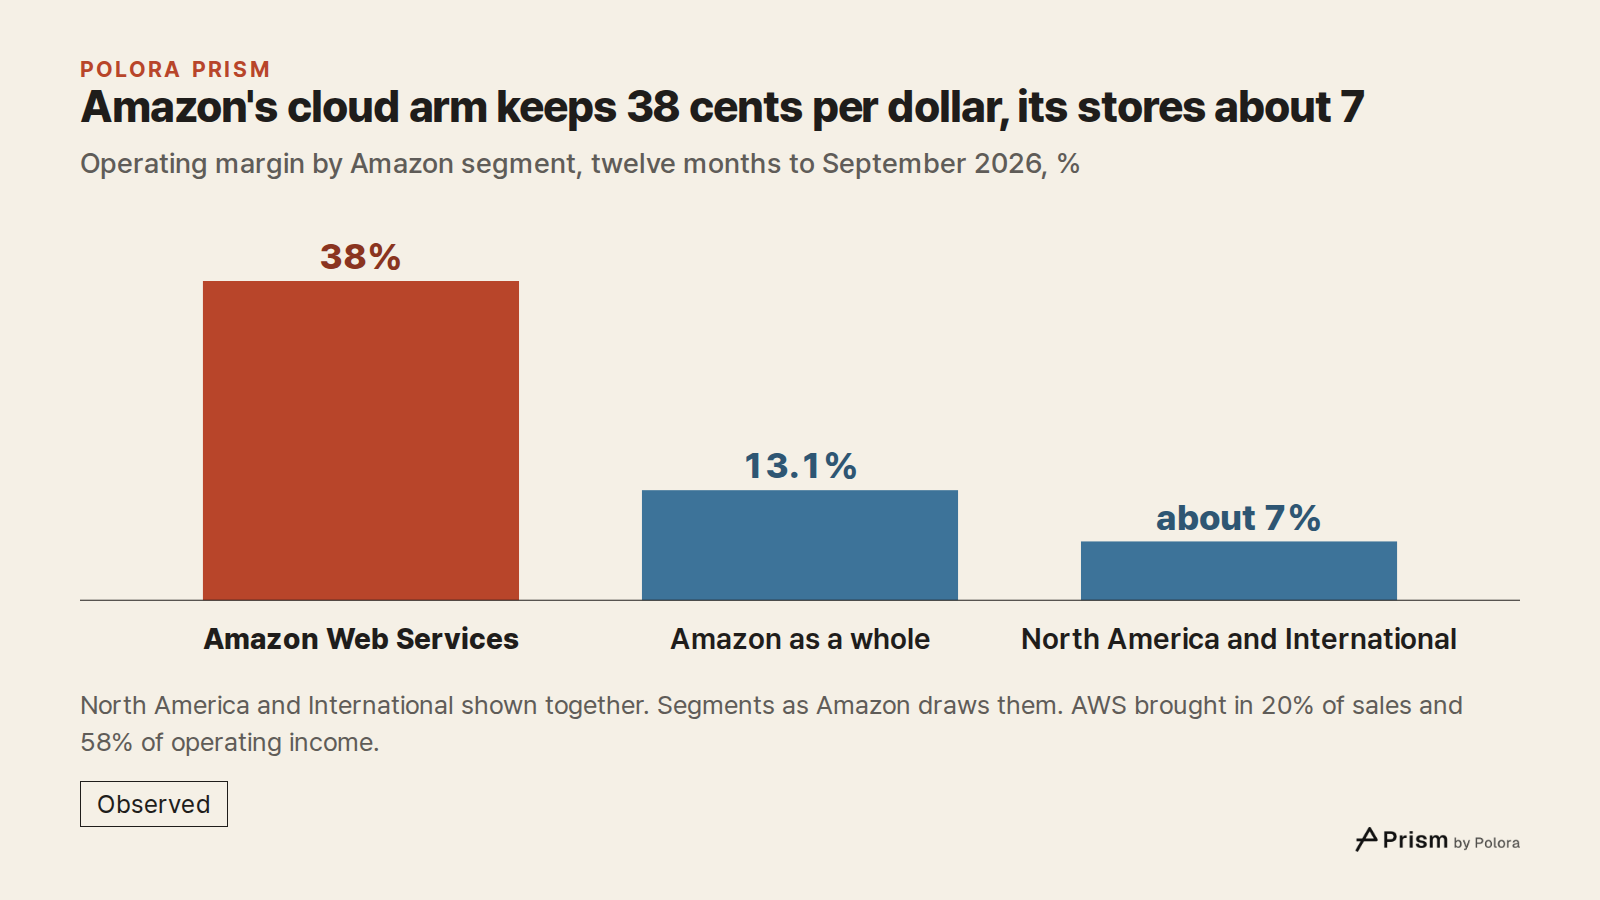
Amazon's 13.1% is an average of very different businesses. Amazon reports three segments, and in the twelve months to September 2026 its cloud arm, Amazon Web Services, brought in 20% of the company's sales but 58% of its operating income. AWS ran at a 38% operating margin. The other two segments, North America and International, which include Amazon's online stores, ran at about 7% together. Amazon draws these lines itself, and its three segments add up to its whole operating income.
NVIDIA's break
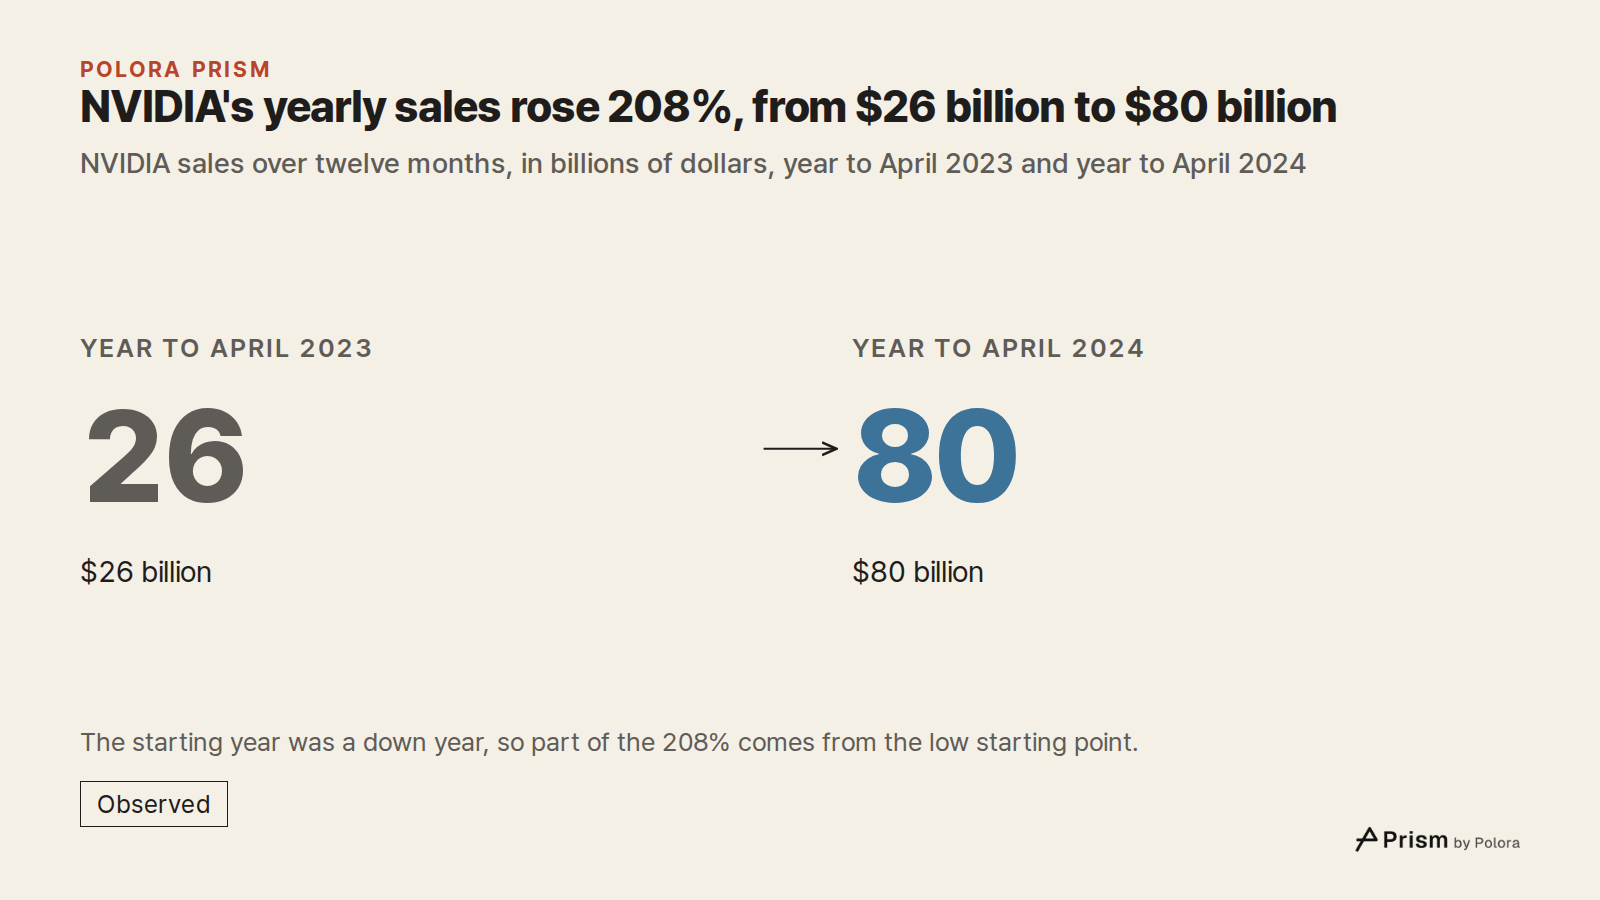
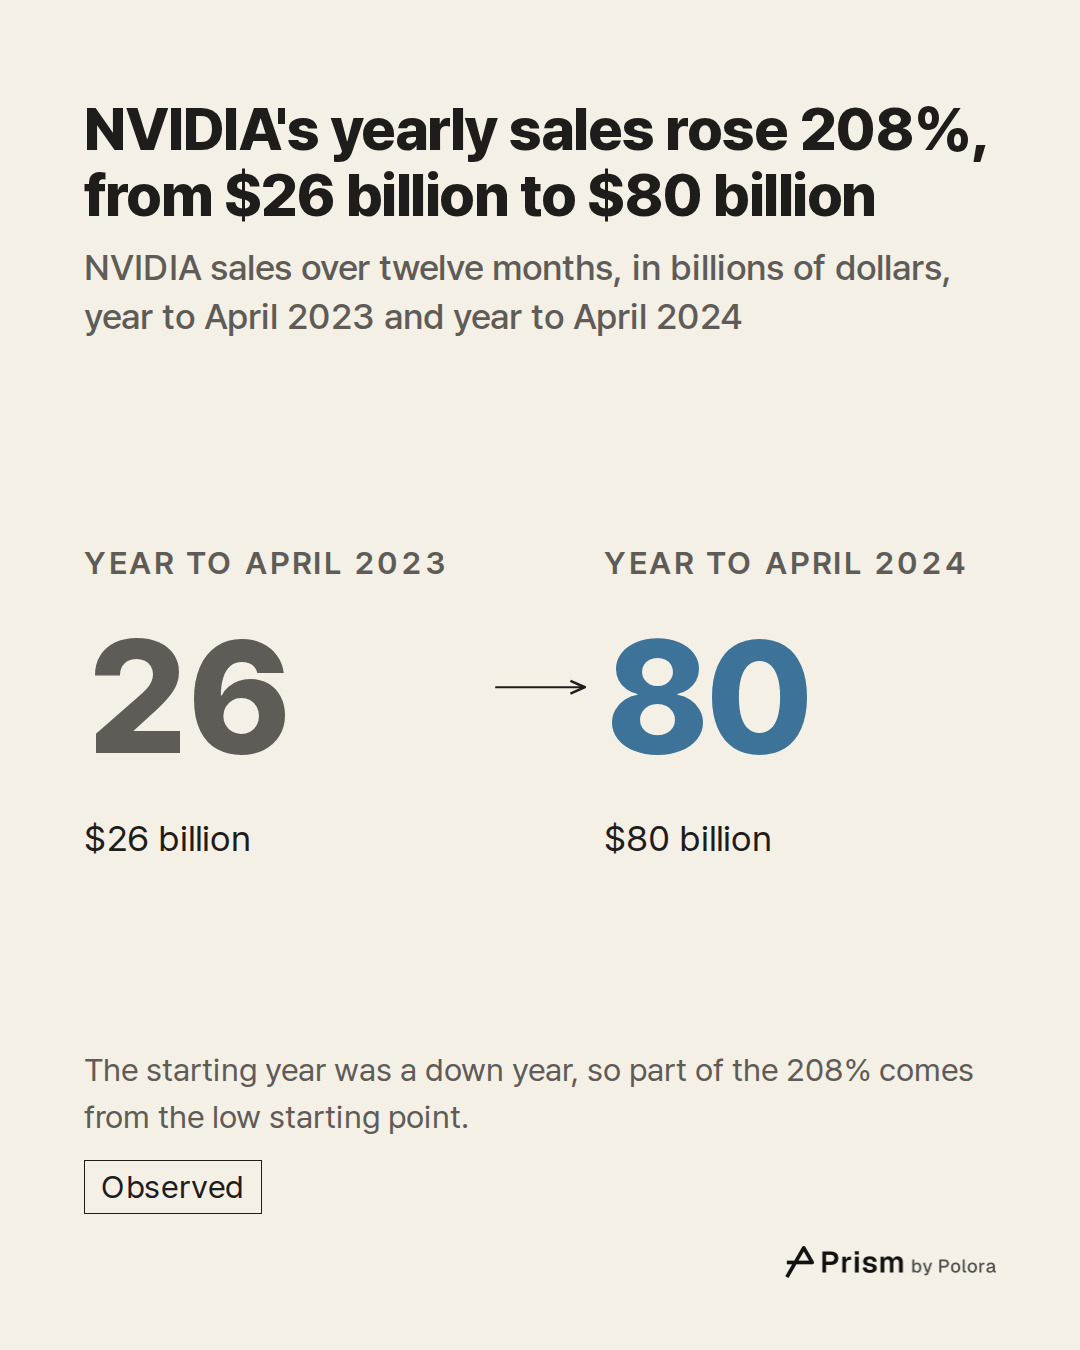
NVIDIA's breakaway started from a down year : its sales over the year to April 2023 were lower than the year before, at $26 billion. Over the next year they reached $80 billion, up 208%, at a 60% margin. Part of that percentage comes from the low starting point.
The money came mostly from one business. NVIDIA's annual report for the fiscal year to January 2024, which covers most of the same stretch, puts its Data Center revenue at $47.5 billion, up 217%, out of $60.9 billion in total. Data Center, which NVIDIA reports as one of its market platforms, sells the chips and systems that cloud companies and others use to build and run AI models.
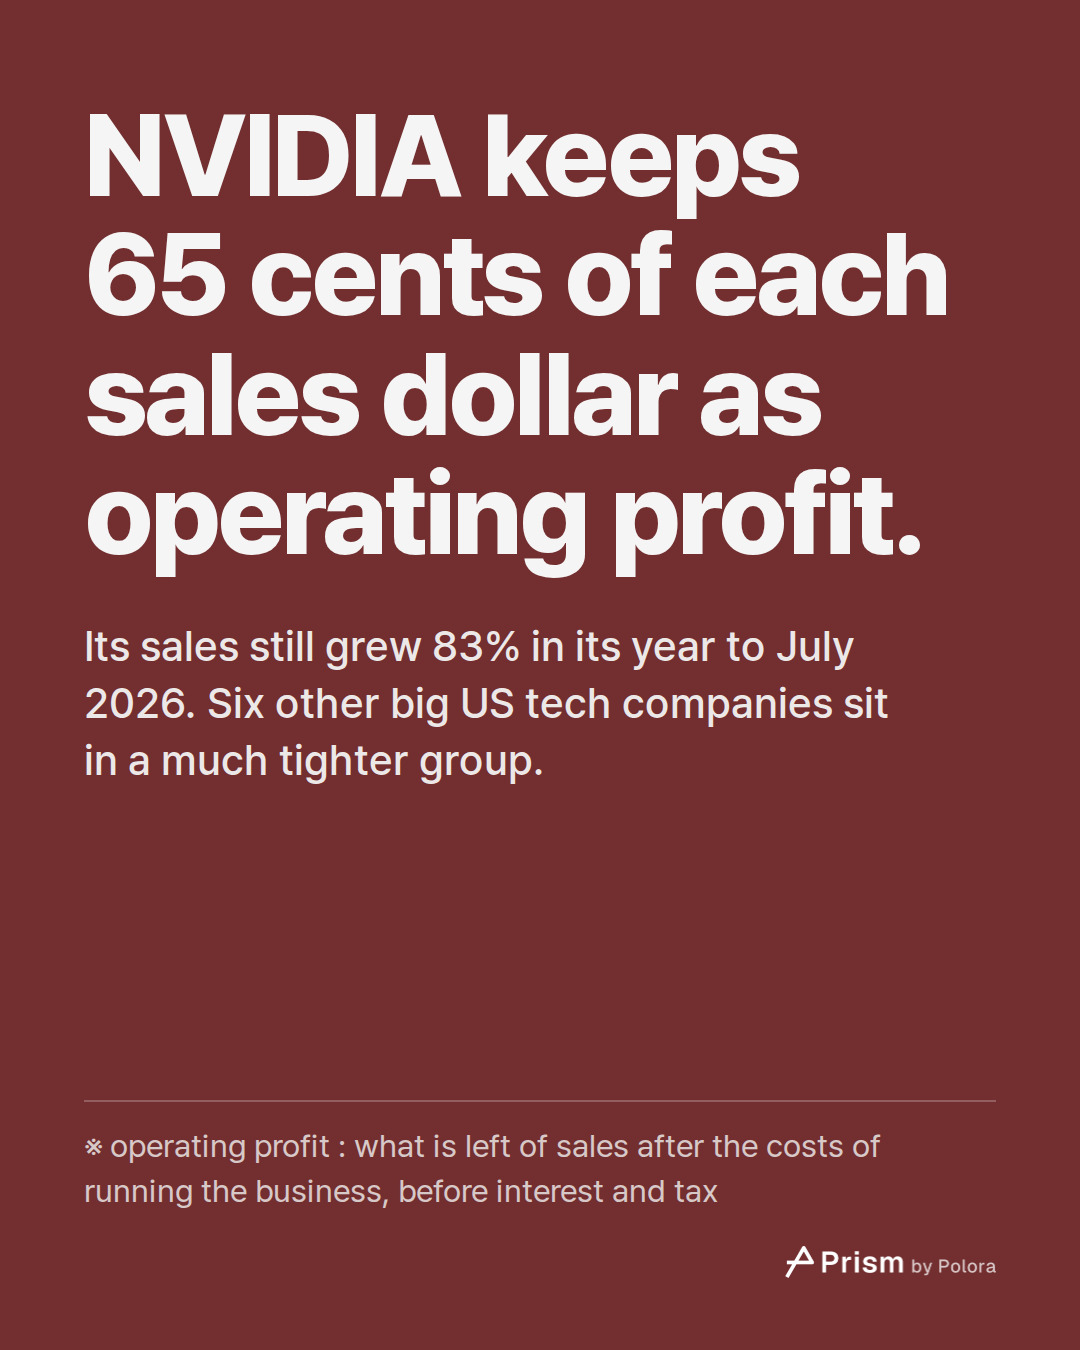
The latest point is NVIDIA's year to July 2026 : sales up 83%, at a 65% margin. NVIDIA's fiscal quarters end around the turn of January, April, July and October, so its latest point stops about two months earlier than the others'. Its quarter to October is not included.
Meta : costs outran sales
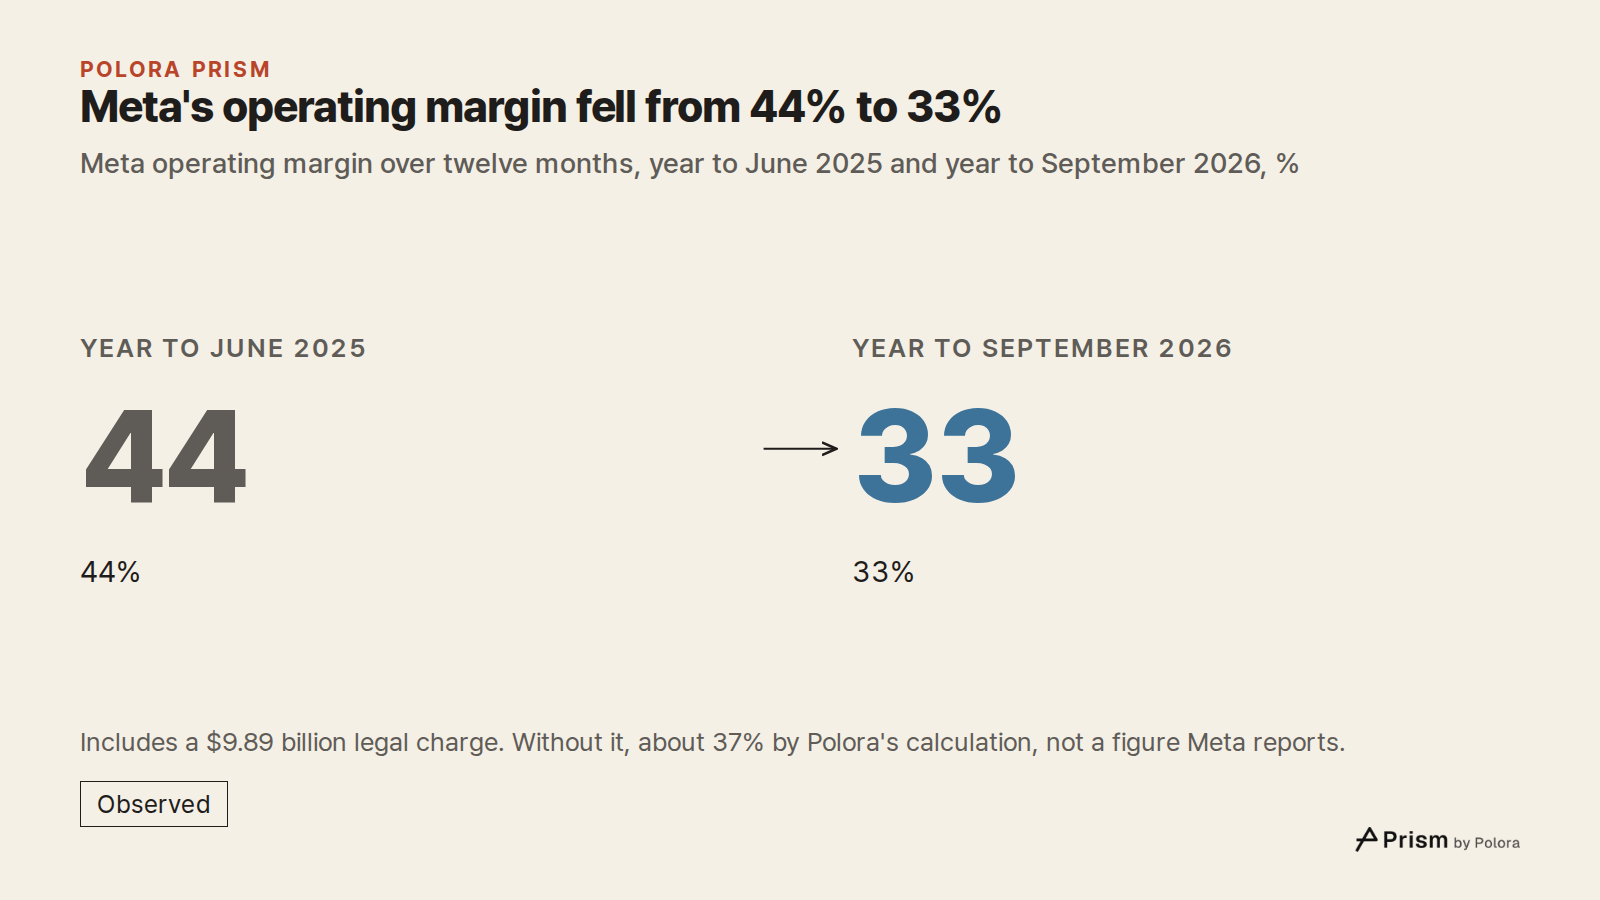
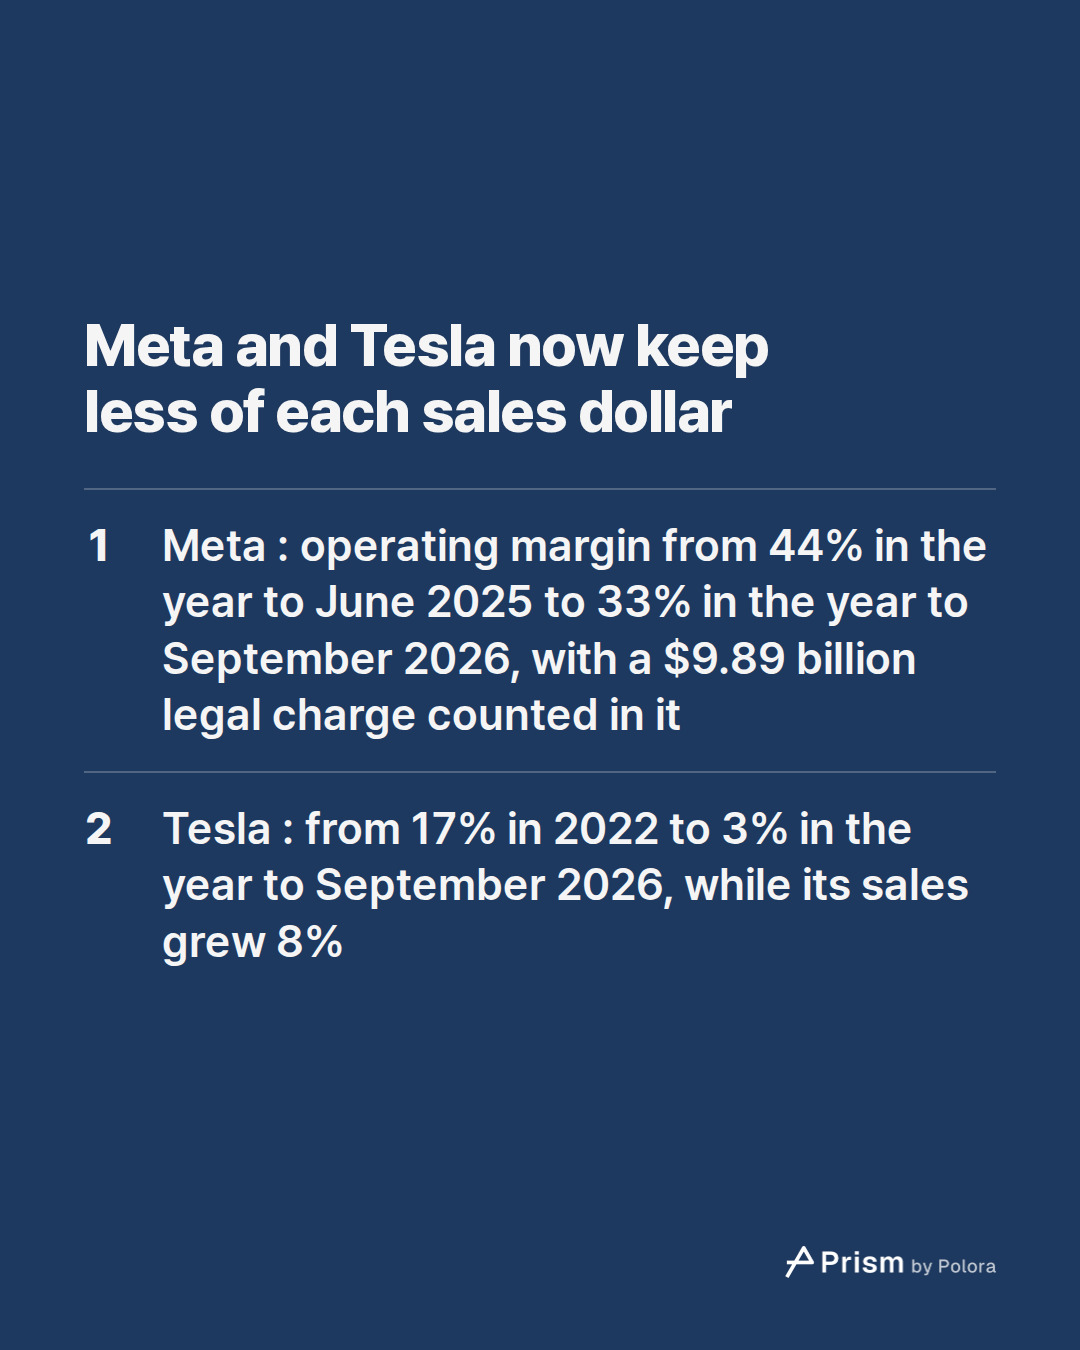
Meta's operating margin was 44% in the year to June 2025 and 33% in the year to September 2026. Over that time its costs grew faster than its sales.
Two kinds of cost stand out in its own reports. The first is legal charges. In its third quarter of 2026, Meta booked a $9.89 billion charge for an agreement with US state attorneys general to settle litigation over teen mental health and social media. Without that one charge, its margin over the twelve months would have been about 37% rather than 33%. That is our calculation, not a figure Meta reports.
The charge does not close the matter. Meta's quarterly report says the agreement provides for payments of up to about $18.59 billion, part of it contingent, in the report's words, on "industry peers such as YouTube and TikTok agreeing to similar terms", and its earnings release says more youth-related trials are scheduled.
The second is the cost of its data centres, cloud services and the AI models it runs, which Meta's quarterly report names, with the legal charge, among the reasons its costs rose in the latest quarter. Its second-quarter release adds that the year to June 2026 already carried legal charges and severance from job cuts made in May 2026.
Tesla went the other way
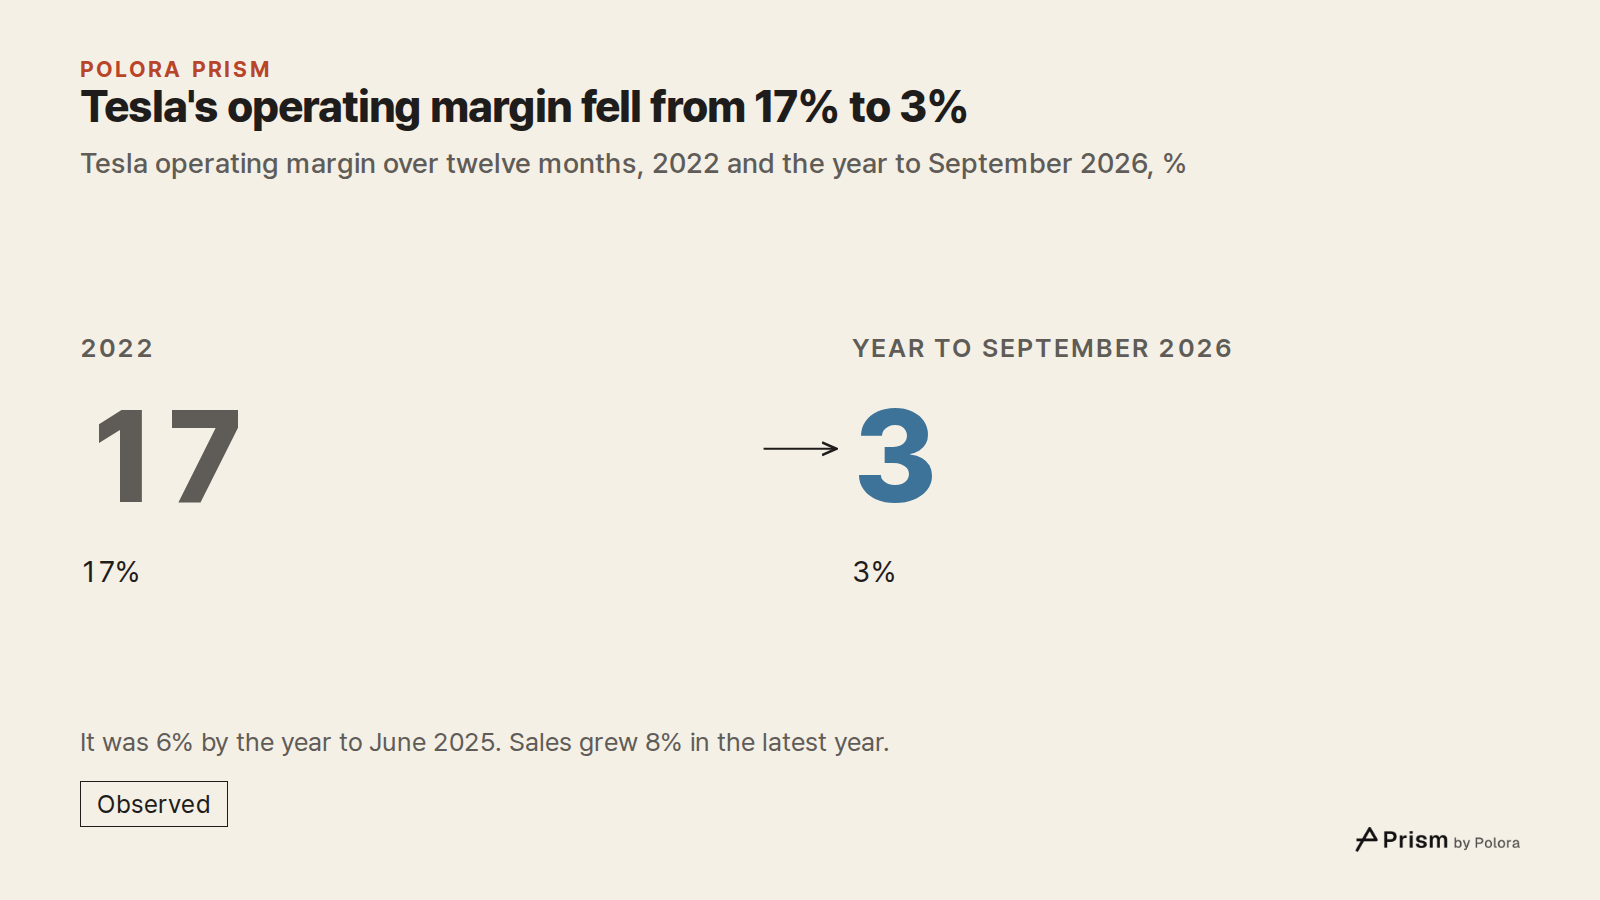
Tesla's operating margin was 17% in 2022, 6% by the year to June 2025 and 3% in the year to September 2026, even as its sales grew again, by 8%.
Part of Tesla's revenue comes from selling regulatory credits. As the Tesla news site Not a Tesla App explains them in broad terms, regulators in places such as California and the European Union require carmakers to sell a share of zero-emission vehicles, and a maker that falls short can pay a fine or buy credits from one with a surplus, such as Tesla. Tesla's revenue from these credits fell from $2.1 billion in the twelve months to September 2025 to $1.2 billion in the twelve months to September 2026, when its whole operating income was $3.5 billion.
Comparing its latest quarter with the same quarter a year before, Tesla's own update lists lower regulatory credit revenue among the reasons its operating income fell, along with higher operating expenses for research projects, share-based pay and overheads. Its quarterly report says recent government actions have restricted some of these credit programmes. Tesla reports credits as revenue and does not say what they cost it, so how much of its profit they make up cannot be read from the filings.
What the picture leaves out
Operating profit is taken as each company reports it under US accounting rules, with one-off charges left in. Companies also draw the line between operating costs and other costs in their own ways, so their margins compare closely, not exactly. Their fiscal years differ, and Apple and NVIDIA each had one fiscal year with an extra week, which lengthens one quarter and moves their growth figures a little for the year that follows.
A margin and a growth rate describe how a business ran over the past year. They say nothing about what comes next, for the businesses or their shares.
- NVIDIA, Form 10-K for the fiscal year ended 28 January 2024
- NVIDIA, results for the second quarter of fiscal 2027 (quarter to July 2026), Form 8-K exhibit 99.1
- Meta Platforms, Form 10-Q for the quarter ended 30 September 2026
- Meta Platforms, third quarter 2026 results, Form 8-K exhibit 99.1
- Meta Platforms, second quarter 2026 results, Form 8-K exhibit 99.1
- Meta Platforms, fourth quarter and full year 2022 results, Form 8-K exhibit 99.1
- Amazon, third quarter 2026 results, Form 8-K exhibit 99.1
- Amazon, Form 10-Q for the quarter ended 30 September 2026

![Sources 8 : sec.gov · NVIDIA, Form 10-K for the fiscal year ended 28 January 2024], sec.gov · NVIDIA, results for the second quarter of fiscal 2027 (quarter to July 2026), Form 8-K exhibit 99.1], sec.gov · Meta Platforms, Form 10-Q for the quarter ended 30 September 2026] + 5](https://media.cdn.polora.ai/picks/2026/11/pickrun_2629464e53c448a1/00g-K_O1SuSFzm3R-slide-07--how-did-nvidia-outrun.jpg)