What an inverted yield curve is
A Treasury yield is the yearly return the market prices into US government debt. It shows what lenders charge the government to borrow. The rates in this piece are the Federal Reserve's monthly averages of daily yields, from its H.15 release, for 3-month, 10-year and 30-year Treasury debt.
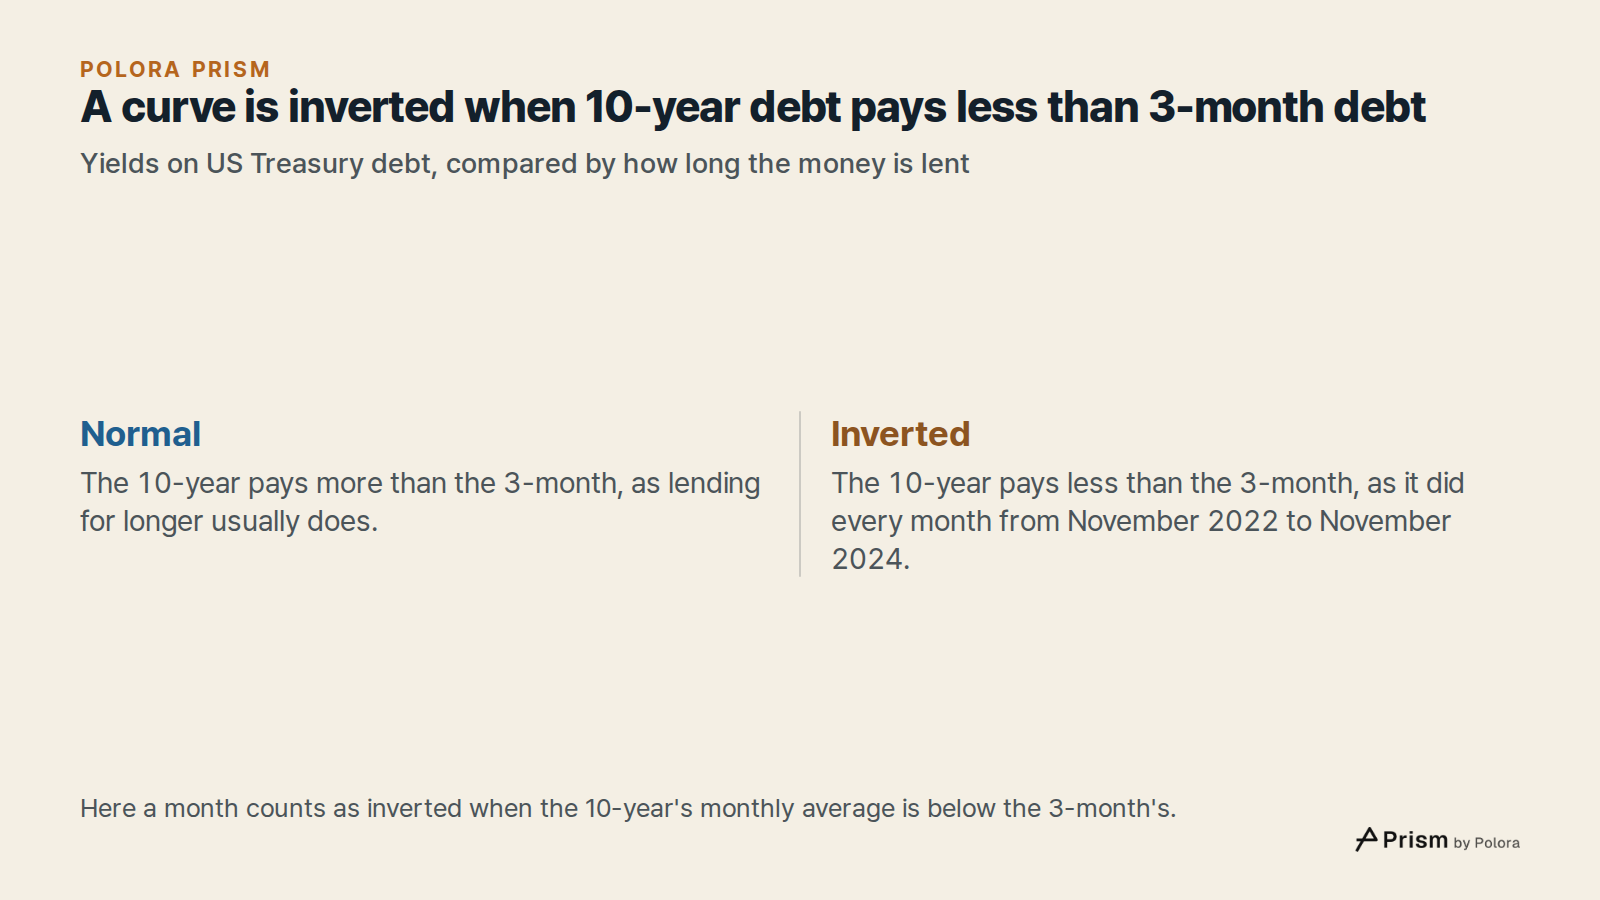
Lending for ten years normally pays more than lending for three months. The San Francisco Fed explains that a long-term rate reflects two things : what investors expect short-term rates to be over those years, plus a term premium, the extra return for tying money up longer. The same source notes that this premium can be close to zero or even negative. When the 10-year pays less than the 3-month, the yield curve is said to be inverted. That is the flip the film shows.
How short rates overtook long ones
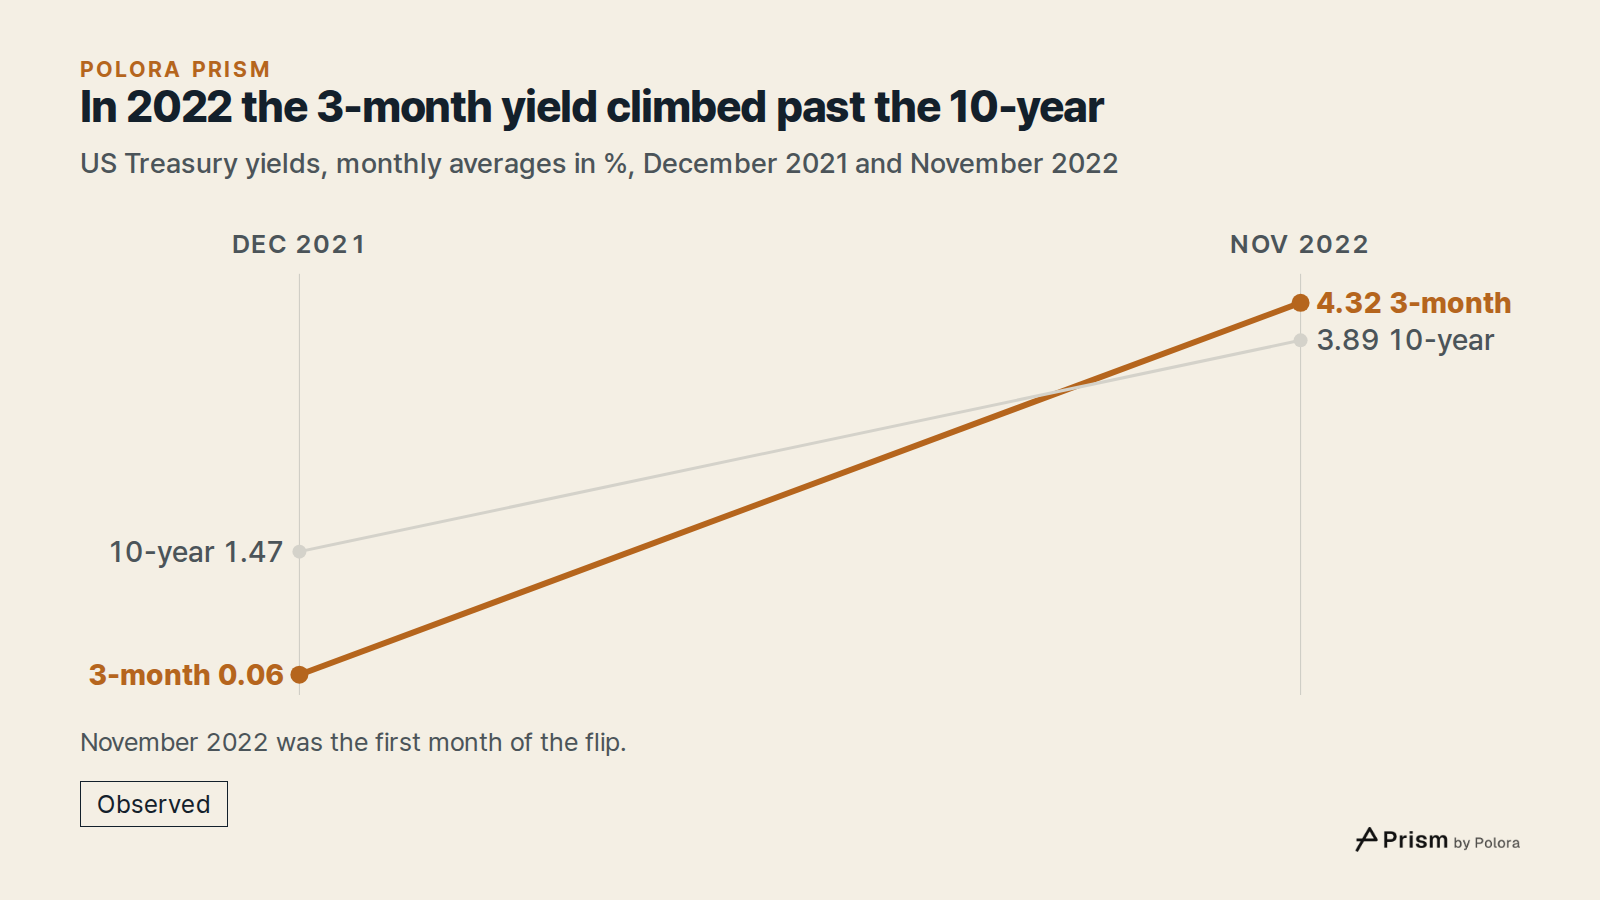
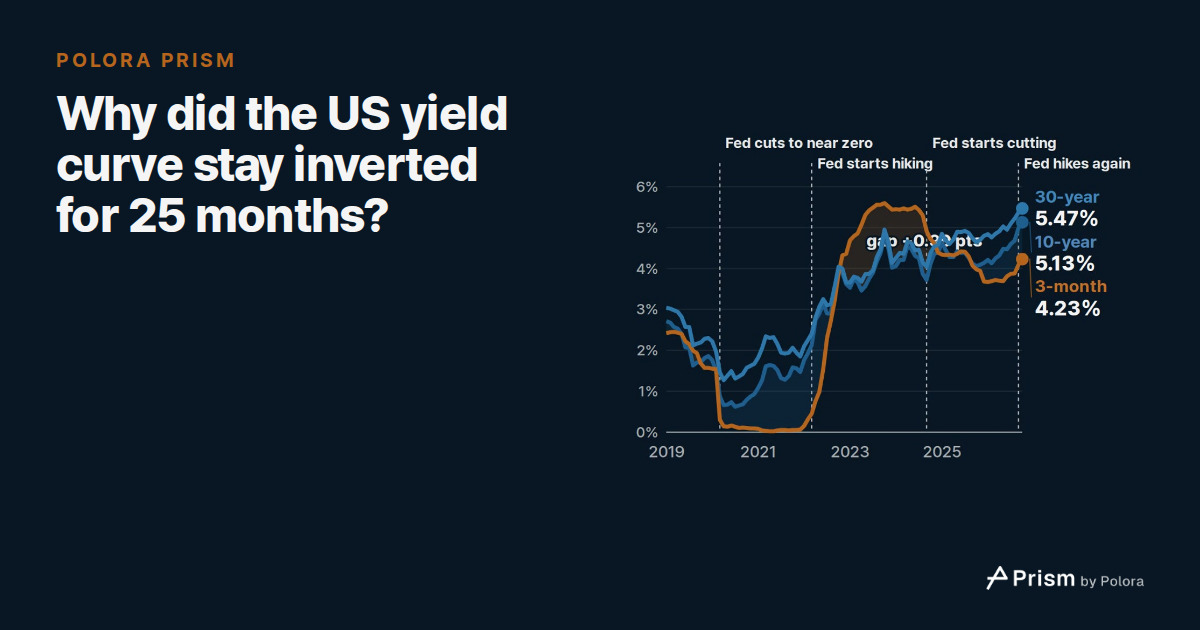
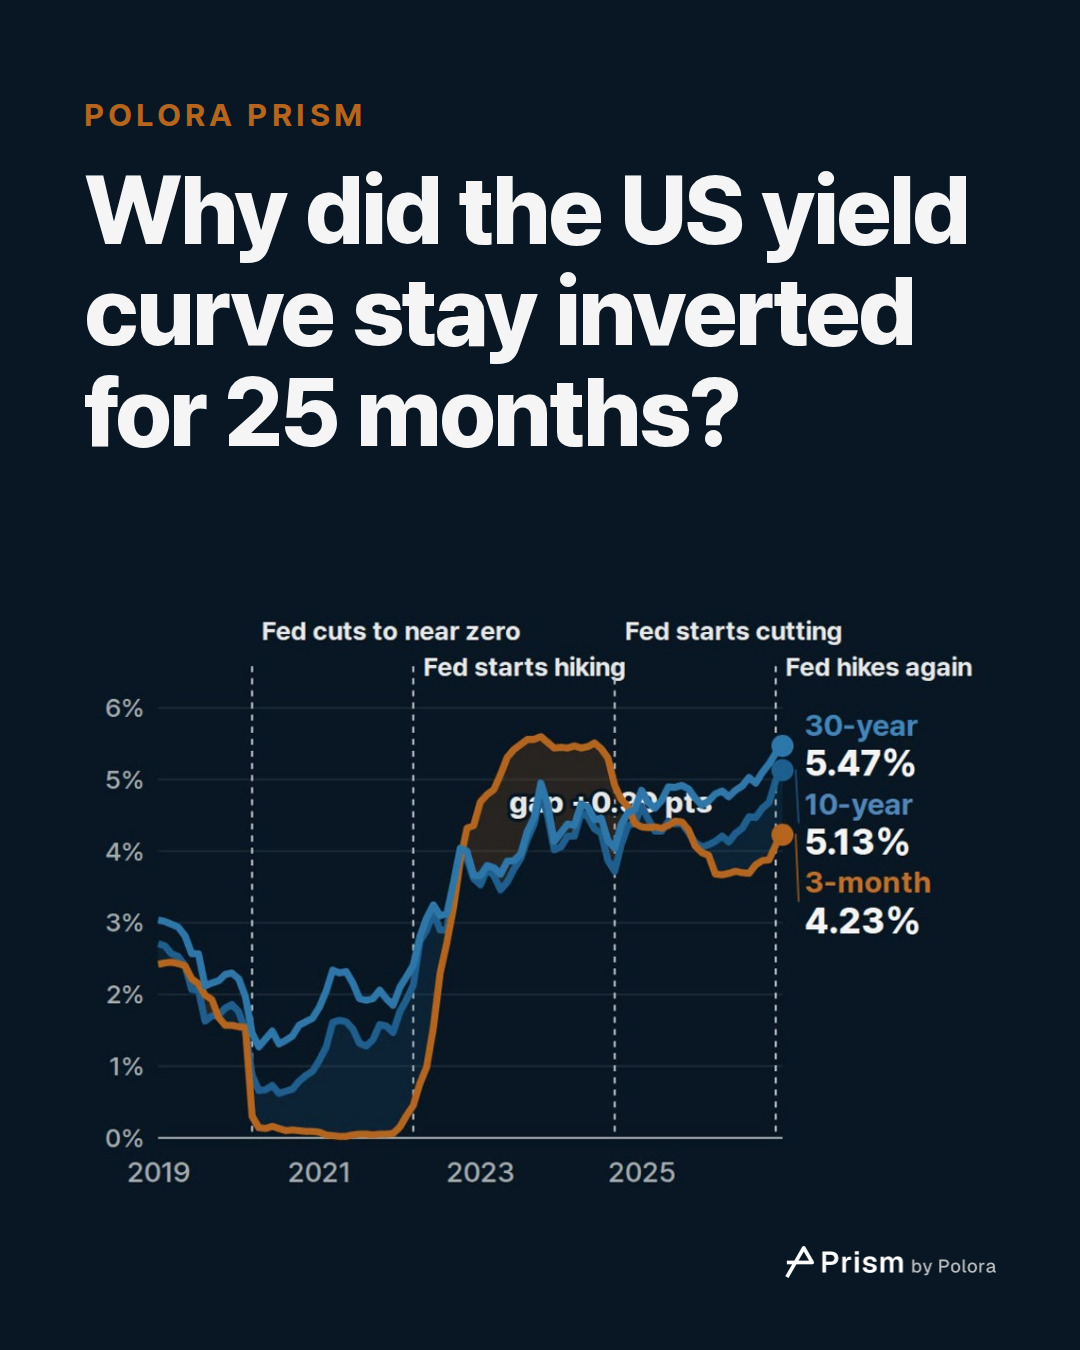
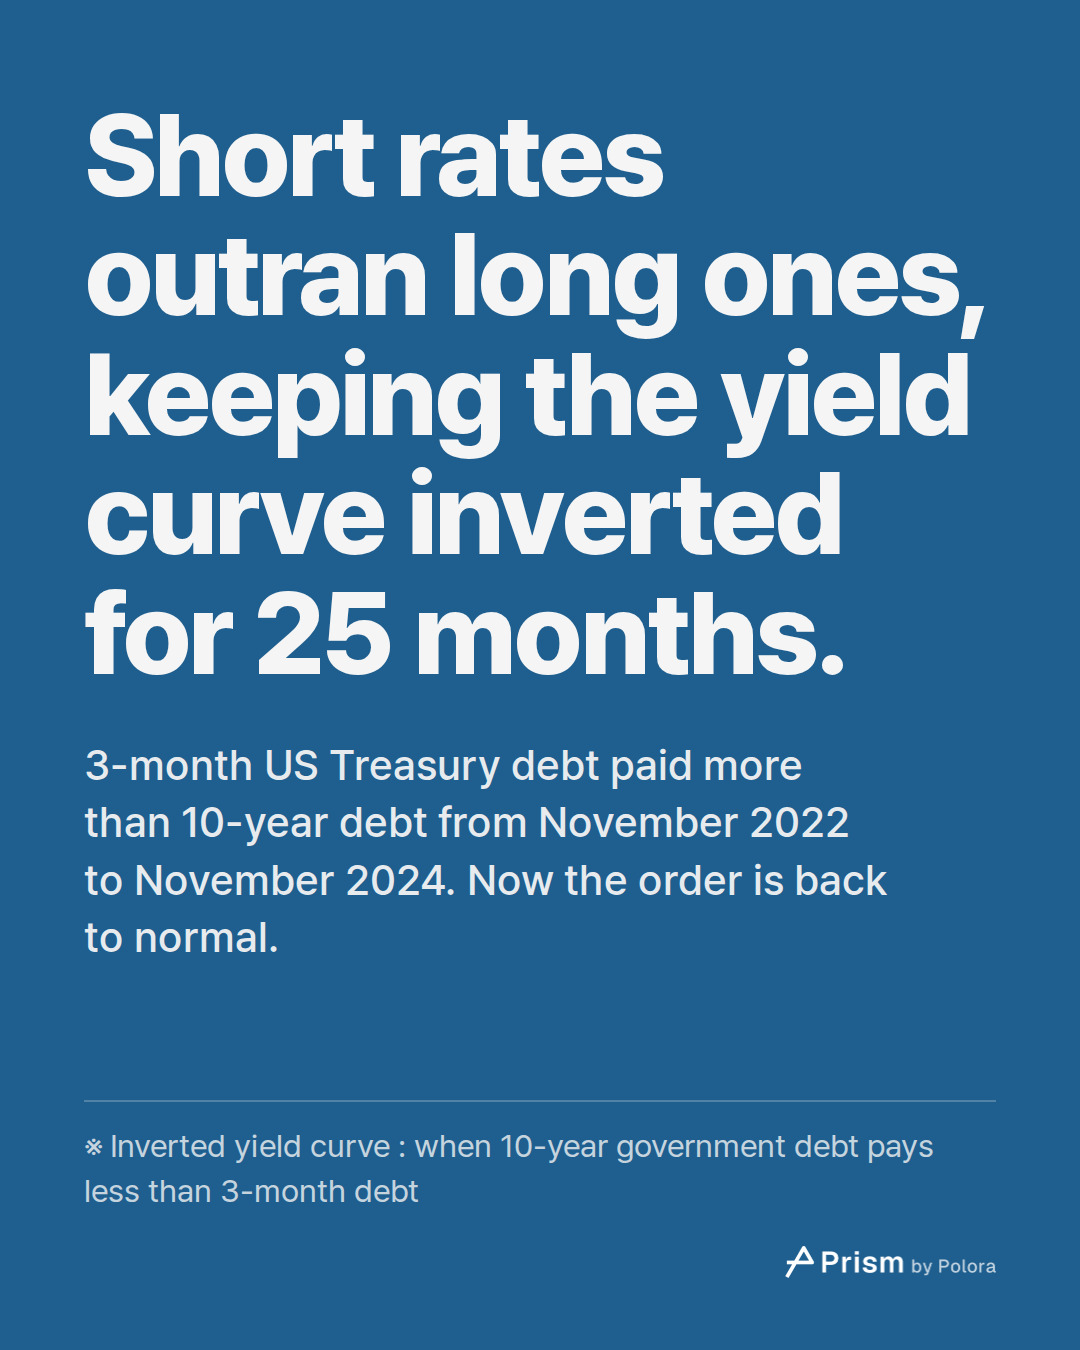
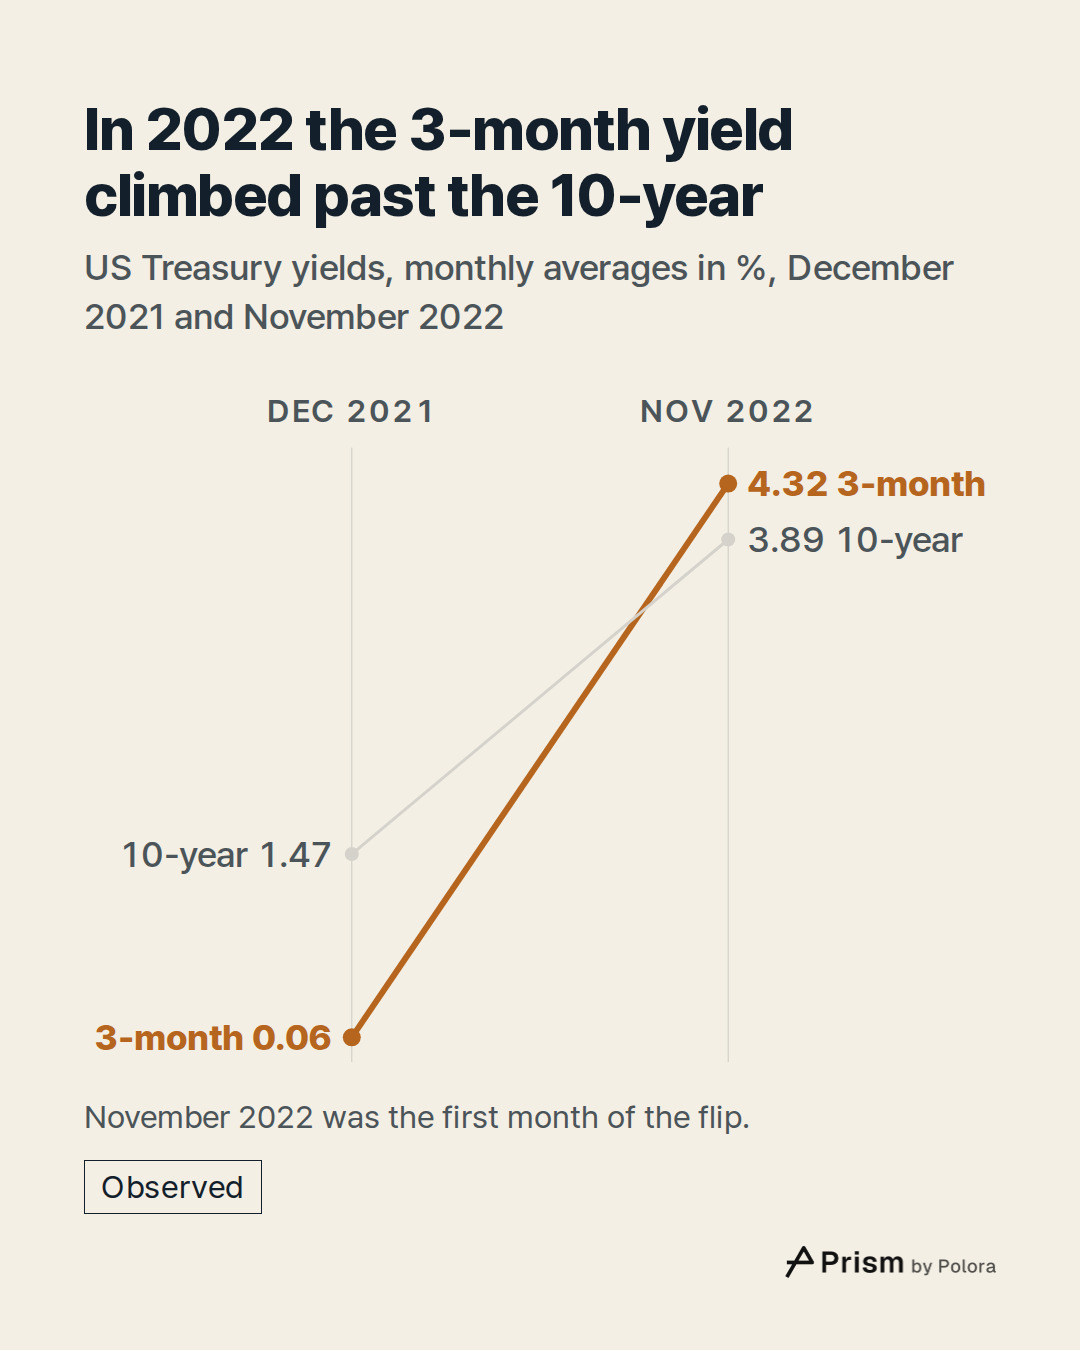
At the end of 2021 the 3-month yield was almost zero : 0.06% in December, against 1.47% for the 10-year. In 2022 the short rate rose much faster. It was already 0.31% in February, before the Fed began raising its rate in March, and 4.32% by November. The 10-year rose too, but more slowly, to 3.89% in November. That was the first month of the flip.
The San Francisco Fed describes this as the usual pattern. Past inversions mostly came from a sharp rise in short-term rates while long-term rates moved more slowly. The Fed raises short-term rates when it tightens policy.
The gap was deepest in May 2023. That month the 3-month averaged 5.31% and the 10-year 3.57%, a gap of −1.74 percentage points. The flip lasted until November 2024. In December 2024 both rates averaged 4.39%.
How unusual 25 months is
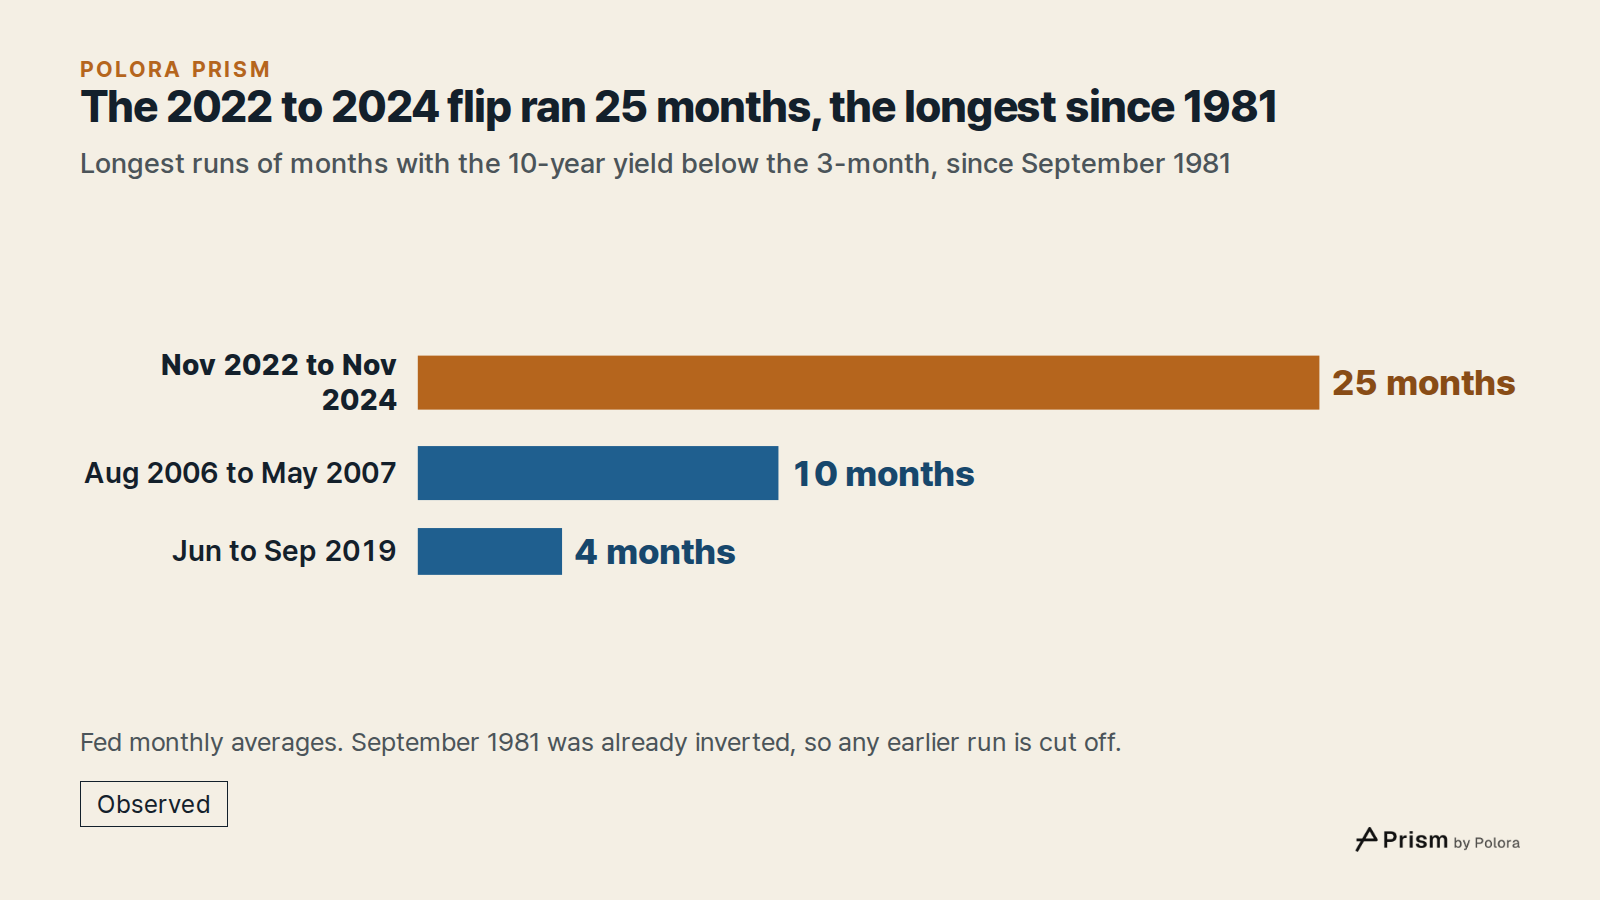
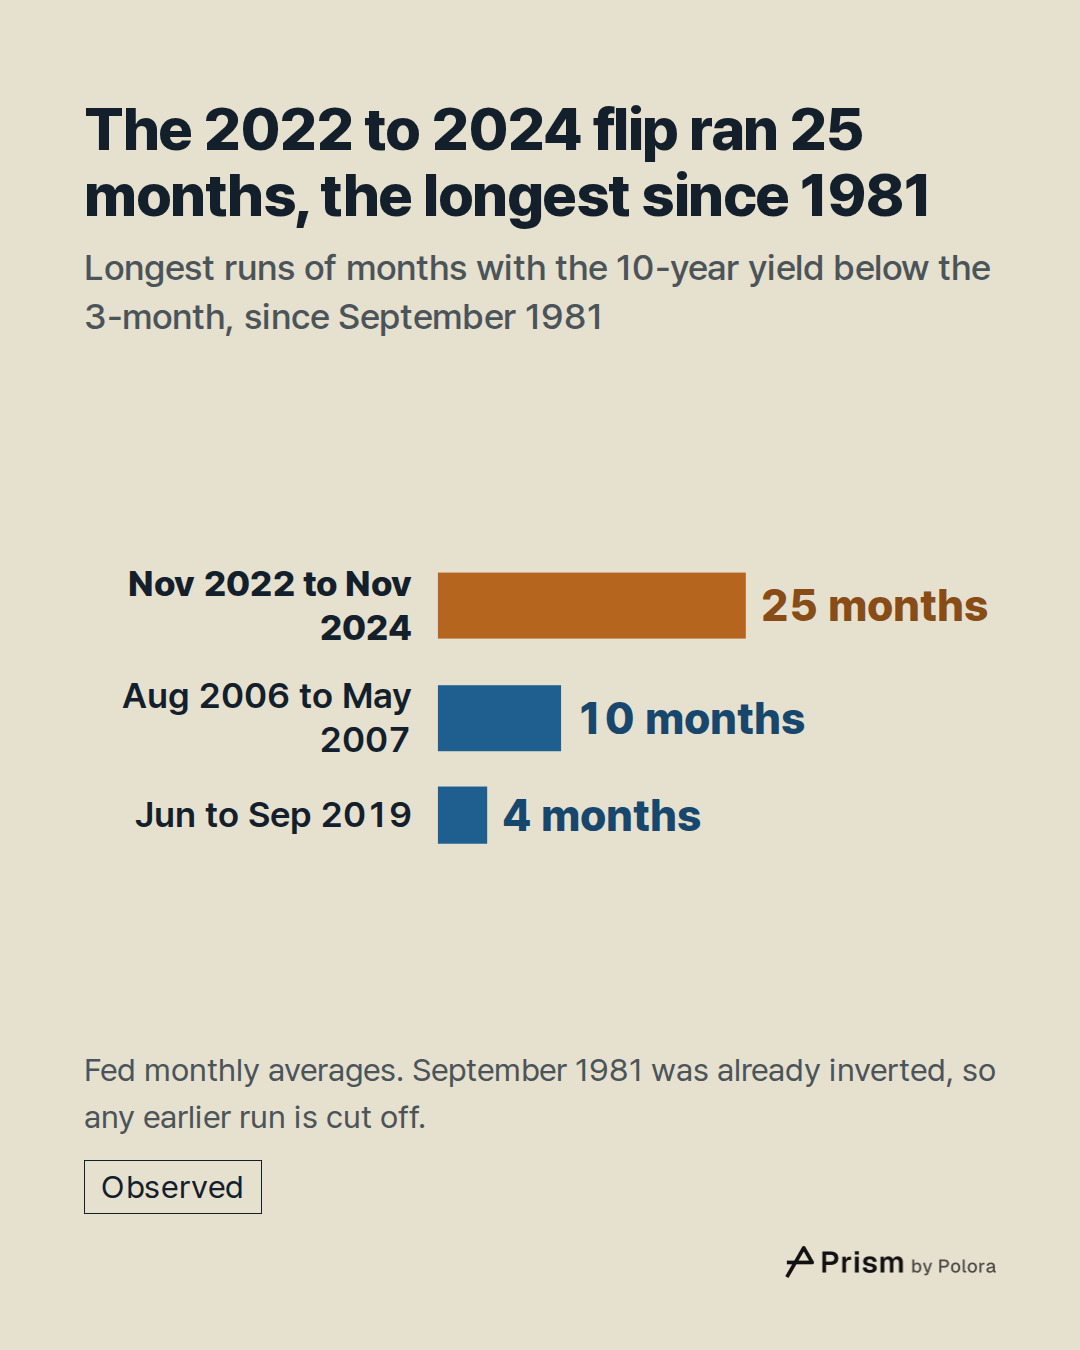
The Fed's monthly 3-month series starts in September 1981, so that is where the comparison can begin. Since then, the next-longest run of months with the 10-year below the 3-month lasted 10 months, from August 2006 to May 2007. The brief flip in 2019 lasted four months, June to September.
The record has one limit. September 1981 was itself a month of inversion, so an earlier episode is cut off at the start of the series.
We checked the result with another common measure : the 10-year against the 2-year, a record that starts in 1976. By that measure the recent flip lasted 26 months, from July 2022 to August 2024. It is still the longest, ahead of 20 months from September 1978 to April 1980.
Why an inverted curve gets watched
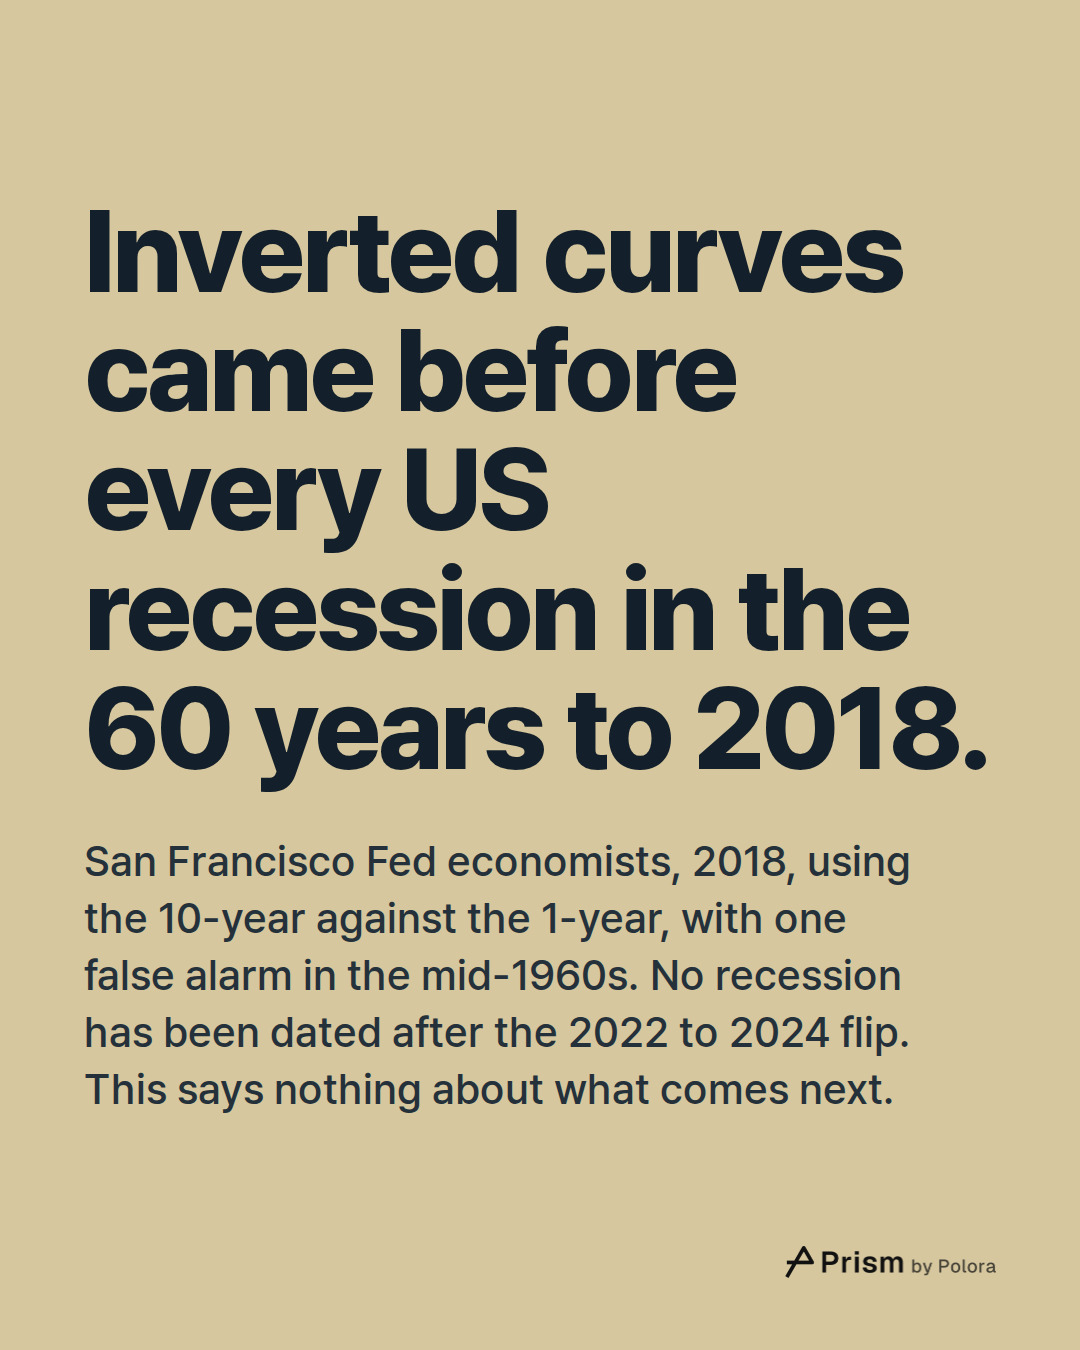
The gap between long and short rates is one of the most closely watched signals about the economy. In a 2018 Economic Letter, San Francisco Fed economists found that every US recession in the 60 years before then was preceded by an inverted curve. In those cases the recession began 6 to 24 months after the gap turned negative. There was one false alarm, in the mid-1960s, when a slowdown followed but no recession. Their measure is the 10-year against the 1-year, not the 3-month used here.
The National Bureau of Economic Research dates US recessions. Its table was last updated in March 2023, and its most recent recession ran from February to April 2020. No recession has been dated after the 2022–2024 flip. None of this says anything about what comes next.
When the Fed cut, the 10-year rose
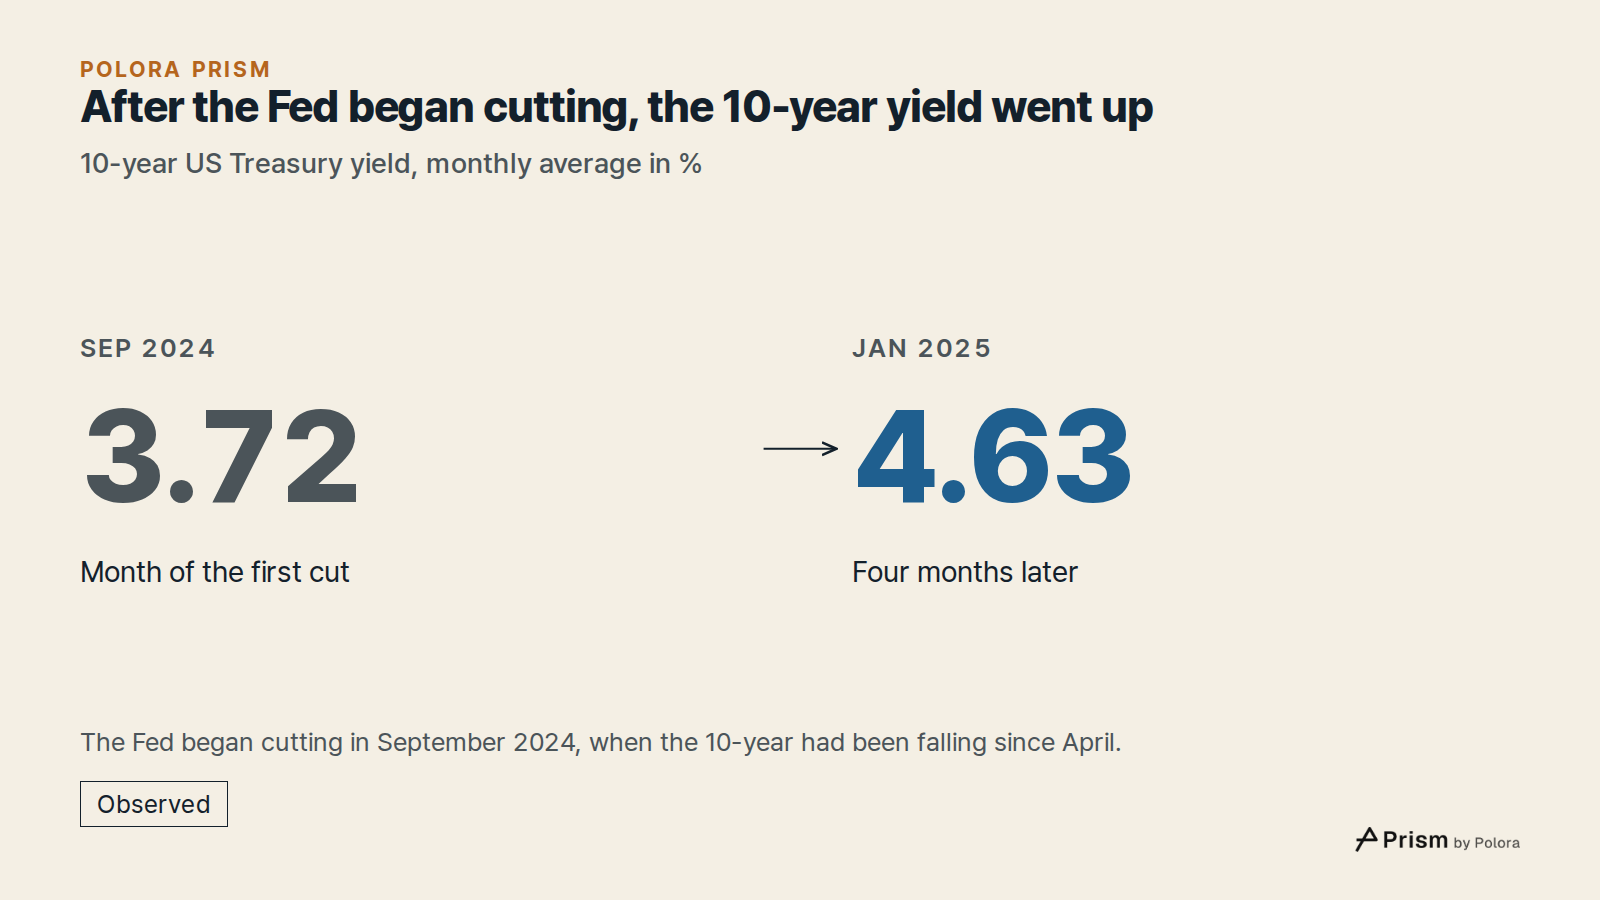
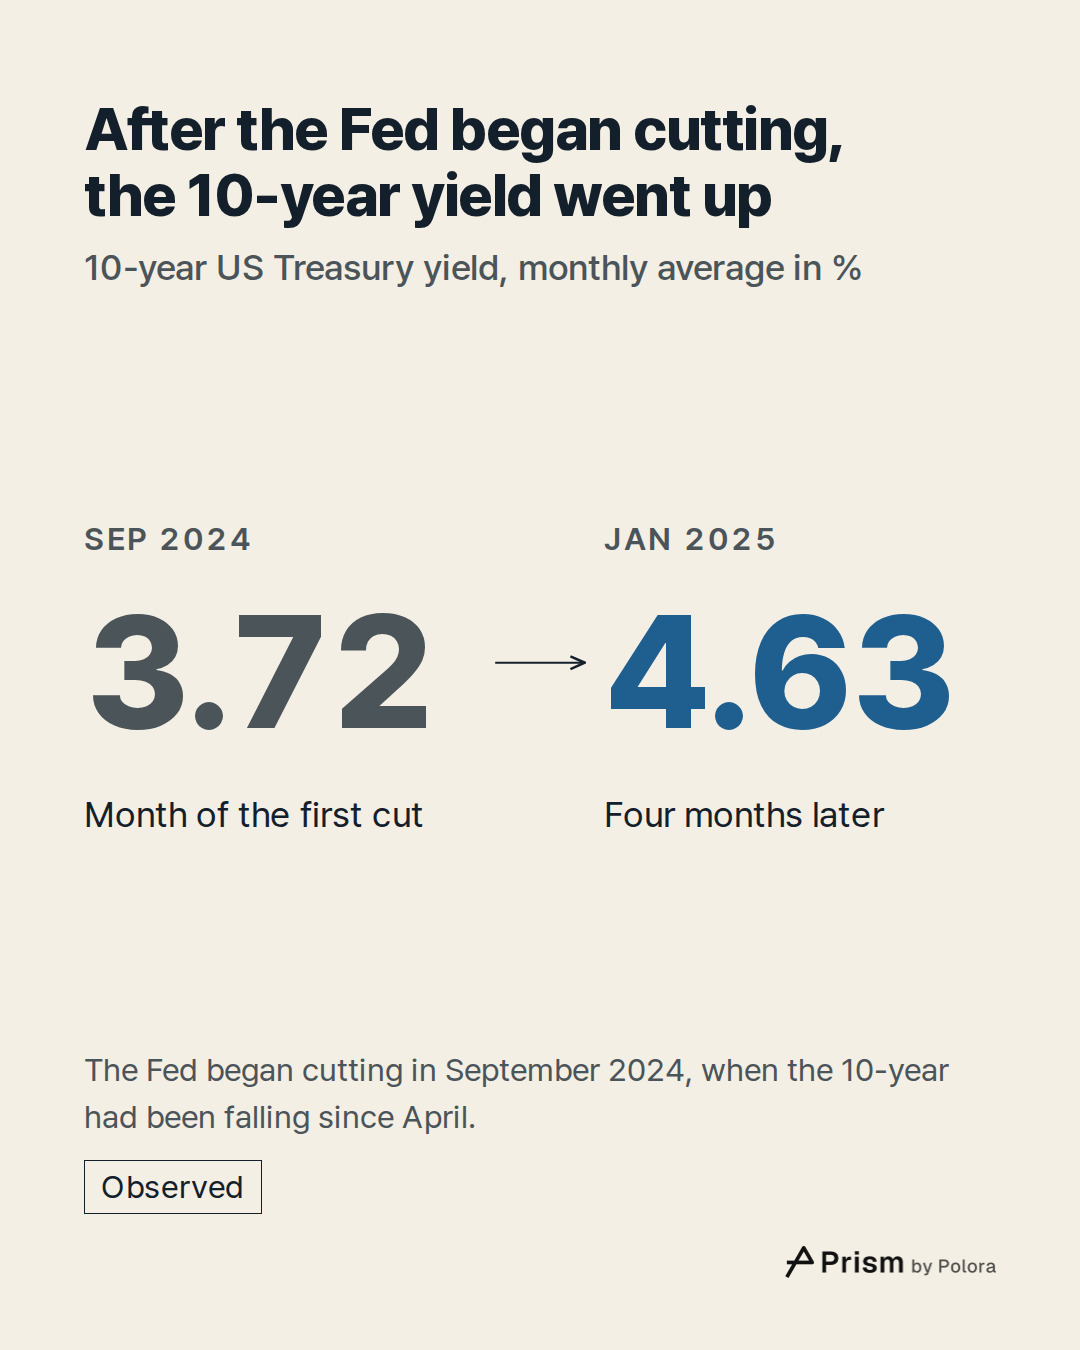
The Fed began cutting its rate in September 2024. By then the 10-year had been falling since April and averaged 3.72% that month, its low for 2024. After the cuts began, it went the other way : 4.63% in January 2025. Through most of 2025 the 10-year and the 3-month were nearly level, and five months were slightly inverted.
From just before that first cut to just before the Fed raised rates again in September 2026, the top of its target range fell by a net 1.75 percentage points. Over the same period, the 10-year ended higher than where it started.
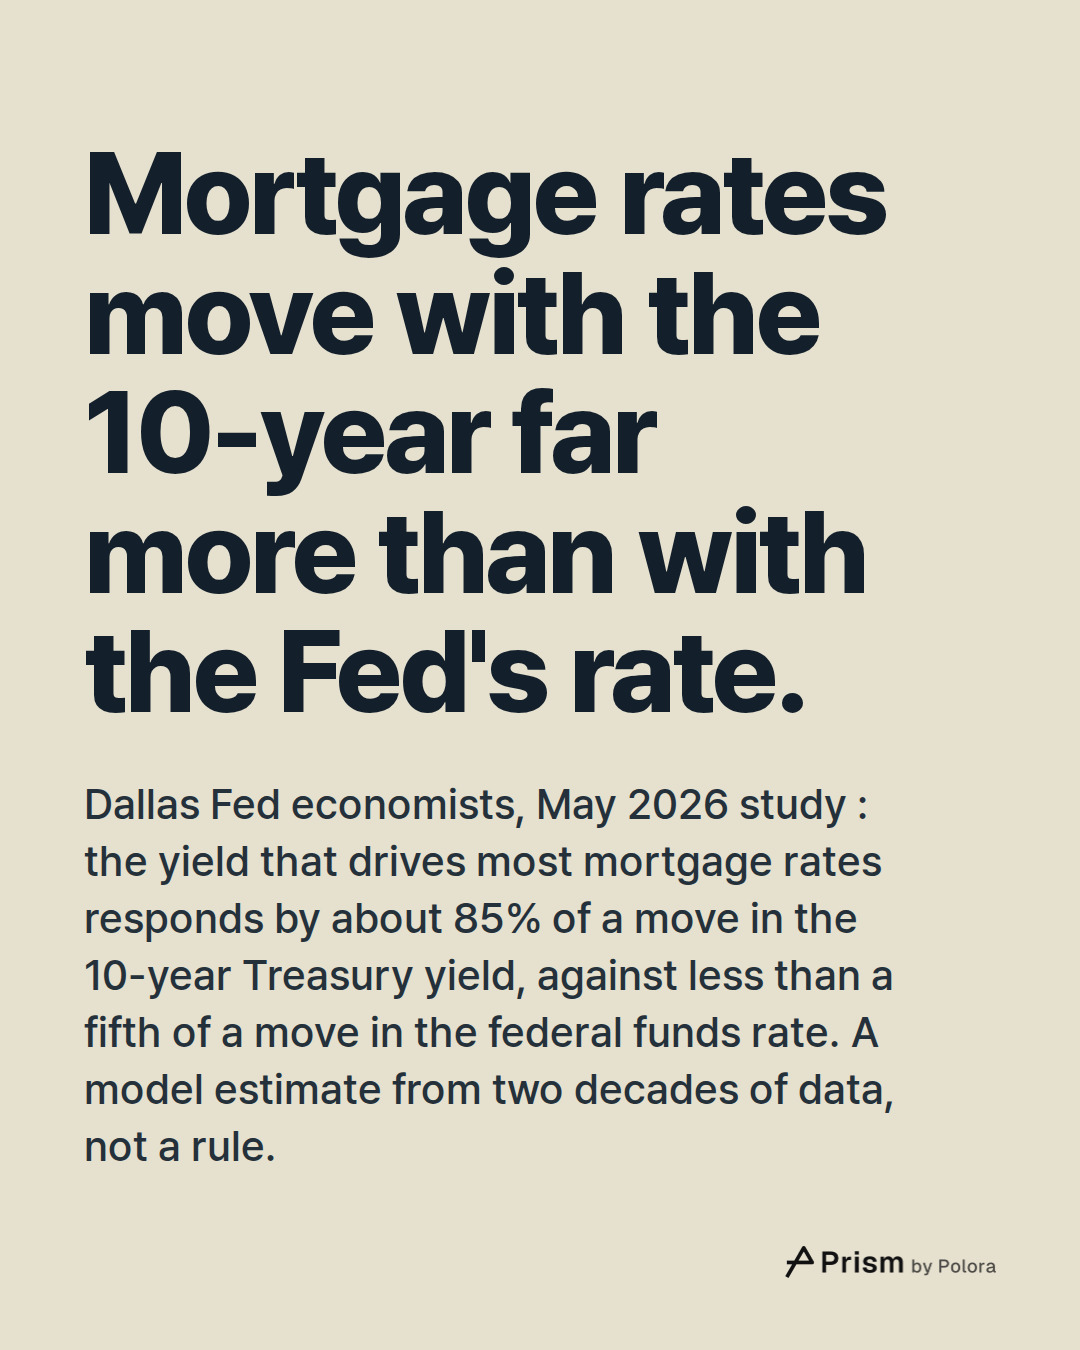
That matters for borrowers. In a May 2026 study, Dallas Fed economists found that mortgage rates move with the 10-year far more than with the Fed's own rate. They studied the yield on new 30-year mortgage-backed securities, which they call the main driver of what most borrowers pay. Holding other factors fixed, including rate volatility, their model puts the response at about 85% of a move in the 10-year, against less than a fifth of a move in the Fed's rate, the federal funds rate. That is an estimate from two decades of data, not a rule. They also noted that, although the Fed's rate had come down since mid-September 2024, mortgage rates were little changed on net.
Where things stand
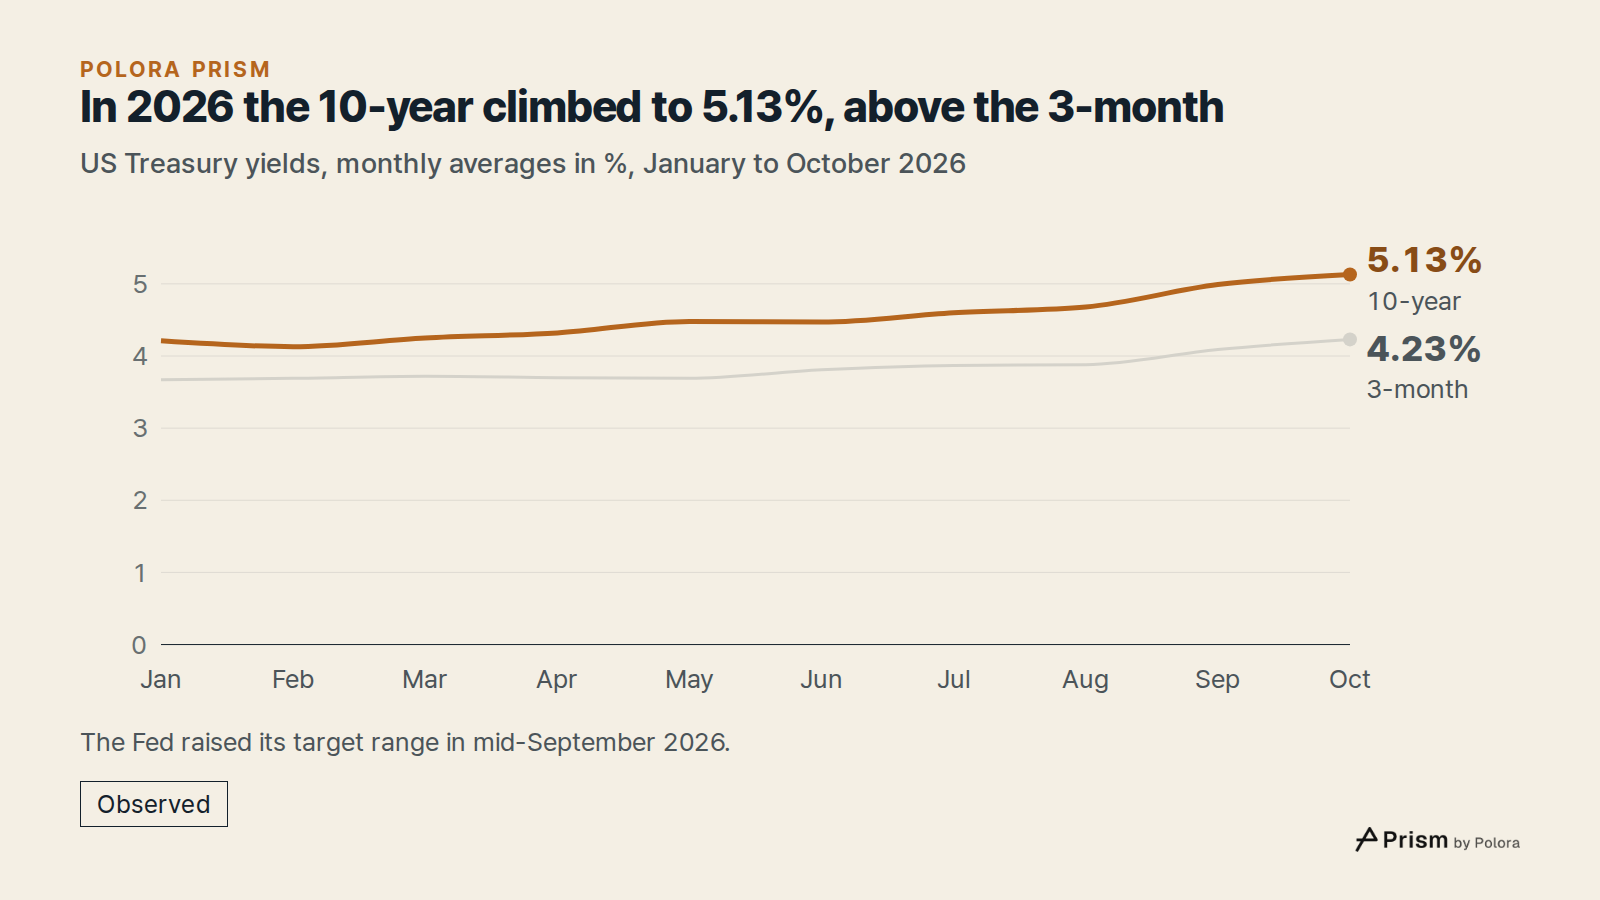
In 2026 long-term yields climbed again : the 10-year averaged 4.21% in January, 4.47% in June and 5.13% in October. The 30-year averaged 5.47% in October. The 3-month averaged 4.23%, so the 10-year paid 0.9 points more. The order is back to normal.
In mid-September 2026 the Fed raised its target range to 3.75% to 4%. By then the 10-year was already climbing. At its late-October meeting the Fed held the range there. The 10-year eased late in October. In November, through the 13th, its daily readings ranged from 4.84% to 5.15%.
How the numbers were made
All yields come from the Federal Reserve's H.15 release, through the St. Louis Fed's FRED database. Monthly figures are the Fed's own monthly averages. We checked each one against the average of the same release's daily yields for that month. November figures are daily yields, checked against the US Treasury's daily yield table. A month counts as inverted when the 10-year's monthly average is below the 3-month's, at two decimals. The Fed's rate decisions come from its own statements. The 1.75-point figure is a net change : the top of the range before the September 2024 cut less the top before the September 2026 rise.
- Federal Reserve Board, H.15 Selected Interest Rates
- FRED, 10-Year Treasury Constant Maturity, monthly (GS10)
- FRED, 3-Month Treasury Constant Maturity, monthly (GS3M)
- FRED, 30-Year Treasury Constant Maturity, monthly (GS30)
- FRED, 2-Year Treasury Constant Maturity, monthly (GS2)
- FRED, 10-Year Treasury Constant Maturity, daily (DGS10)
- US Treasury, daily par yield curve rates, November 2026
- Federal Reserve, FOMC statement, March 15, 2020
![Sources 8 : federalreserve.gov · Federal Reserve Board, H.15 Selected Interest Rates], fred.stlouisfed.org · FRED, 10-Year Treasury Constant Maturity, monthly (GS10)], fred.stlouisfed.org · FRED, 3-Month Treasury Constant Maturity, monthly (GS3M)] + 5](https://media.cdn.polora.ai/picks/2026/11/pickrun_d17aabc9a30f41ac/Iev2V7a6iEpdo_2l-slide-08--why-did-the-us.jpg)