What the Fed is measuring
The figures come from the Federal Reserve's Distributional Financial Accounts. They take the Fed's national balance sheet of US households and divide it among groups ranked by wealth : the richest 1%, the next 9%, the next 40% and the bottom half.
The measure is one line of that balance sheet, which the Fed calls "corporate equities and mutual fund shares", set against households' total assets. Total assets means everything households own before their debts are subtracted : homes, cars and other durable goods, bank deposits, bonds, pension entitlements, their own businesses and the rest.
"Shares and funds" is broader than listed stocks. The Fed's category includes shares in privately held companies as well as public ones, and shares in mutual funds, with money market funds counted separately. In the release used here, it also includes hedge-fund and private-debt-fund shares, which the Fed says it has not yet separated out in these accounts.
A new high for shares and funds
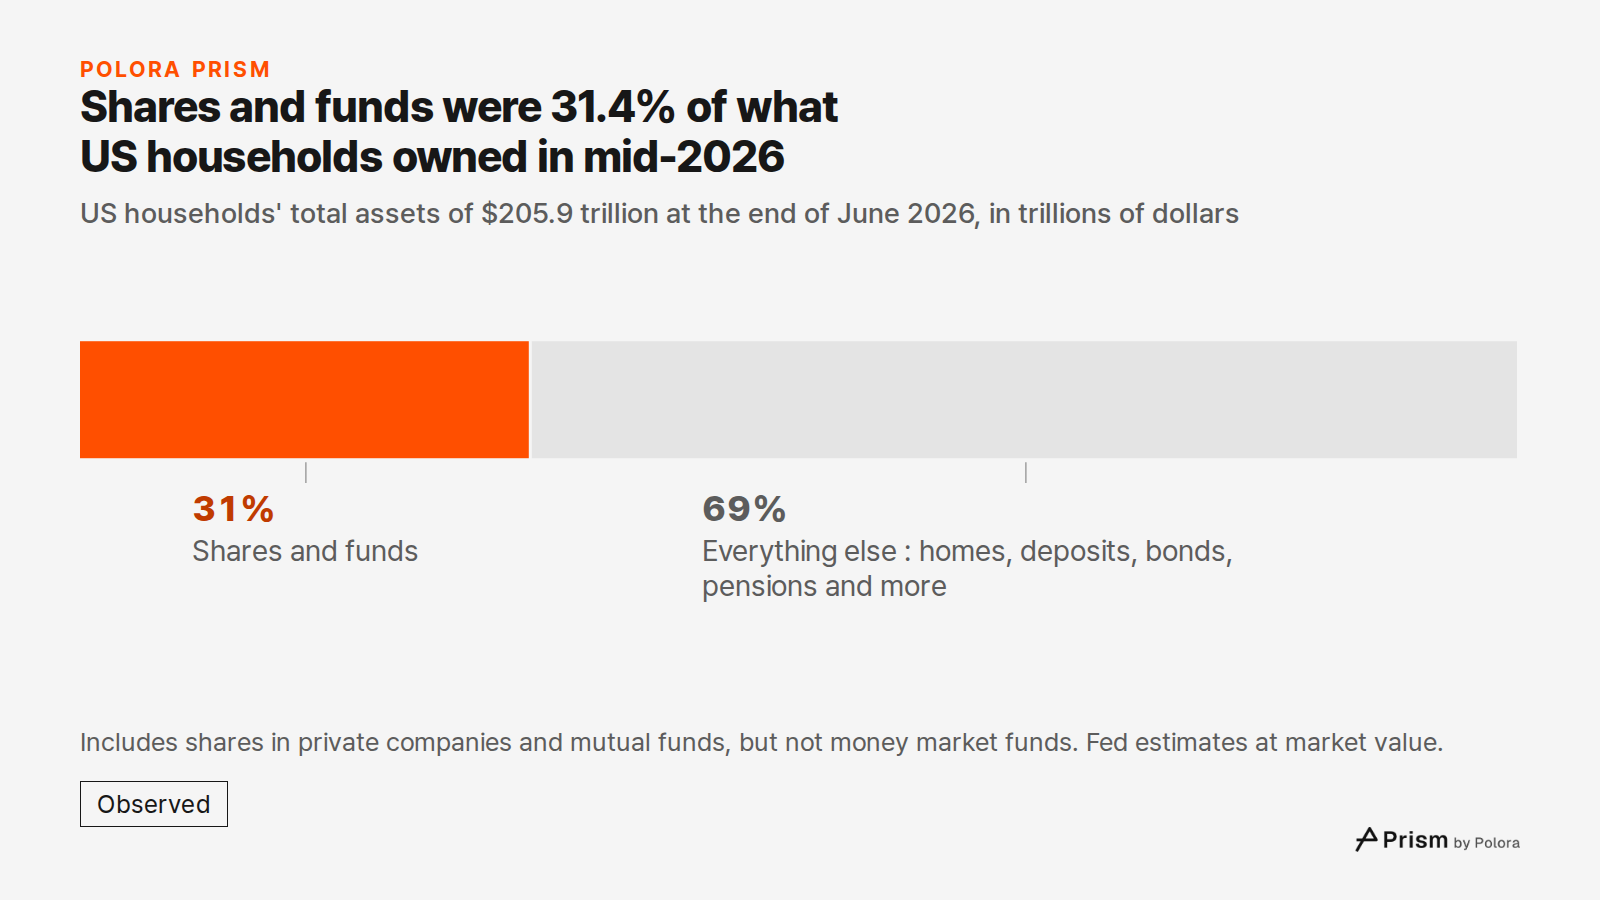
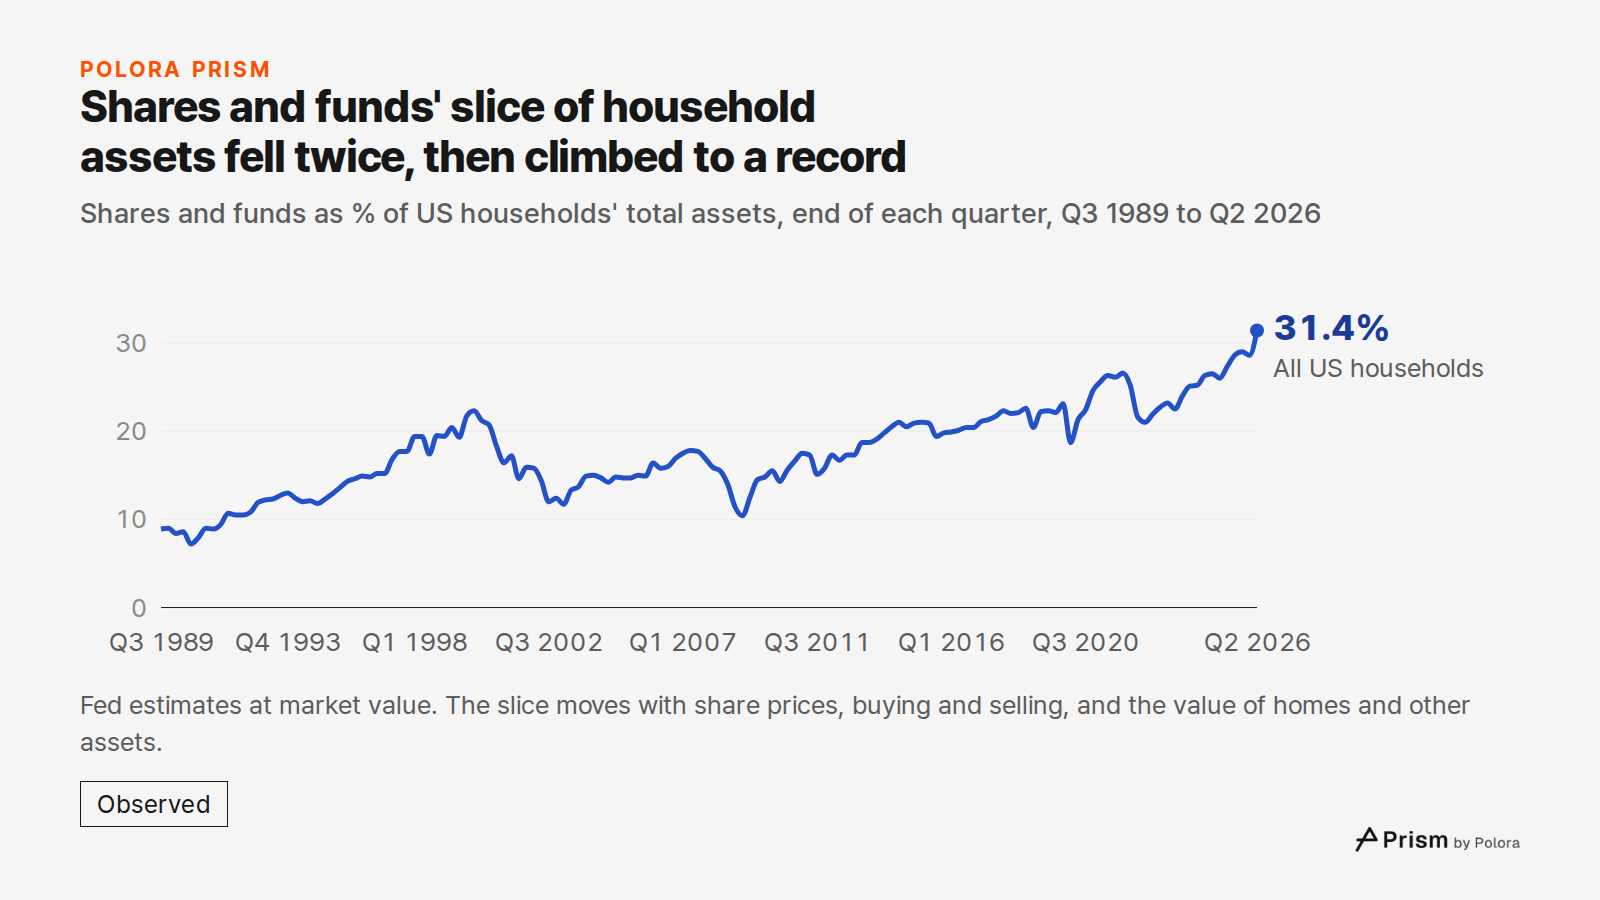
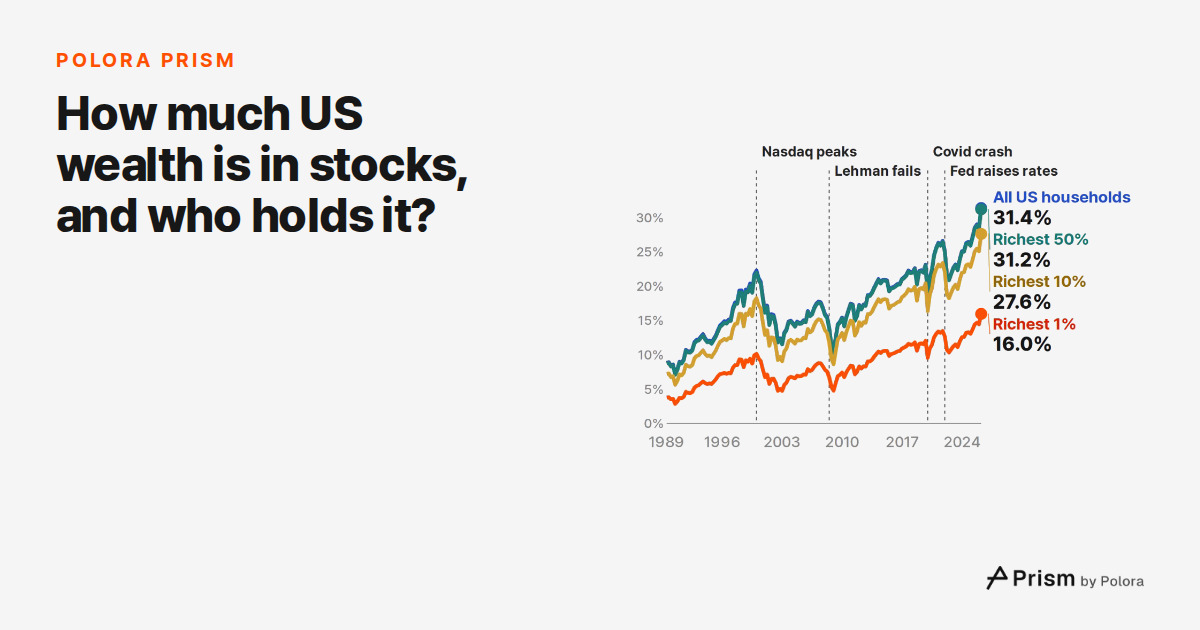
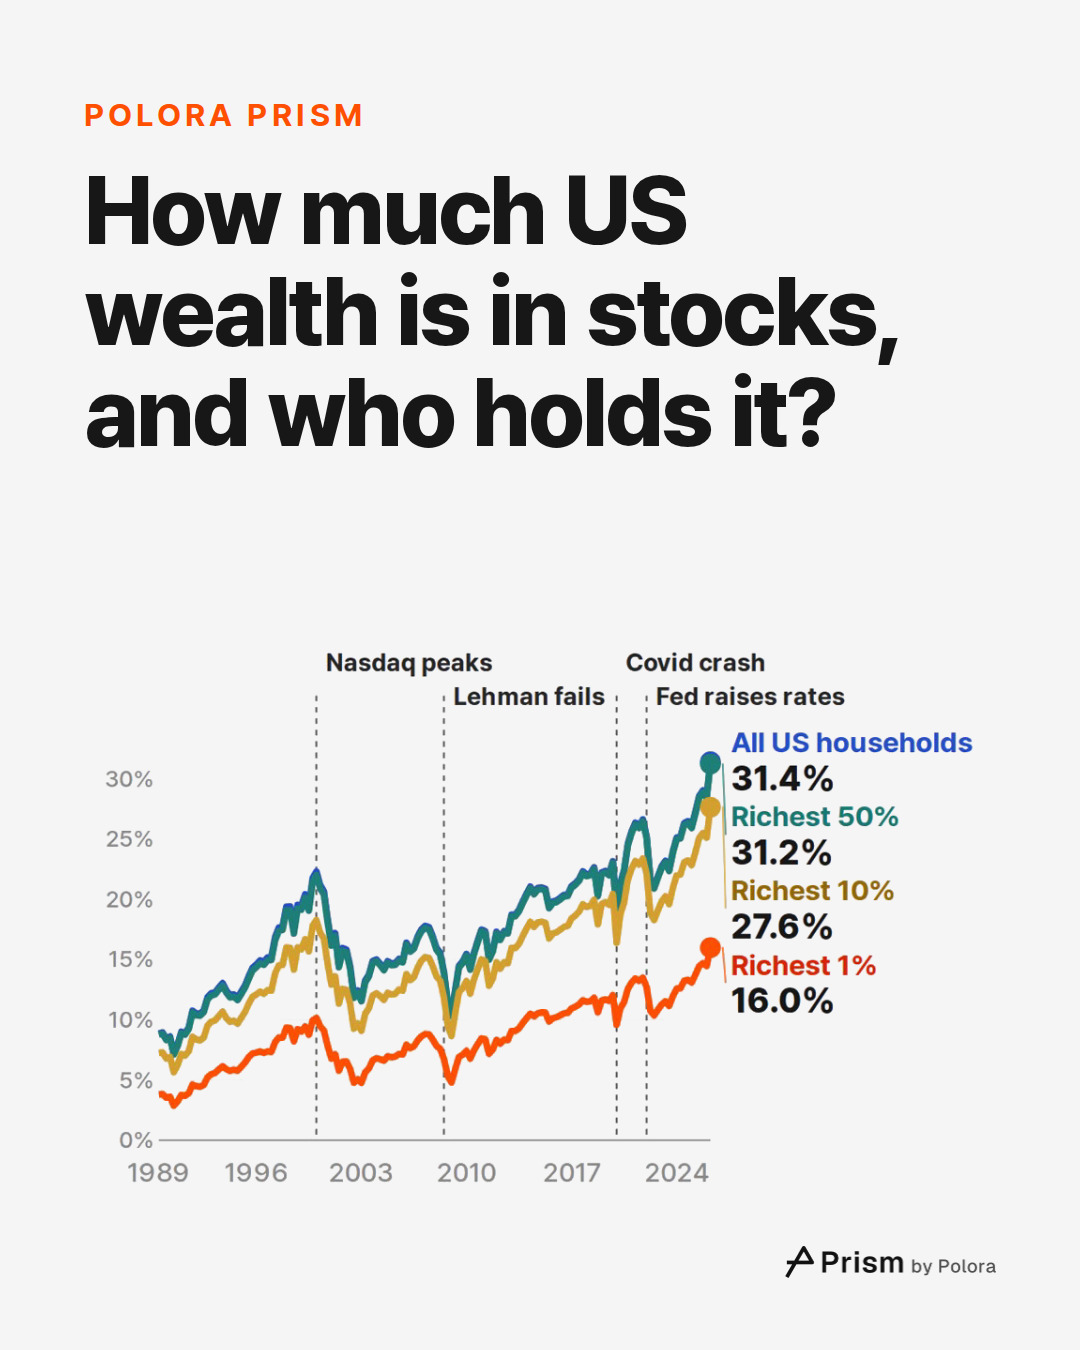
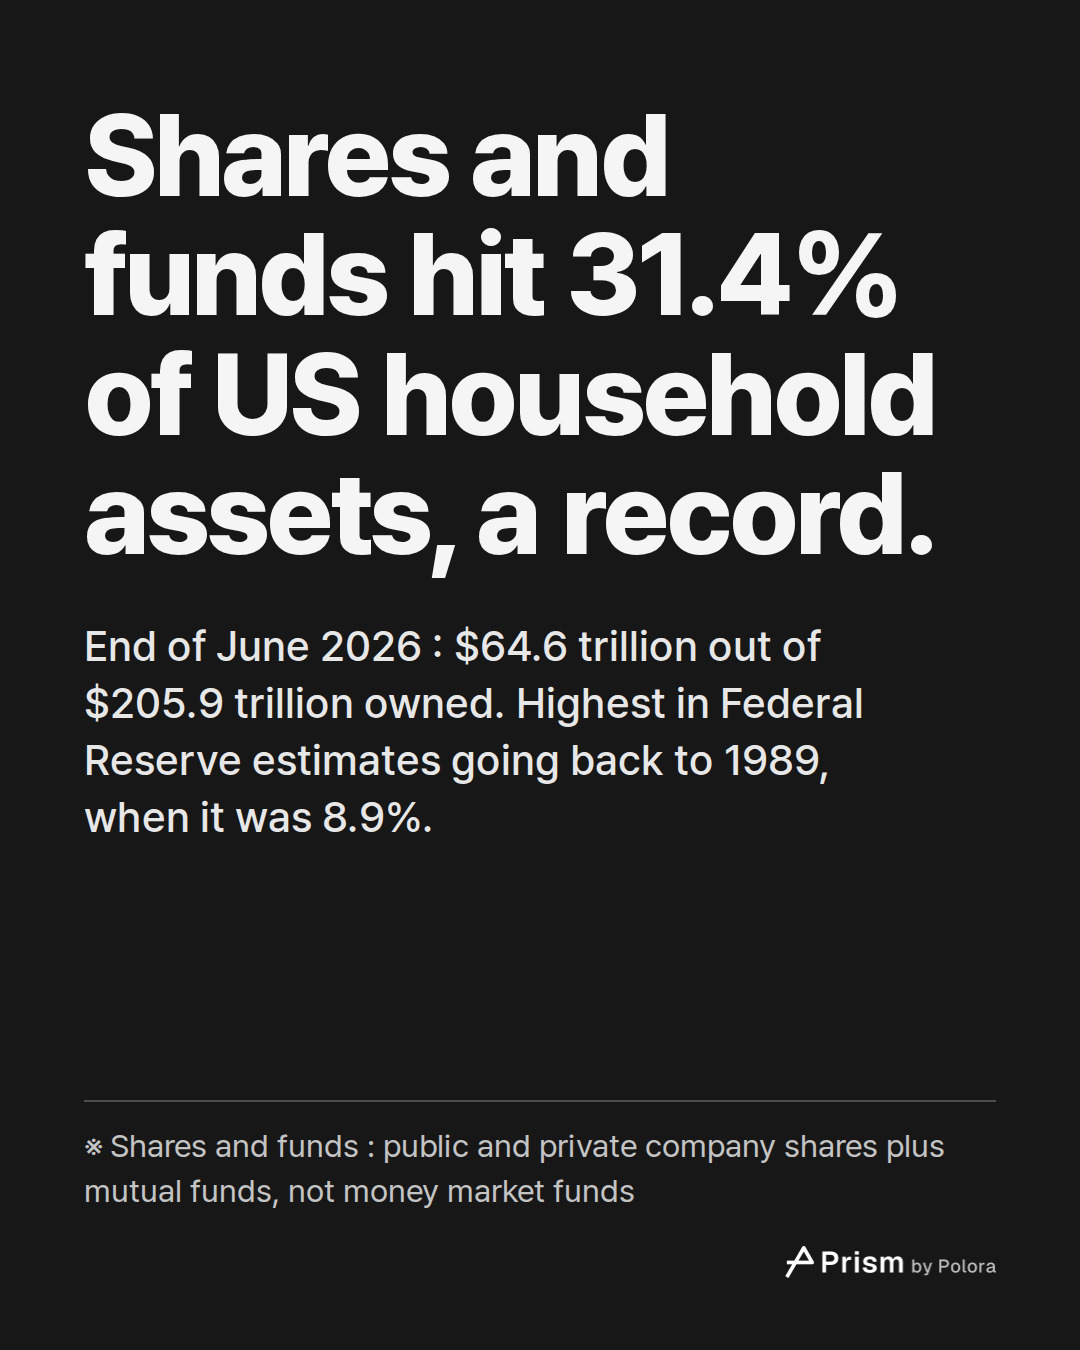
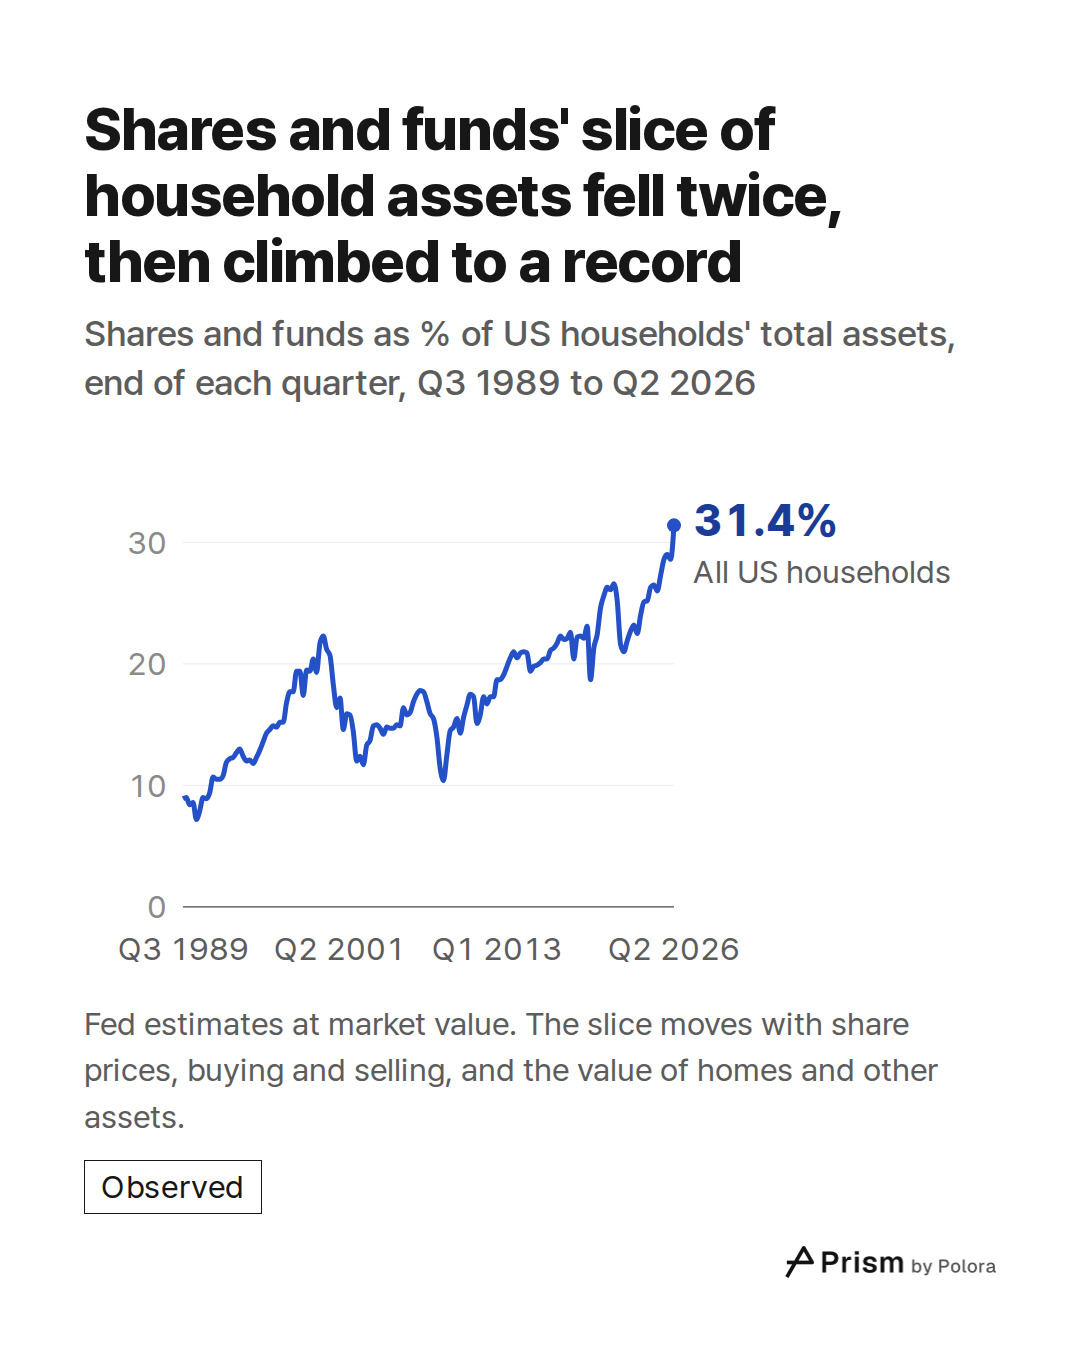
At the end of June 2026, households held $64.6 trillion of these shares and funds, out of $205.9 trillion in total assets. That is 31.4%. In 1989, when the series begins, the slice was 8.9%.
The latest step was a big one. Three months earlier, at the end of March 2026, the slice was 28.6%. The Fed's accounts value shares at market value, so the slice moves with share prices, with what households buy and sell, and with the value of everything else they own, homes included. These figures do not separate those effects.
How it got here
The slice more than doubled through the 1990s, reaching 22.3% in the first quarter of 2000, the quarter the Nasdaq peaked. It fell in the dot-com bust, recovered part of the way in the mid-2000s, then fell again in the 2008 financial crisis, when Lehman Brothers failed. By early 2009 it was 10.4%.
The climb since then has had setbacks. The slice was back at its 2000 level by late 2017, dropped to 18.7% in the Covid crash at the start of 2020, and reached 26.6% at the end of 2021. In 2022 it fell to 21.0% by the third quarter. That was the year the Fed began raising interest rates from near zero, with the first rise announced in March. Since then the slice has risen, with dips along the way, to the new high.
These events line up in time with the falls. The figures here do not show how much of each fall any one event caused.
Who holds them
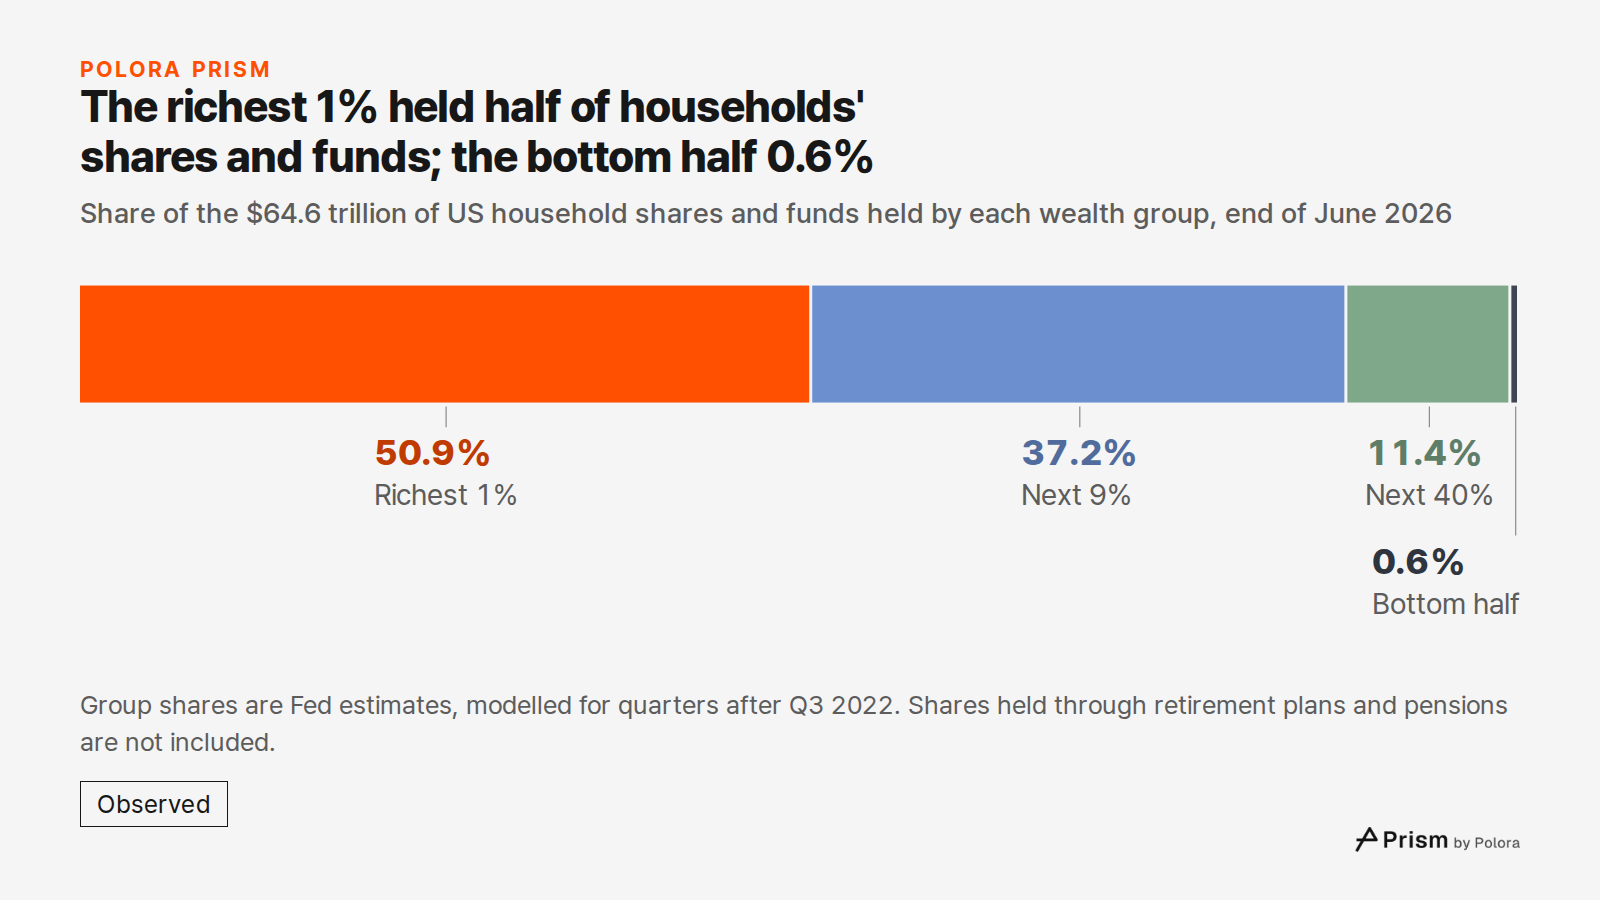
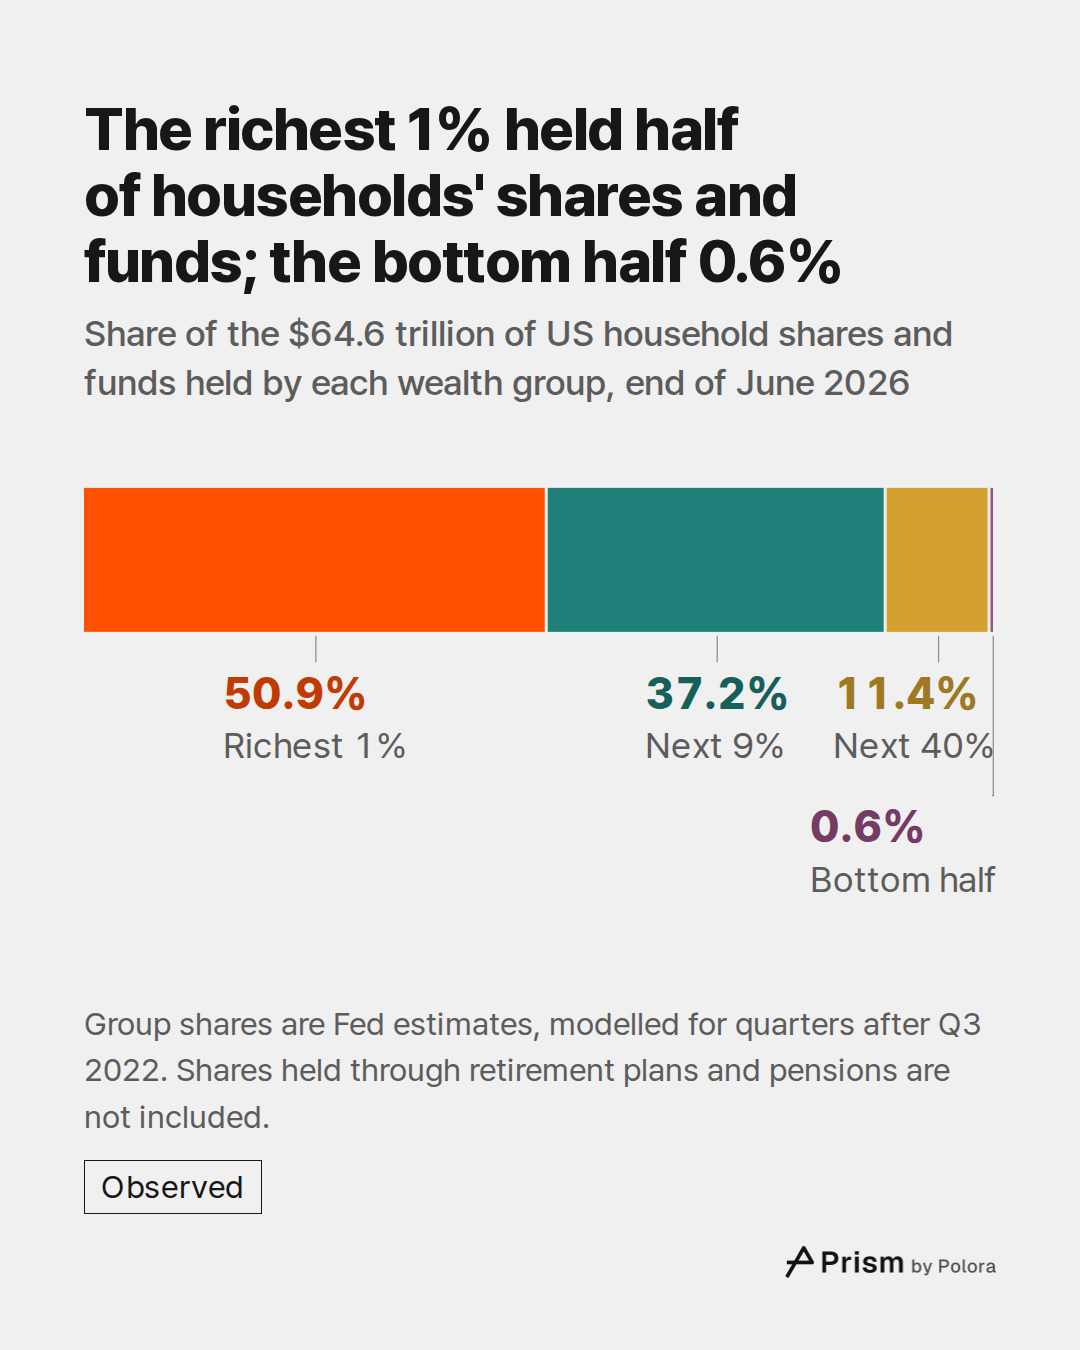
Here the measure changes. These are not slices of total assets but shares of the $64.6 trillion of holdings themselves.
In mid-2026 the richest 1% of households held 50.9% of them, about $32.9 trillion. The next 9% held 37.2%. The next 40%, the households between the middle and the top tenth, held 11.4%, down from 17.2% in 1989. The bottom half held 0.6%, down from 1.1% in 1989.
The richest 1%'s share has risen from 42.8% in 1989, but not in a straight line, and it is not at a record. It peaked at 52.3% in the third quarter of 2019.
The bottom half's small share is also why, in the film that goes with this piece, two of the lines nearly touch. Each line counts a group together with every richer group, so the richest 50% line includes the richest 10% and the richest 1%. The gap between "all US households" and "the richest 50%" is therefore the bottom half's holdings, which are a sliver of total assets.
What the count leaves out
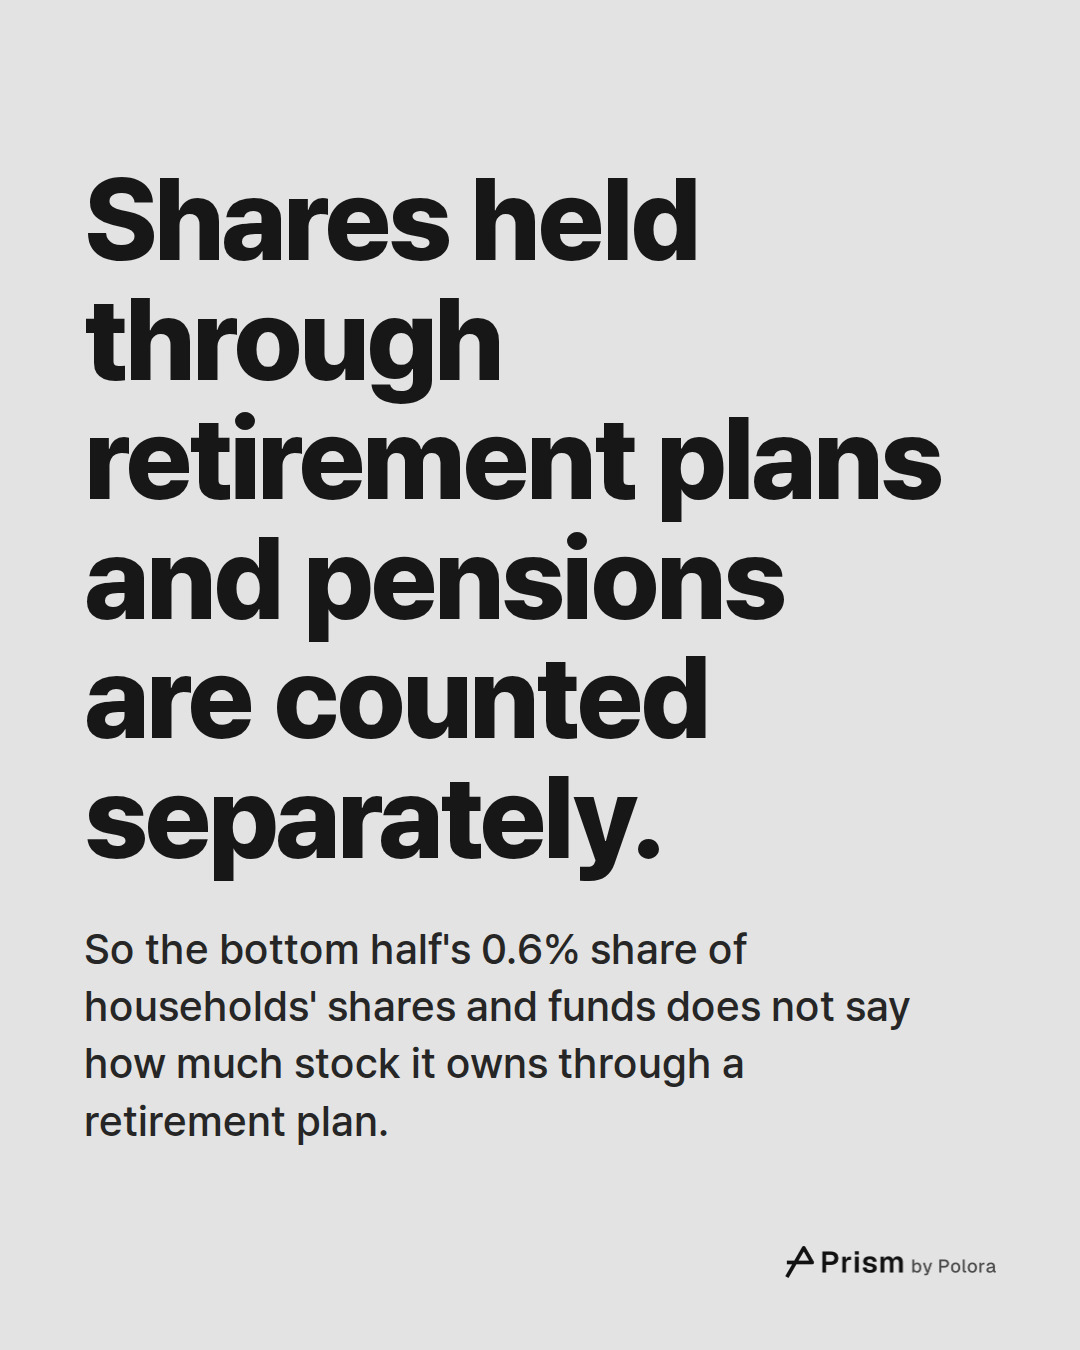
Shares that people hold through workplace retirement plans and pensions are not in this category. The Fed counts them separately, as pension entitlements of two kinds : defined-benefit, the traditional pensions that promise a set payment, and defined-contribution, plans built from each worker's own account, which here also include individual annuities. Those entitlements are still part of total assets, so they count in what households own but not in their shares and funds.
So the bottom half's 0.6% is a share of this category only. It does not say how much stock the bottom half owns through a retirement plan. The richest 1%'s share of all stock, retirement plans included, cannot be worked out from these figures.
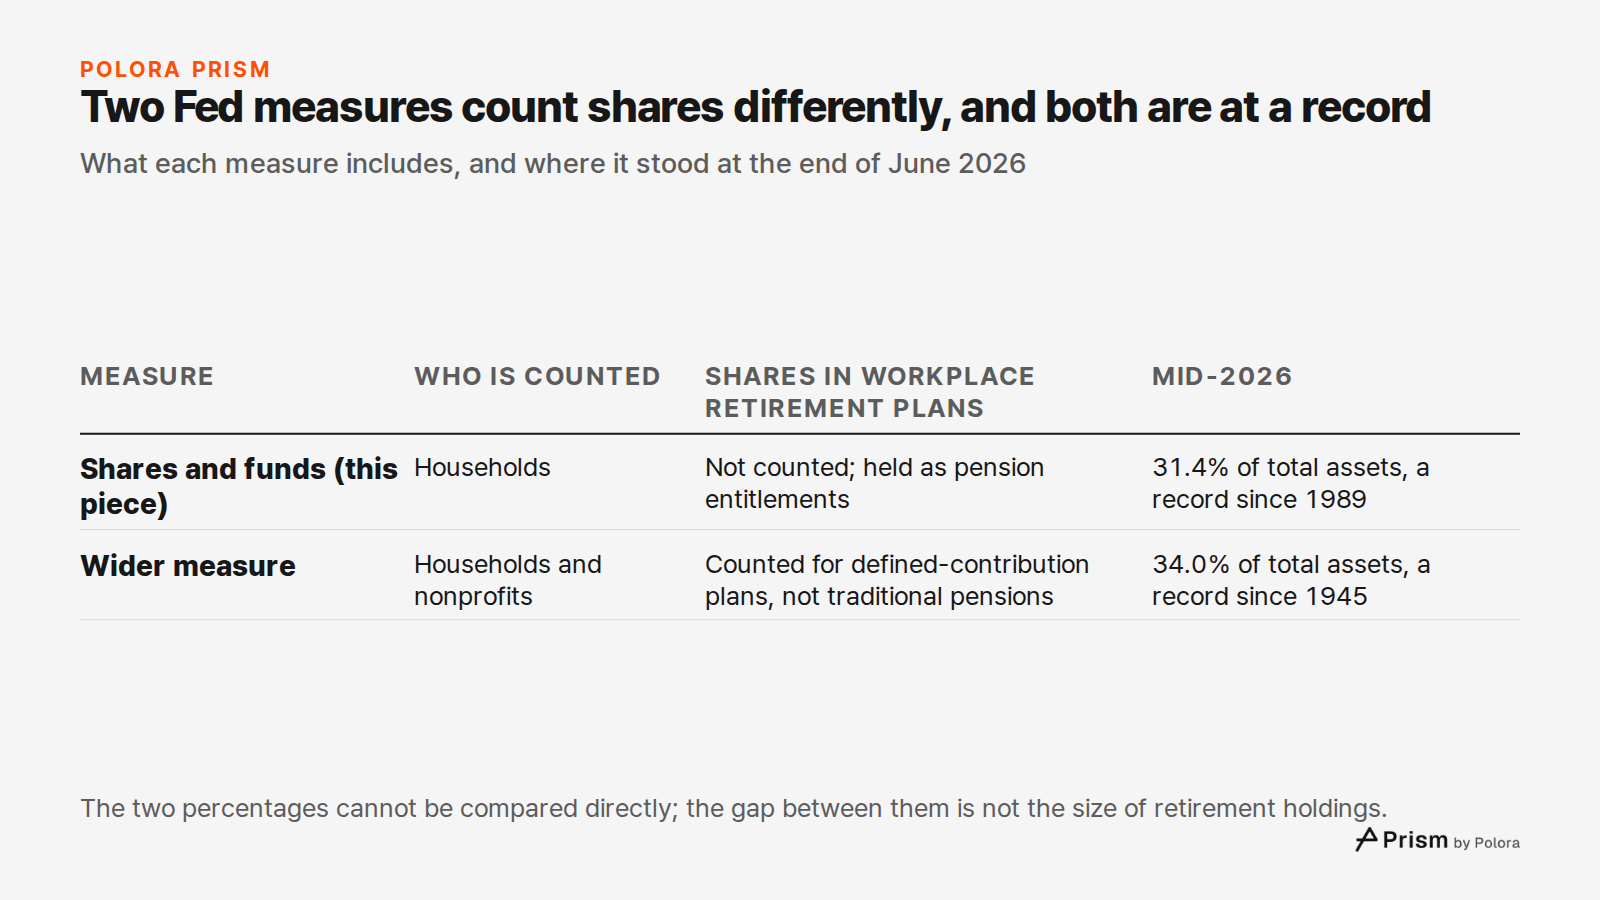
A wider measure in the Fed's main Financial Accounts does count shares held through defined-contribution retirement plans. It counts the company shares that households and nonprofit organizations hold directly or through mutual funds, life insurers and defined-contribution plans, looking through each fund to the company shares inside it. It leaves out the assets of traditional defined-benefit pension funds. Measured that way, shares were 34.0% of total assets at the end of June 2026. That is the highest in a series that starts in 1945, and above the 26.7% of early 2000.
The two percentages cannot be compared directly. The wider measure also covers nonprofits and draws the line around "shares" differently, so the gap between 34.0% and 31.4% is not the size of retirement holdings. What the two measures share is a record.
How sure the figures are
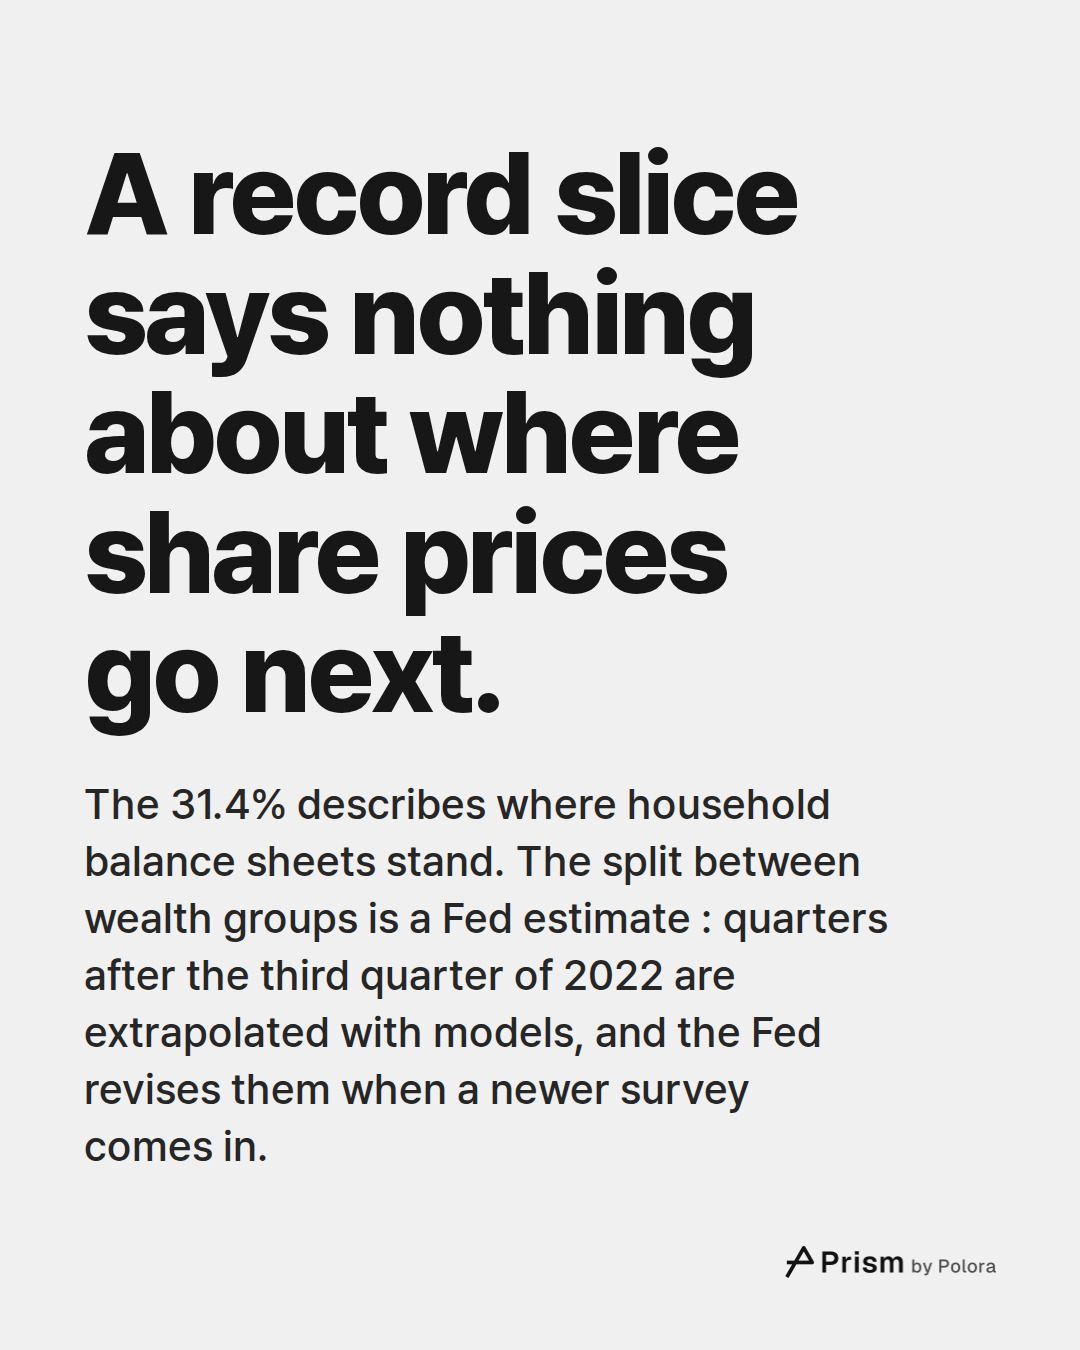
The totals for all households come from the Fed's Financial Accounts. The split between wealth groups is an estimate. The Fed allocates those totals using its Survey of Consumer Finances, which runs every three years, fills in the quarters between surveys, and models the quarters after the latest one. In its most recent note on the method, the Fed says quarters after the third quarter of 2022 are extrapolated with models. So the 2026 group shares are Fed estimates, and the Fed revises them when a newer survey comes in.
A record slice describes where household balance sheets stand. It says nothing about where share prices go next.
- Federal Reserve, Distributional Financial Accounts, download of levels by wealth group]
- FRED, Federal Reserve Bank of St. Louis: Share of Corporate Equities and Mutual Fund Shares Held by the Top 1% (data: Federal Reserve)]
- Federal Reserve, Distributional Financial Accounts overview]
- Federal Reserve, Distributional Financial Accounts announcements]
- Federal Reserve, Financial Accounts of the United States (Z.1), table S1M.e.b]
- Federal Reserve, Financial Accounts of the United States (Z.1), CSV files, September 11, 2026 release]
- FRED, Federal Reserve Bank of St. Louis: Households and Nonprofit Organizations; Directly and Indirectly Held Corporate Equities as a Percentage of Total Assets (data: Federal Reserve)]
- Federal Reserve, Open Market Operations: changes in the federal funds target range]
![Sources 8 : federalreserve.gov · Federal Reserve, Distributional Financial Accounts, download of levels by wealth group], fred.stlouisfed.org · FRED, Federal Reserve Bank of St. Louis: Share of Corporate Equities and Mutual Fund Shares Held by the Top 1% (data: Federal Reserve)], federalreserve.gov](https://media.cdn.polora.ai/picks/2026/11/pickrun_b71f5df74a0c40ee/pGRElZHmMvgiCMs--slide-07--how-much-of-us.jpg)