What the 8% yield on high-yield bonds is paying you for
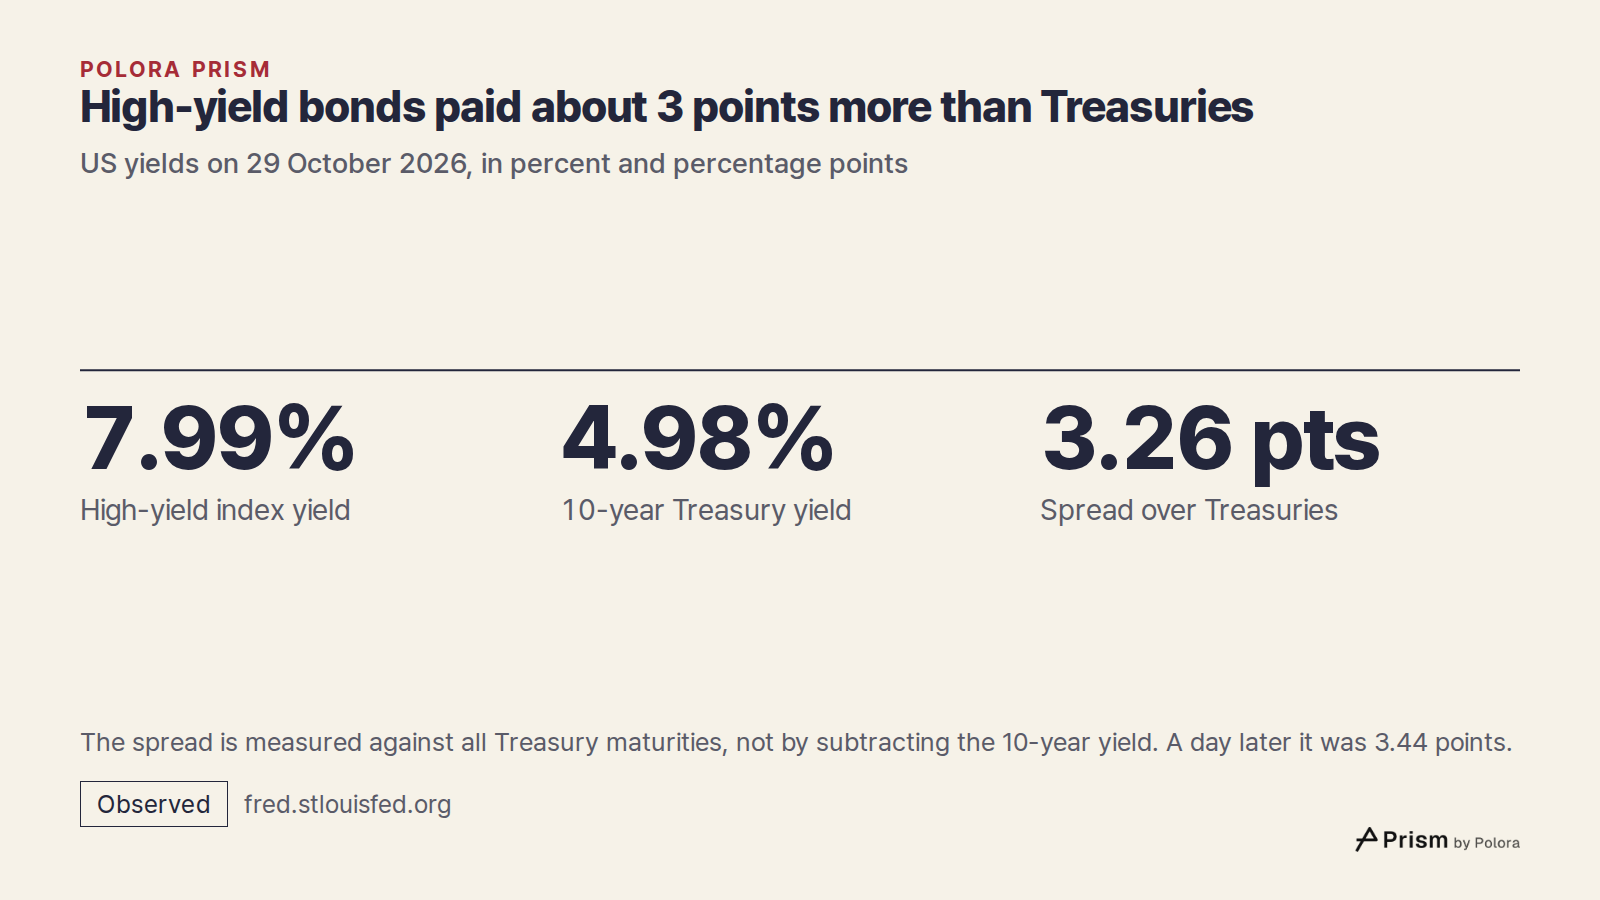
High-yield bonds, often called junk bonds, are loans to companies whose credit ratings sit below investment grade. On 29 October 2026 the ICE BofA US High Yield index, a broad basket of these bonds, had an effective yield of 7.99%. On the same day the 10-year US Treasury yielded 4.98%.
The gap is not a bonus for choosing well. Markets measure it as the spread, the extra yield over Treasuries. It is worked out against the whole range of Treasury maturities, not by subtracting the 10-year yield, and that day it was 3.26 percentage points. It is the price lenders charge for carrying the chance that some of these companies will not pay them back. The next day the spread was 3.44 points and the yield 8.14%, which shows how quickly the number on the screen moves.
So the yield is what the bonds pay if every borrower pays in full. Two things come off it before anything reaches an investor's pocket : the bonds that default, and tax.
How much of the extra yield defaults have taken in the past
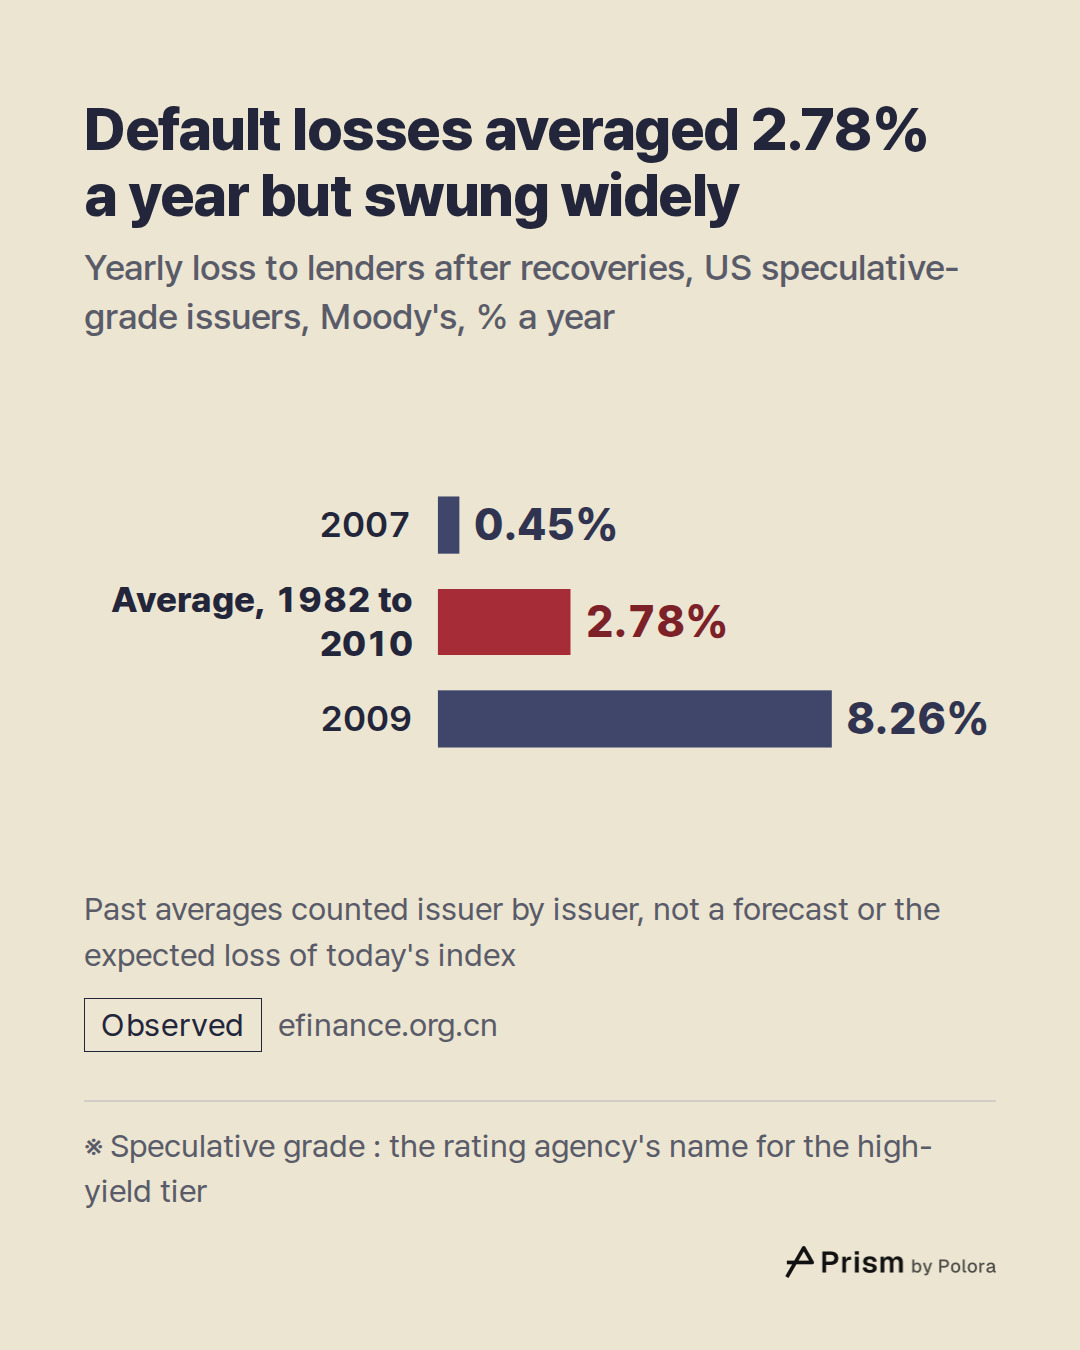
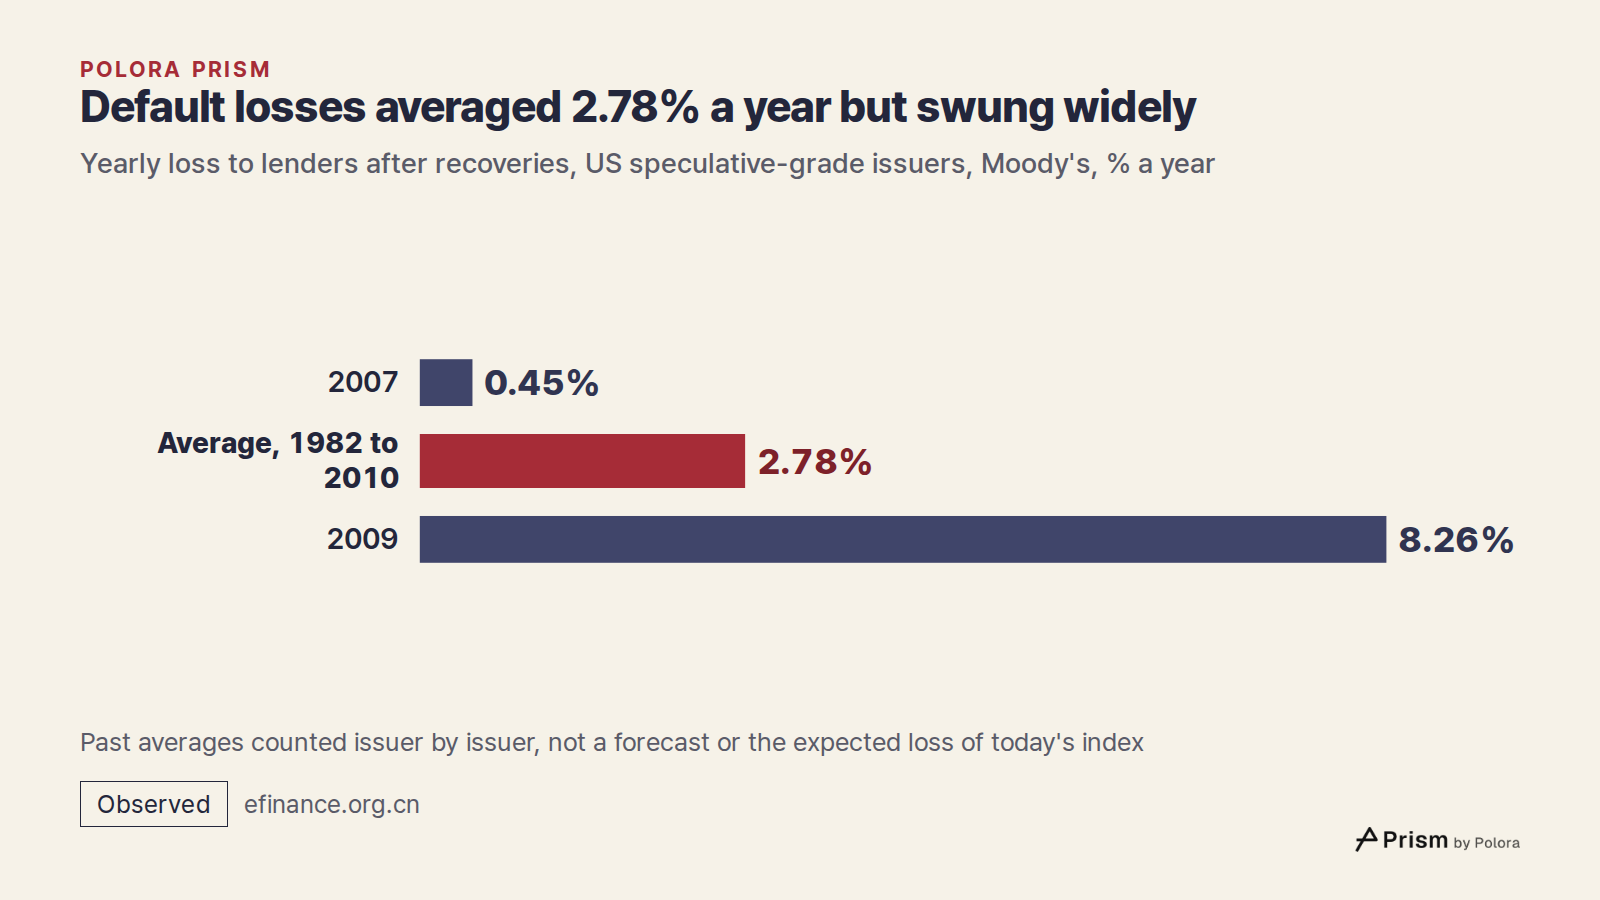
Defaults do not wipe out the whole bond. Lenders usually get part of their money back, so the loss is the default rate times what is not recovered. Moody's measured that combined loss directly. From 1982 to 2010, speculative-grade issuers, the rating agency's name for this tier, cost lenders an average of 2.78% a year after recoveries.
That average hides a wide range. The loss was 0.45% in 2007 and 8.26% in 2009. Moody's also found that recoveries are weakest in the years when defaults are most common. Senior unsecured bonds, which are backed by no specific assets, recovered 36.7% of face value on average over 1982 to 2010, judged by their price shortly after default.
A newer study from S&P Global Ratings, covering 1981 to 2024, puts the average yearly default rate for speculative-grade issuers in the US and tax havens at 4.10%. With roughly a third of face value recovered, that points to a loss of a similar size.
Set against a spread of about 3.3 points, a loss like the long-run average would take most of it. These are averages over past decades, counted company by company across rated issuers. They are not a forecast for the next year, and they are not the expected loss of today's index, which is weighted by bond size and leaves out bonds already in default. They describe the market as a whole, not any one fund or bond.
Why US tax takes more from bond interest than from stock gains
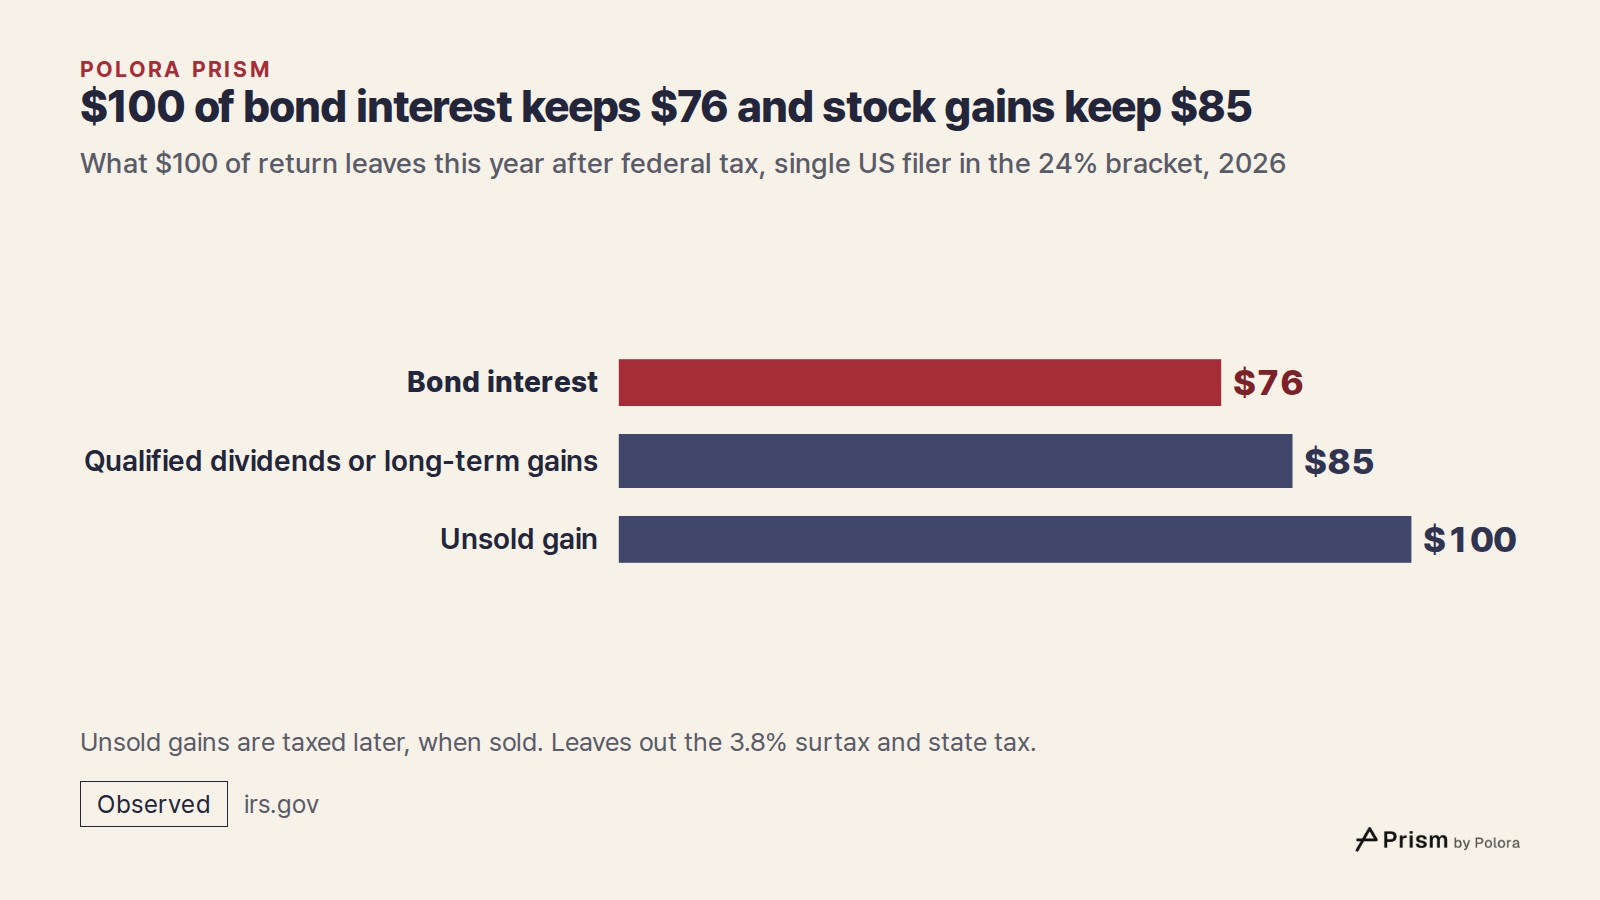
Almost all of what a high-yield bond pays arrives as interest, and US federal tax treats interest as ordinary income, taxed at the same rates as a salary. For 2026 those rates run from 10% to 37%. A single filer pays 24% on taxable income between $105,700 and $201,775.
Stocks pay mostly in two other forms. Qualified dividends and gains on shares held more than a year are taxed at 0%, 15% or 20%, and most middle and upper-middle earners pay 15%. A gain that is not yet sold is not taxed at all until the shares are sold.
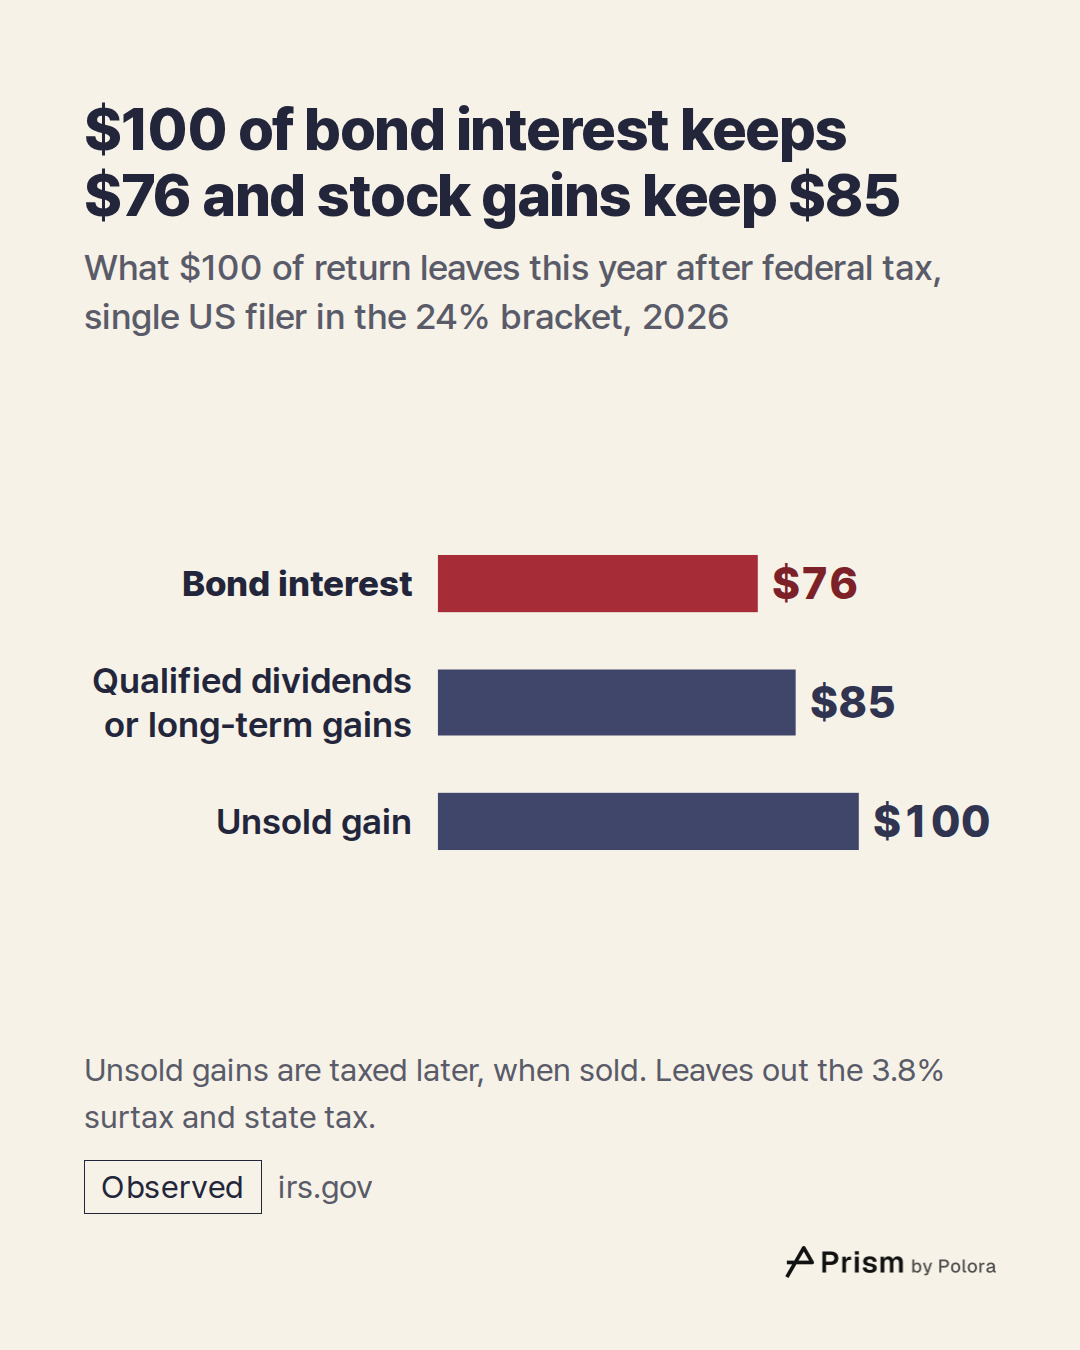
Put as $100 of return for that 24% filer : $100 of bond interest leaves $76 after federal tax. $100 of qualified dividends or long-term gains leaves $85. $100 of unsold gain leaves $100 this year, with the tax deferred.
Two more layers sit on top. Above $200,000 of modified adjusted gross income for a single filer, or $250,000 for a married couple filing jointly, a 3.8% net investment income tax applies to interest and gains alike. Most US states also tax corporate bond interest, while interest on US Treasuries is exempt from state and local income tax.
One worked example : what is left after defaults and tax
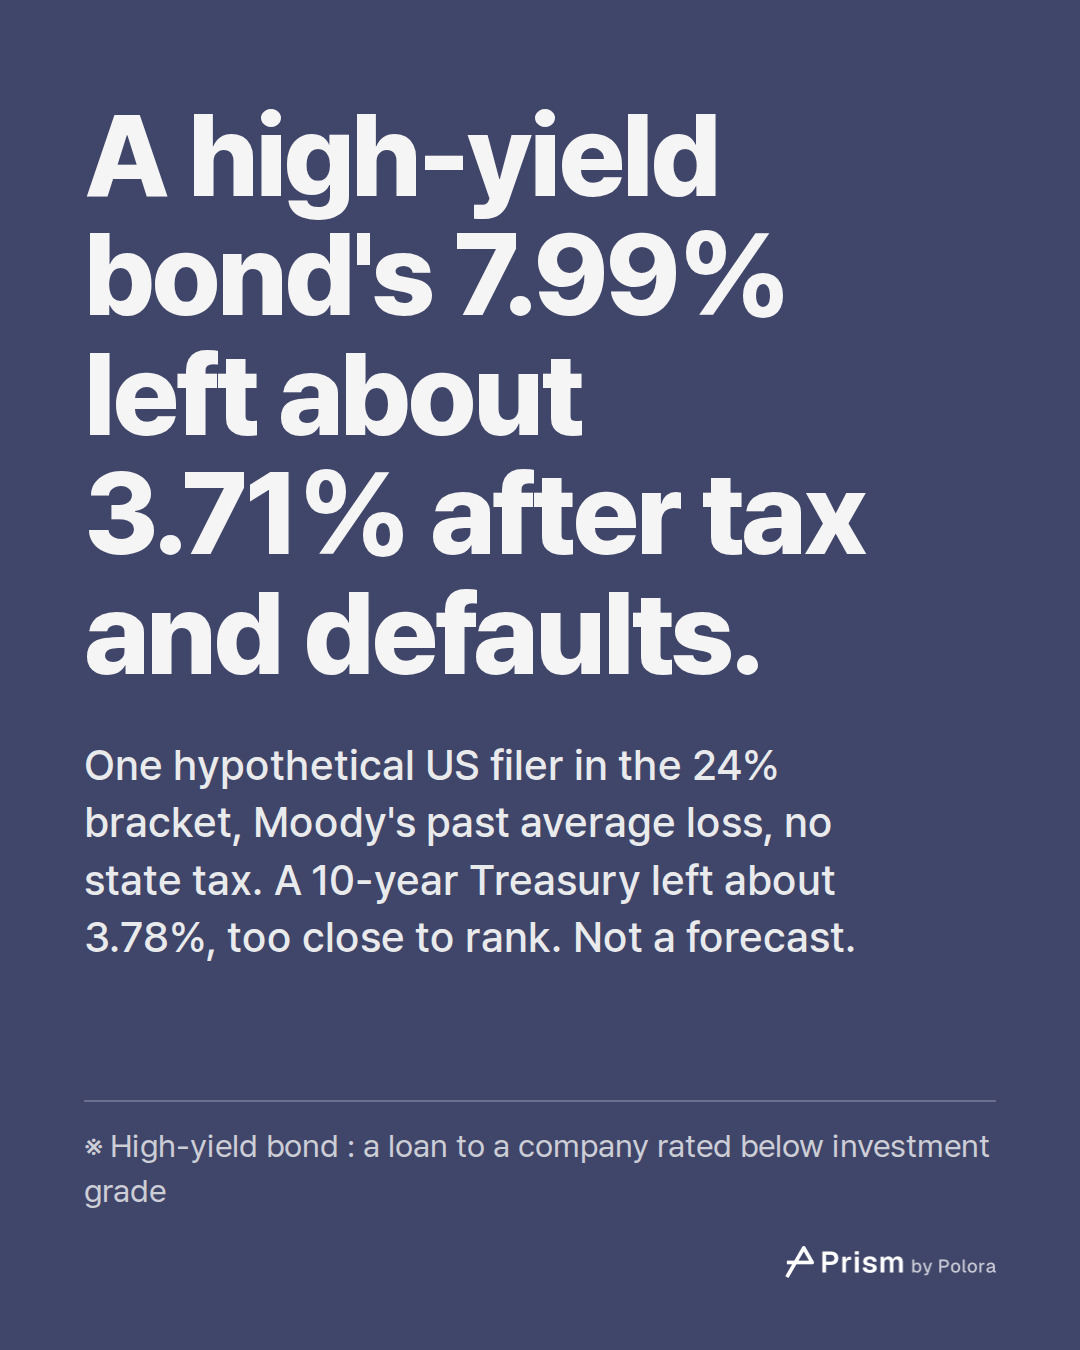
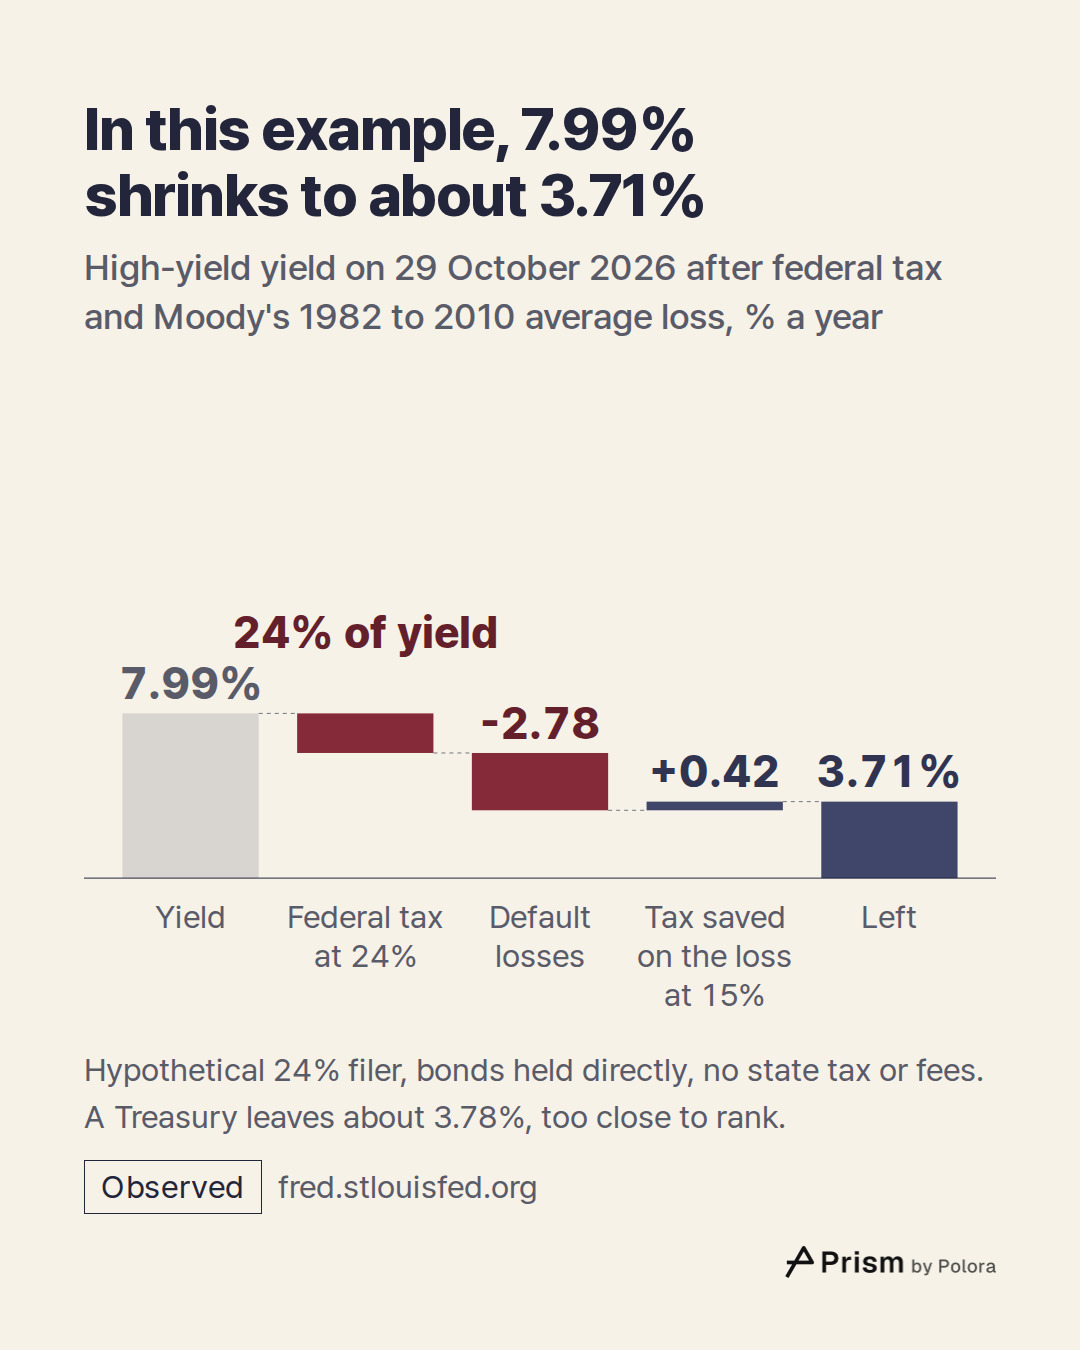
Take one hypothetical investor : a single US filer in the 24% federal bracket for 2026, below the 3.8% surtax threshold, holding bonds directly in an ordinary taxable account, with state tax left out. Use the 29 October 2026 yields and suppose losses matched Moody's 1982 to 2010 average and were realized in the same year, offsetting other long-term gains. Ignore price changes and fees.
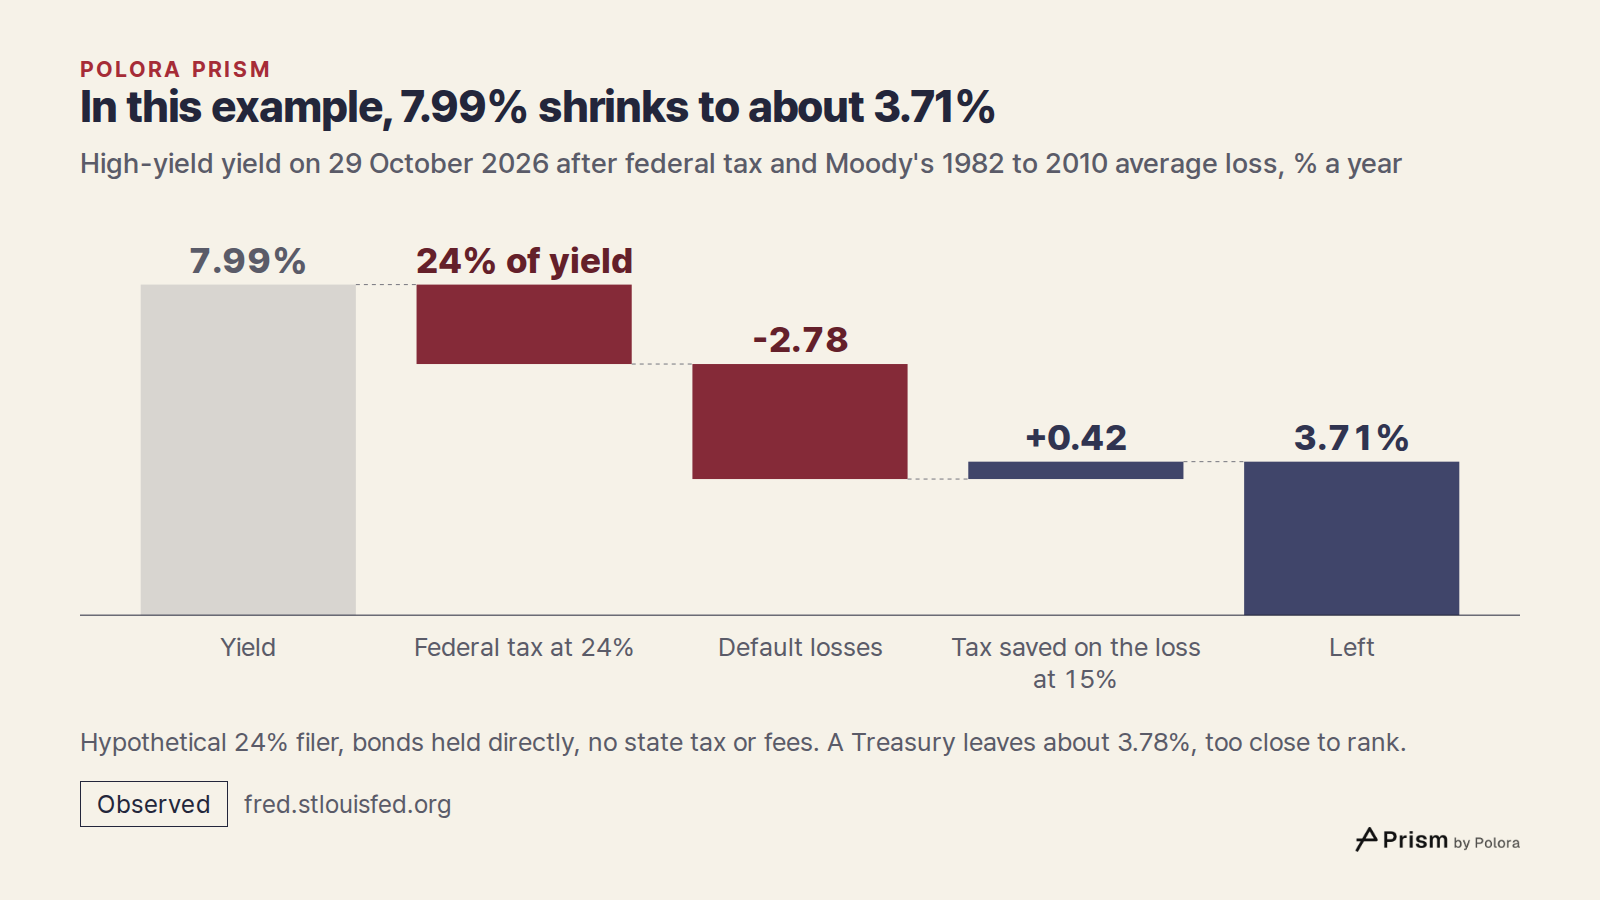
High-yield bonds pay 7.99%. Federal tax takes 24% of that, leaving 6.07%. Defaults then take 2.78%. If that loss offsets other long-term gains taxed at 15%, it saves 0.42 points of tax, so the net loss is 2.36 points. What is left is about 3.71%.
The 10-year Treasury pays 4.98%. Federal tax takes 24%, leaving about 3.78%, and no state tax applies.
Before tax, the high-yield side kept an edge after losses : 5.21% against 4.98%. After tax, in this example, the two end up within 0.07 percentage point of each other. A gap that small cannot say which one pays more. What the example shows is how much of the edge on the screen defaults and tax can take, not a ranking. State tax on the corporate interest would tilt it further toward the Treasury.
The example also puts unlike measures side by side. It subtracts a historical loss averaged across issuers from the yield of today's index, and it compares that index with a 10-year Treasury although the two are not matched in maturity. It assumes the loss is realized at once and offsets gains taxed at 15%. An investor with no gains to offset could deduct only $3,000 a year against income and carry the rest forward, which would leave less. A lower bracket, a year with fewer defaults, a tax-advantaged account, or a fund instead of single bonds would each change the answer. This is one set of numbers built to show the mechanism, not anyone's own result and not a forecast.
- ICE BofA US High Yield Index Effective Yield (FRED)
- Market Yield on US Treasury Securities at 10-Year Constant Maturity (FRED)
- IRS, 2026 tax year inflation adjustments
- Moody's, Corporate Default and Recovery Rates, 1920-2010
- Copy of Moody's February 2011 default study (North Dakota Legislature)
- IRS Topic 409, Capital gains and losses
Why a default loss is not taxed the way the interest is
In the example the interest was taxed at 24%, but the loss saved tax at only 15%. That gap is built into US rules. Interest is ordinary income and is taxed in full every year. A bond that becomes wholly worthless generally counts as a capital loss, not a bad-debt deduction, and capital losses first offset capital gains. Only $3,000 a year of net capital loss, or $1,500 for a married person filing separately, can reduce ordinary income ; the rest is carried to later years. When a default turns into a loss that can be deducted, and how large it is, depends on the bond and the timing, so the relief can arrive later than the tax on the interest, as well as at a lower rate.
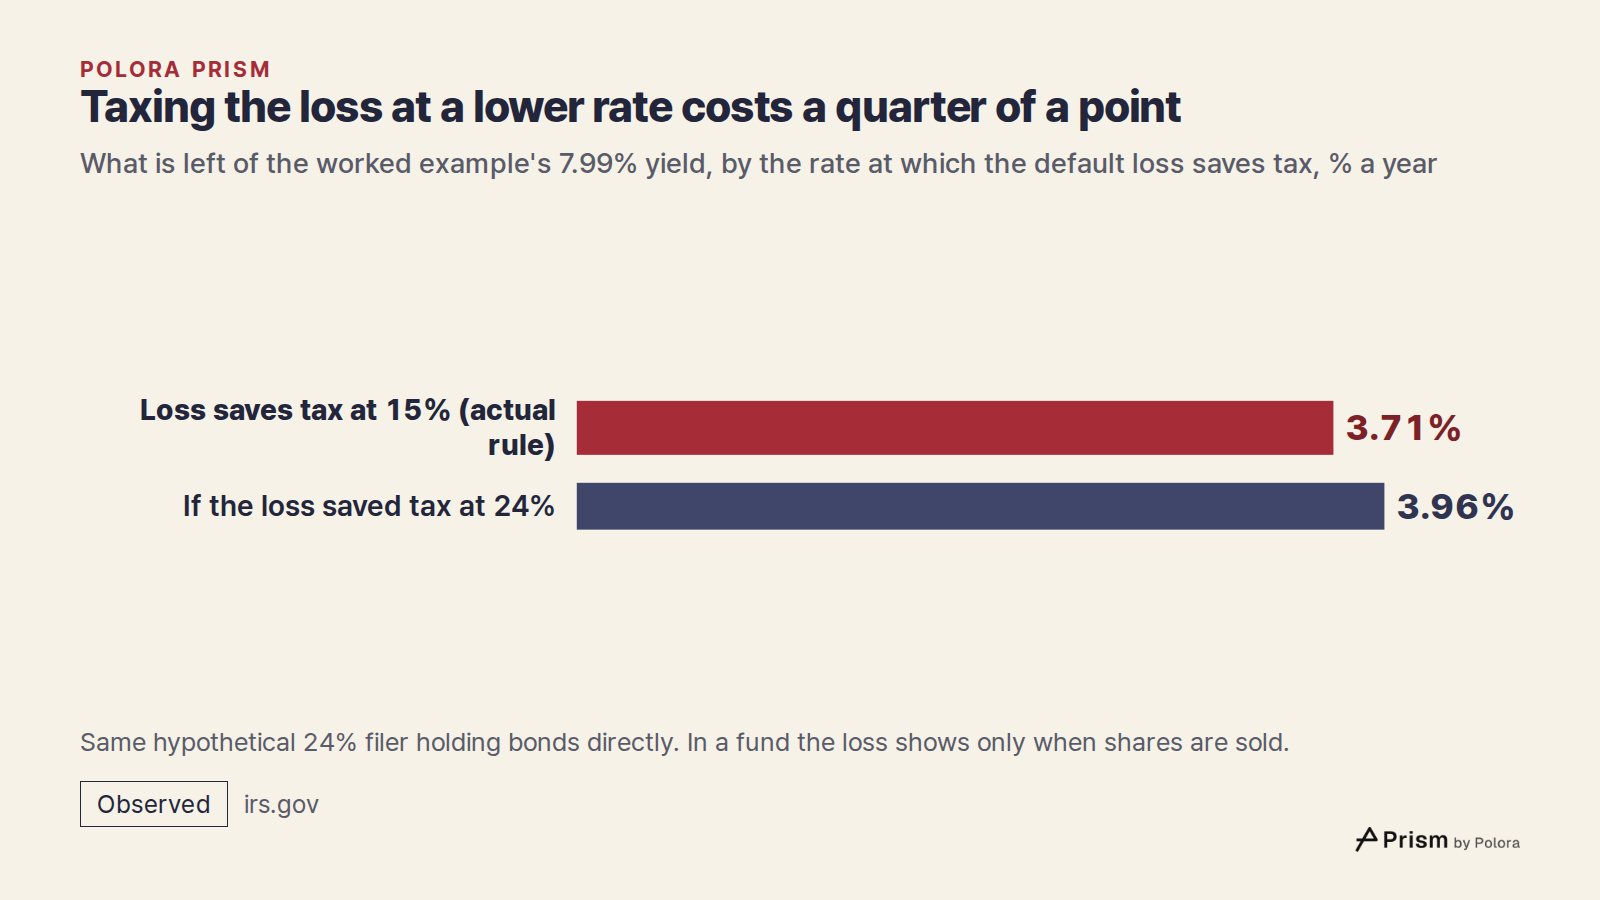
If the loss had counted against income at the same 24% rate as the interest, about 3.96% would have been left instead of 3.71%. The quarter of a point between those two figures is the asymmetry : the tax code counts the interest and the loss that offsets it in different currencies.
Holding the bonds through a fund changes how this shows up, though not the underlying economics. A fund passes its interest out as taxable distributions, while a default shows up as a lower share price. The investor realizes that loss only when the shares are sold, and only if they are sold below what was paid, so the example's same-year relief at 15% describes a bond held directly.
The type of account matters as much as the asset. In a US tax-advantaged retirement account, interest is not taxed year by year, so the gap between interest and gains described here largely disappears inside it. Withdrawals are taxed differently in traditional and Roth accounts, which this article does not cover. That is a description of how the rules work, not a view on where anyone should hold anything.
These are US rules ; Korea and Japan tax bond interest differently
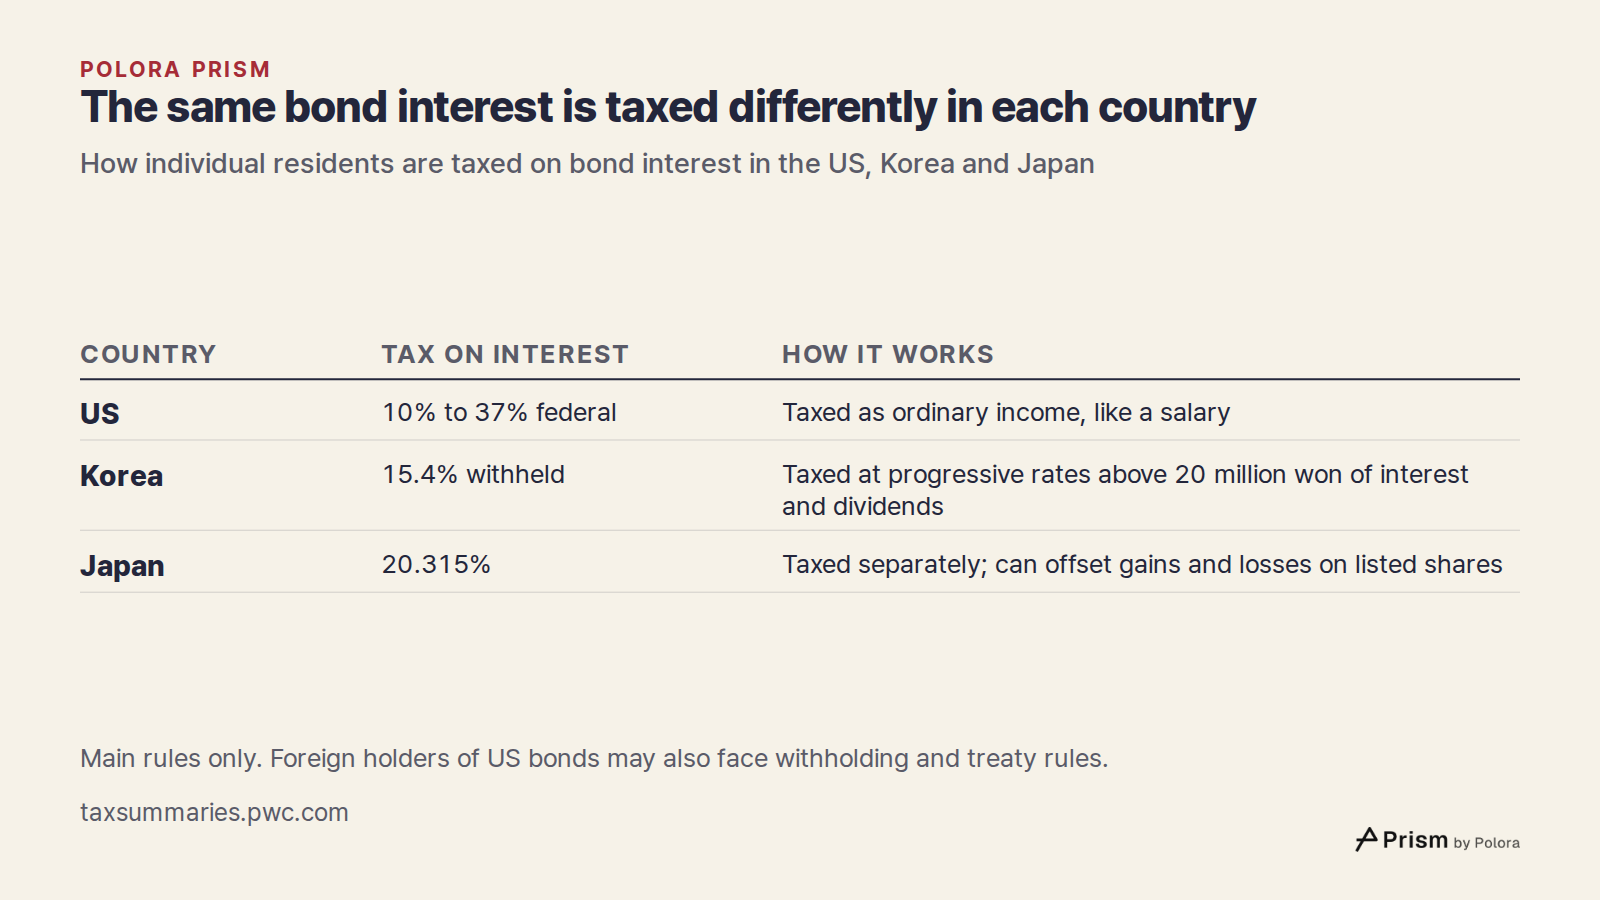
Everything above describes one country. A resident of Korea generally has 15.4% withheld from interest, including local tax. Once a year's interest and dividends together exceed 20 million won, that income is taxed with the person's other income at progressive rates.
Japan taxes interest on most publicly offered and listed bonds separately from other income, at 20.315% including national, reconstruction and local tax. Under that system, gains and losses on those bonds and on listed shares can be set against each other.
So the same bond can leave very different amounts in different countries, and an investor abroad who holds US bonds may also face withholding and treaty rules not covered here.
Do high-yield bonds fall when stocks fall?
The common case for these bonds is that they spread risk. The data say they have mostly moved with stocks. Correlation measures how closely two things move together, from 1 for in step to -1 for opposite. Using Morningstar data to the end of 2025, Madison Investments found the ICE BofA US High Yield index had a correlation with the S&P 500 of 0.83 over five years, 0.80 over ten and 0.75 over twenty. For a 1-to-10-year Treasury index the same figures were 0.47, 0.11 and -0.09.
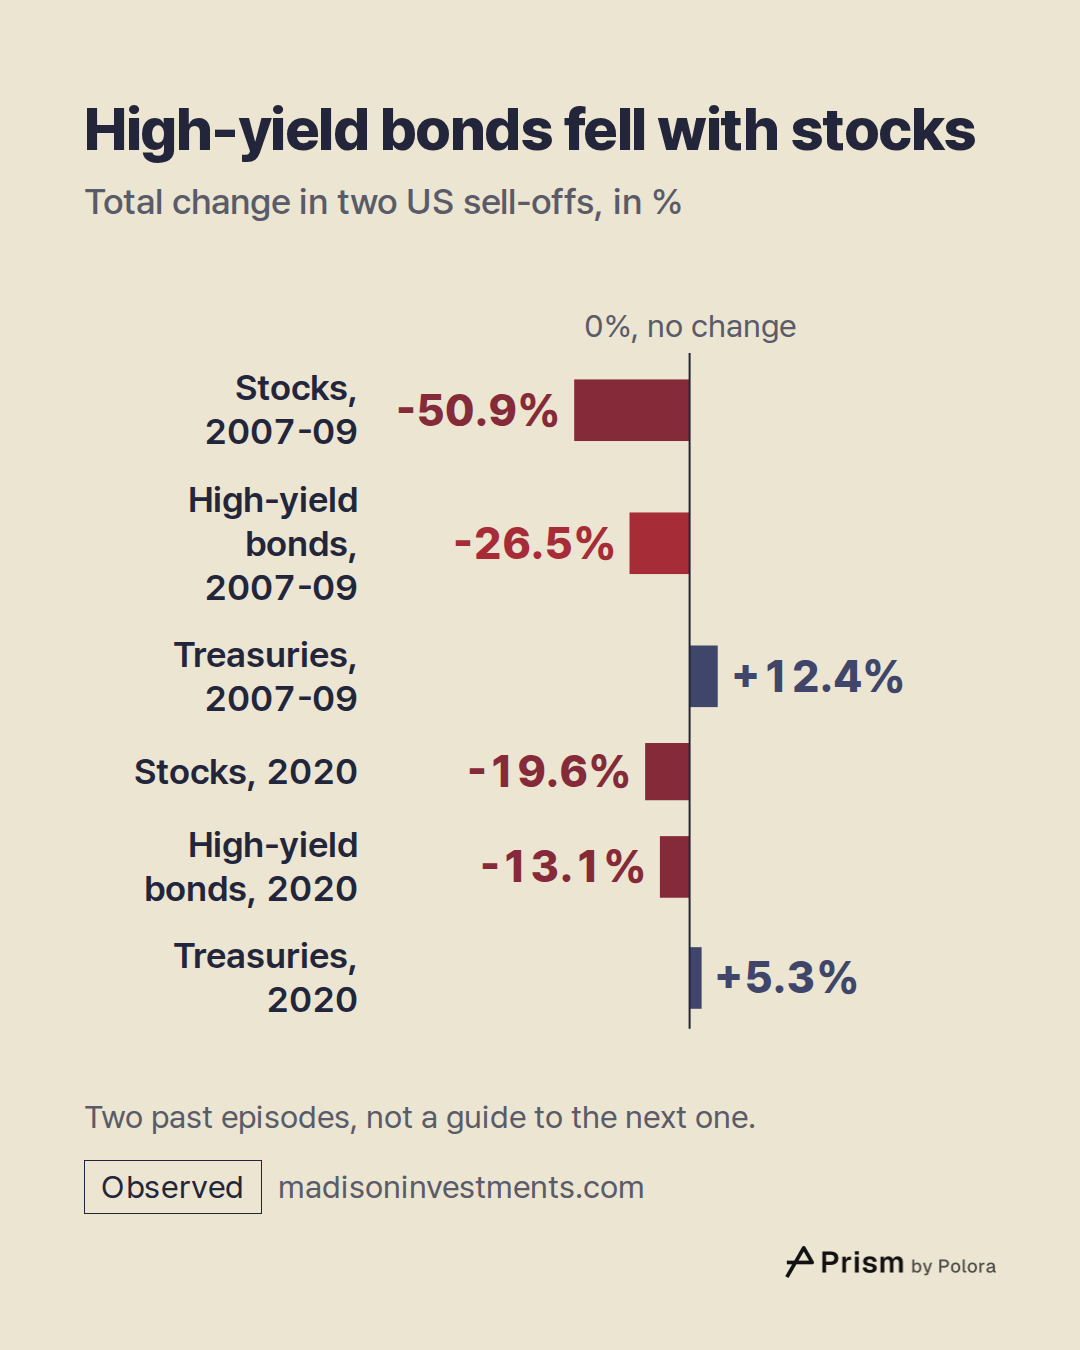
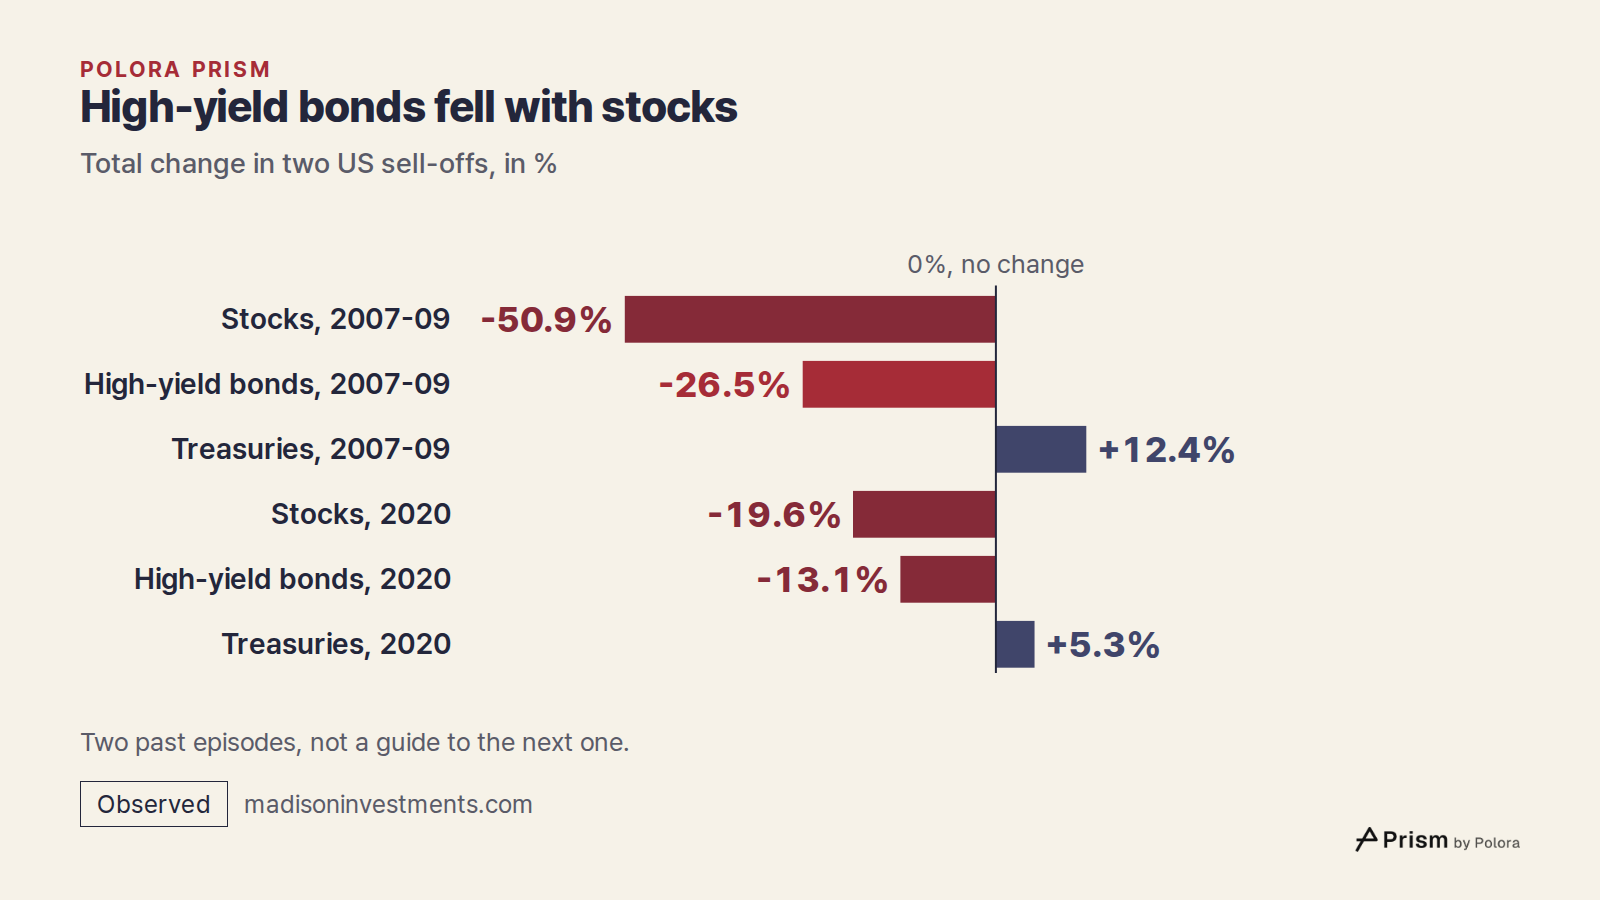
Sell-offs are where it showed most. From November 2007 to February 2009, US stocks fell 50.9% and high-yield bonds 26.5%, while Treasuries gained 12.4%. From January to March 2020, stocks fell 19.6%, high-yield bonds 13.1%, and Treasuries gained 5.3%.
Build Asset Management, measuring with Bloomberg's high-yield index, put the correlation with the S&P 500 at 0.61 since 1983 but at 0.73, 0.83 and 0.86 during the sell-offs of 2007 to 2009, early 2020 and the one that began in December 2021. In 2022, Madison notes, lower-quality bonds fell by double digits alongside stocks.
High-yield bonds fell less than stocks in each of these episodes, and falling less is still some diversification. But they fell, at the moments a cushion for stocks is meant to hold up, so these figures give no ground for counting on them as one.
What high-yield bonds spread, and why the answer depends on the years you pick
Because a high-yield bond's price depends as much on whether the company pays as on interest rates, it is often said to move only loosely with Treasuries. If so, what it spreads is mainly the risk of rising rates, rather than the risk of falling stocks. None of the sources here measures high-yield returns against Treasury returns directly, so how much of the diversification lies there remains an open question in this article.
The latest three years show how much the window matters. In a calculation made for this article from FRED monthly data, December 2023 to October 2026, the high-yield total return index moved with the S&P 500 at a correlation of 0.67, and with investment-grade corporate bonds at 0.82. The S&P 500 series used here is the price index, which leaves out dividends. Against the monthly change in the 10-year Treasury yield, the high-yield index came out at -0.69, meaning it tended to rise when rates fell. That is a link to rate moves, not the same thing as a correlation with Treasury returns. It covers only 35 months in a calm market, and another window could look different.
This is why portfolio tools disagree. An optimizer that sees the pre-tax yield, a calm-period correlation of 0.67 and no stress years will give these bonds a larger role than one fed after-tax, after-loss returns and correlations measured in 2008 or 2020. Neither answer is the bond's permanent nature ; each is a statement about the inputs, the period and the assumptions chosen.
The yield on the screen is where the arithmetic starts. What remains depends on defaults, on who pays tax and where, and on which years you take as normal.