Two pools of money, counted two ways
Venture capital funds and initial public offerings (IPOs) are two big ways money reaches growing companies. A venture fund collects money from investors and puts it into young private businesses in exchange for a stake. An IPO is when a company first sells shares to the public on a stock exchange.
The two are linked. The SEC's small-business glossary says venture investments have a long time horizon and are generally locked in until a "liquidity event", such as an acquisition or an IPO, when the fund and its investors hope to realise a profit.
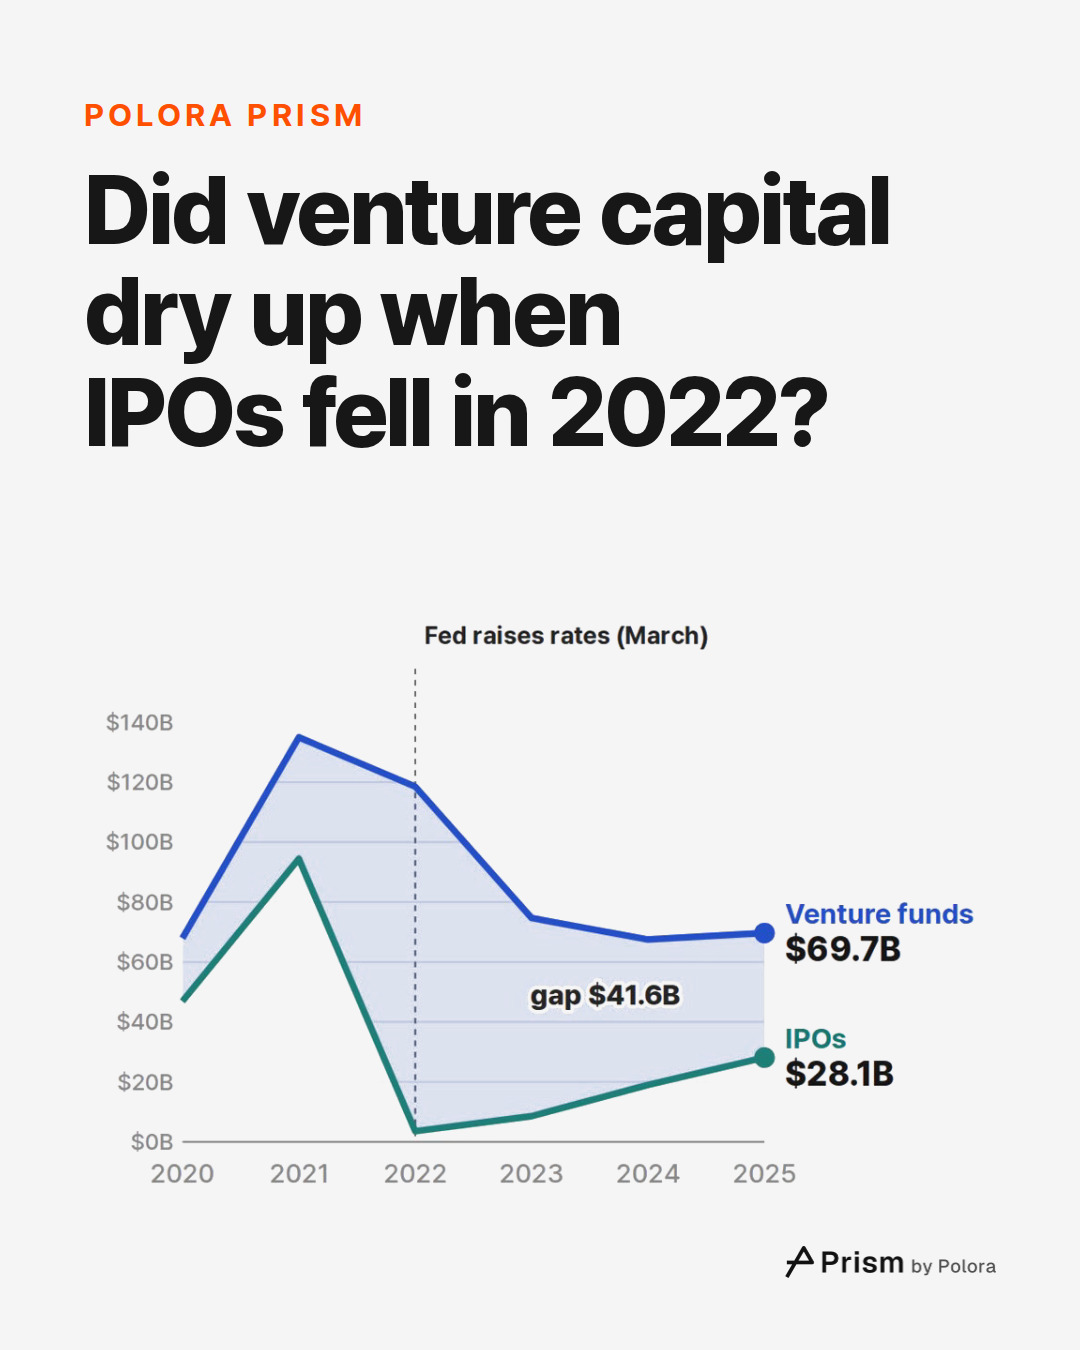
The film that goes with this piece draws one line for each. They are not the same kind of money, and neither is complete, so it helps to know what each one counts.
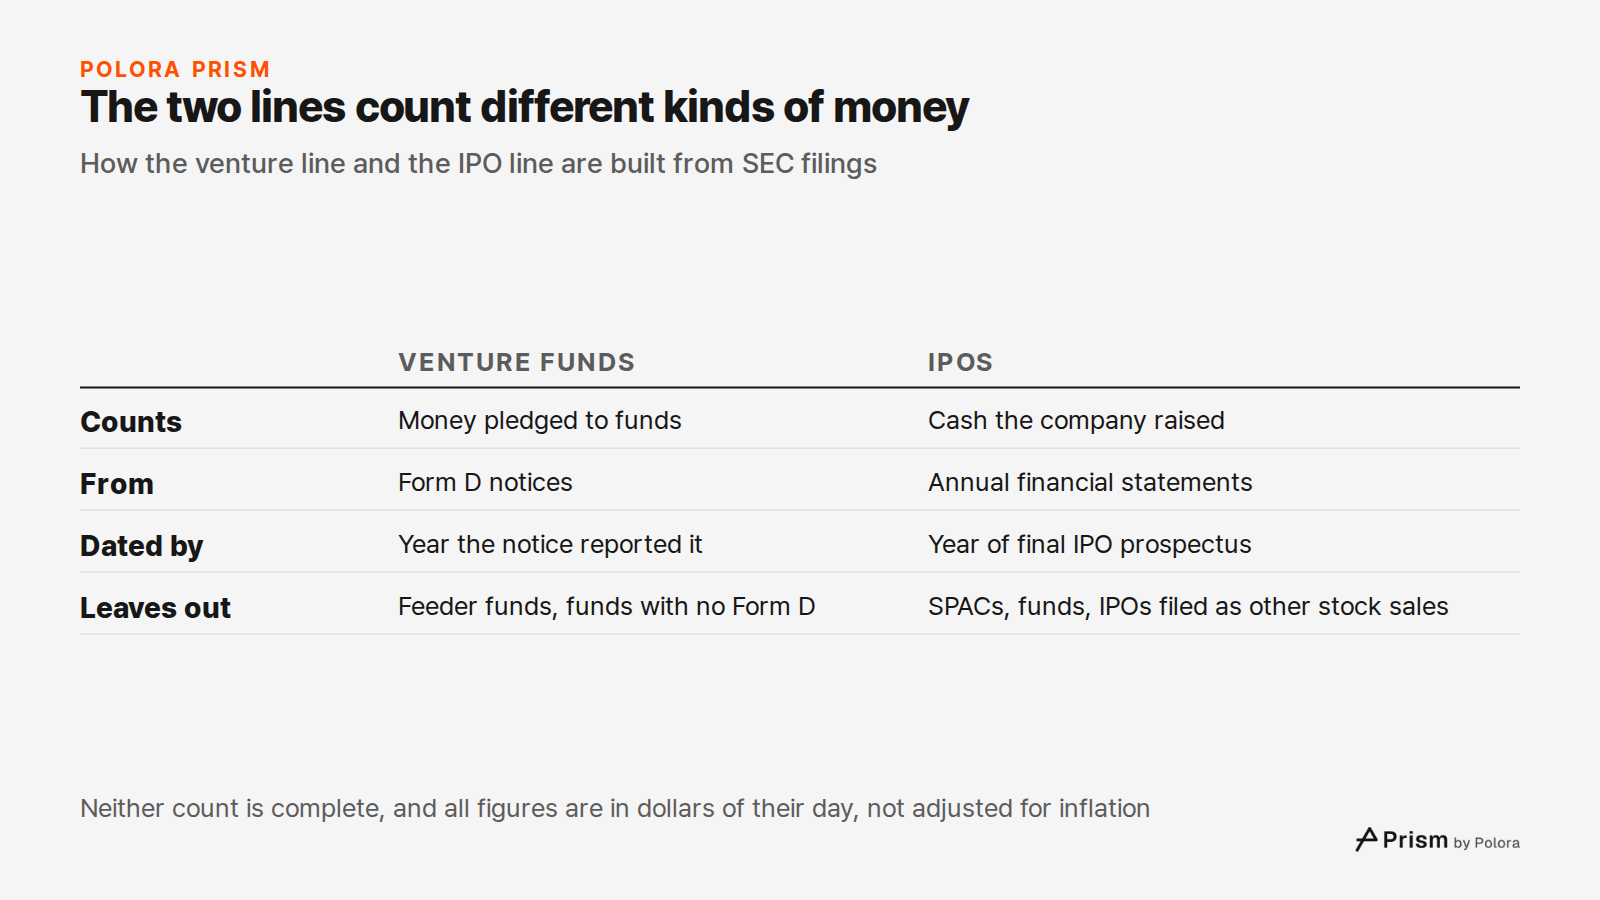
The venture line comes from Form D, a short notice that a fund files with the SEC when it sells interests to investors without a registered public offering. The SEC publishes these notices as data sets. The line adds up funds that ticked the "venture capital fund" box, and credits each year with the increase in amount sold that their notices reported during that year, later amendments included. Feeder funds that only pass money to another fund are left out, and so is the Sequoia Capital Fund, which Sequoia describes as an open-ended portfolio made up of public positions that in turn allocates money to venture sub-funds. For Form D, a sale happens when an investor is irrevocably committed to invest, which is why the film says "pledged" : this is money promised to funds, not money invested in companies that year. Funds that tick another box, or raise money without filing a Form D, are not in it.
The IPO line is the cash a company itself raised in its IPO, as reported in its annual financial statements, which the SEC publishes as structured data. Each company is counted in the year of its final IPO prospectus. Blank-check companies (SPACs) and investment funds are left out. Foreign companies that list in the US and file these statements are in. The figures are mostly after underwriting fees, though companies treat costs differently, and they leave out shares sold by existing owners at the same time. The count misses IPOs that a company reported under a general stock-sale line instead, and companies that report under international accounting standards.
So the film compares pledges with cash, dated in slightly different ways, and both are incomplete. All figures are in dollars of their day, not adjusted for inflation.
2020–2021 : both booming
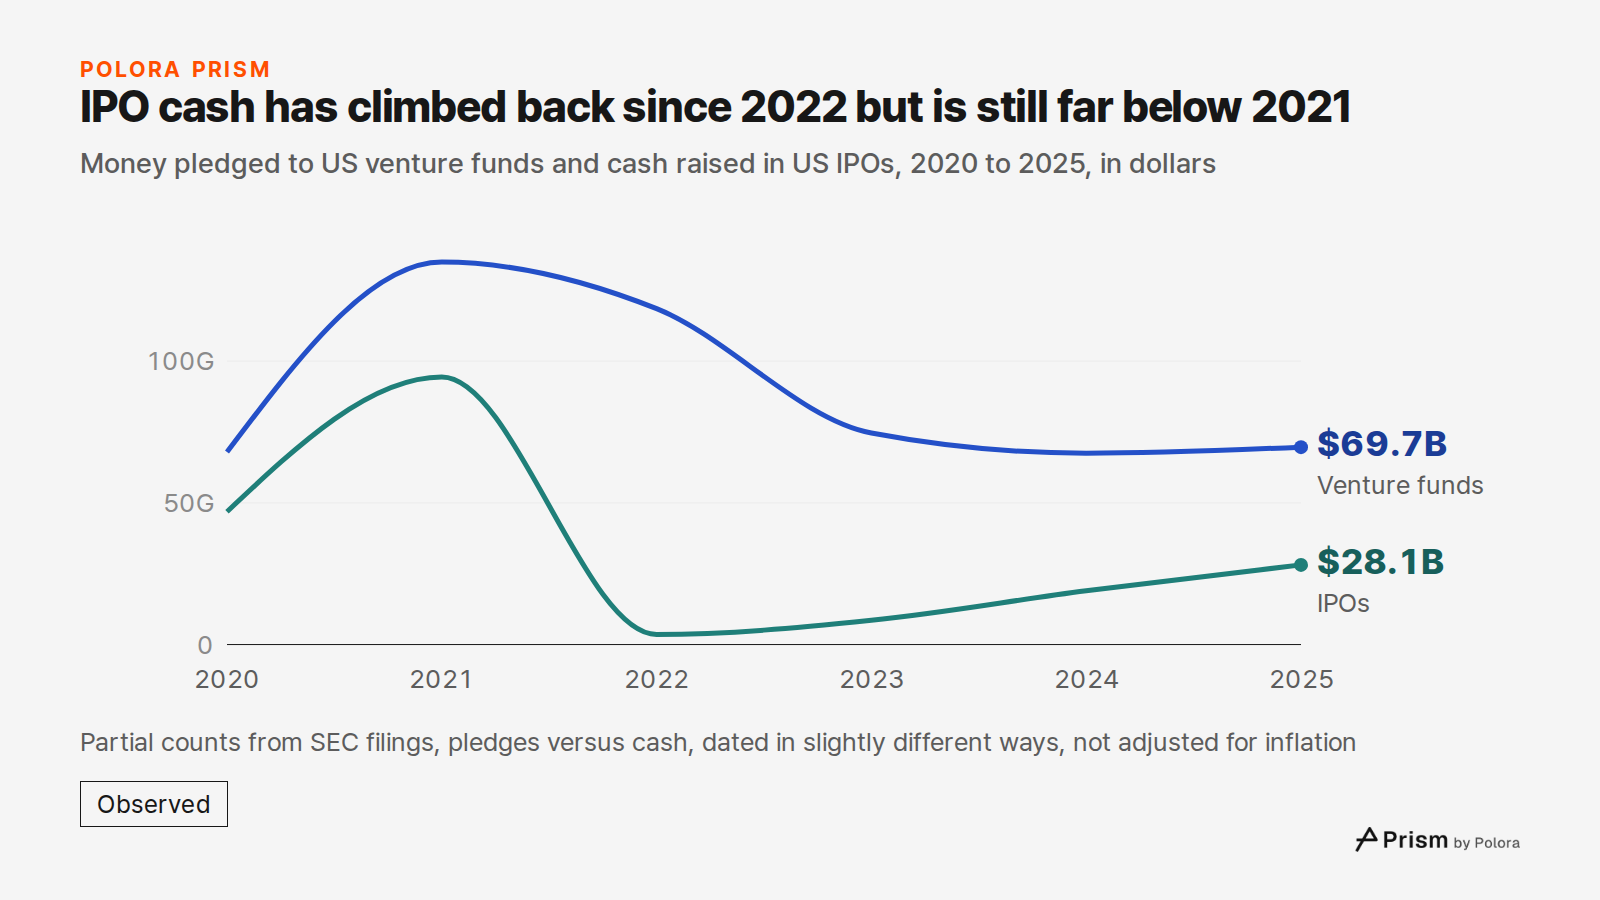
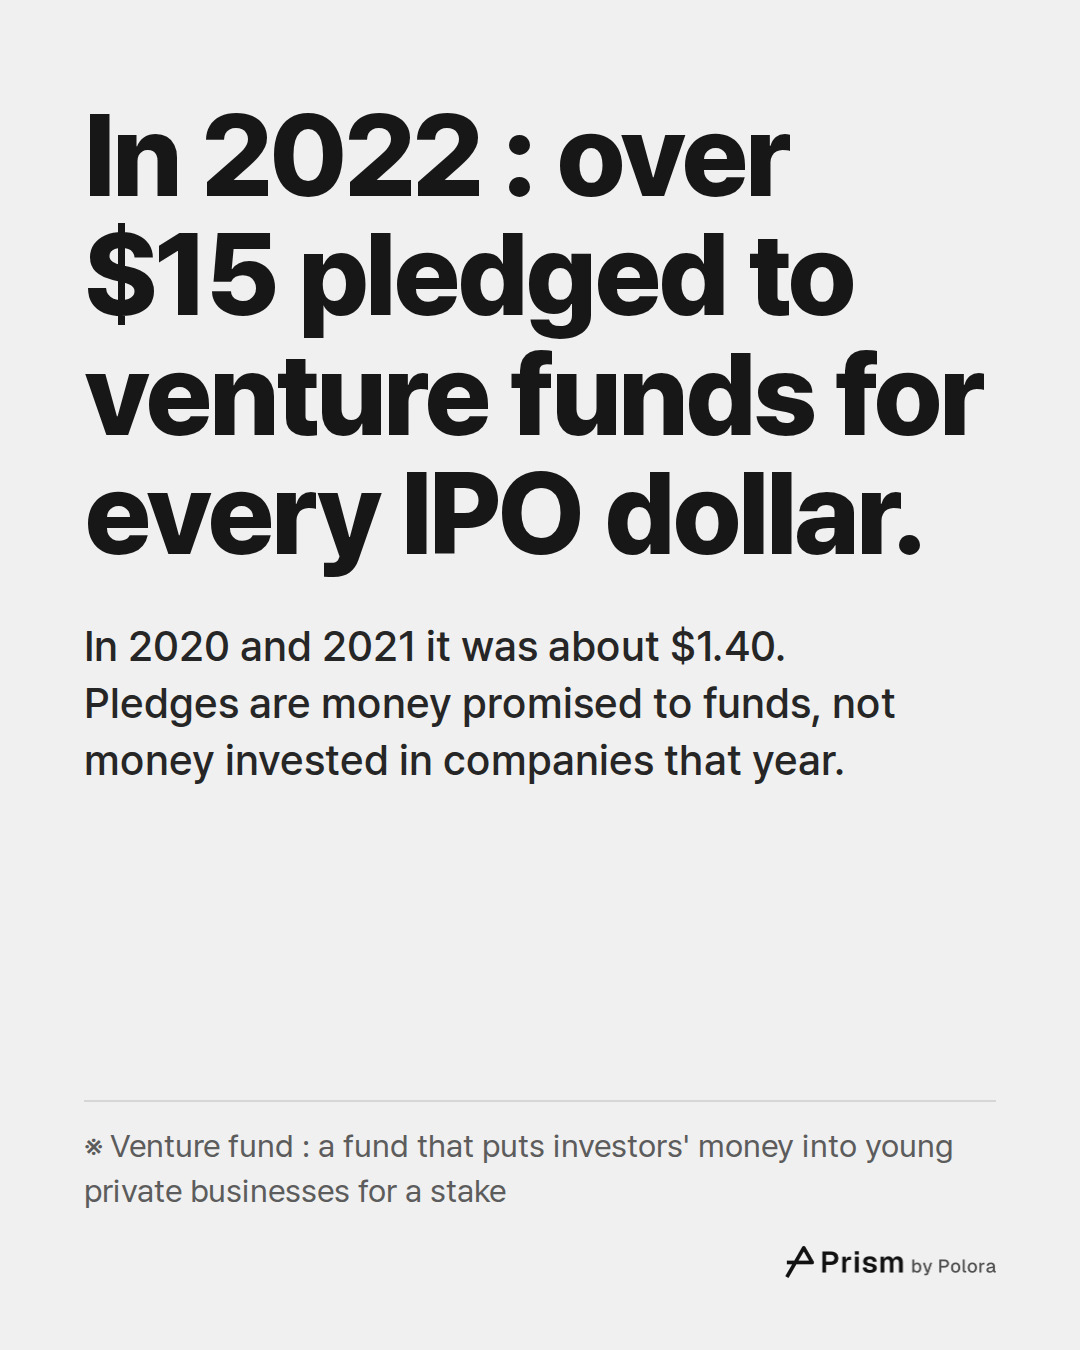
In 2020 venture funds were pledged $67.9B and IPOs raised $46.9B on this count. In 2021 both roughly doubled, to $134.9B and $94.4B. In both years venture funds were ahead, at about $1.40 for every IPO dollar. 2021 was the high point of both lines in the years shown, which is worth keeping in mind : the fall that followed is measured from an exceptional year.
2022 : IPO cash collapses, the funds keep raising
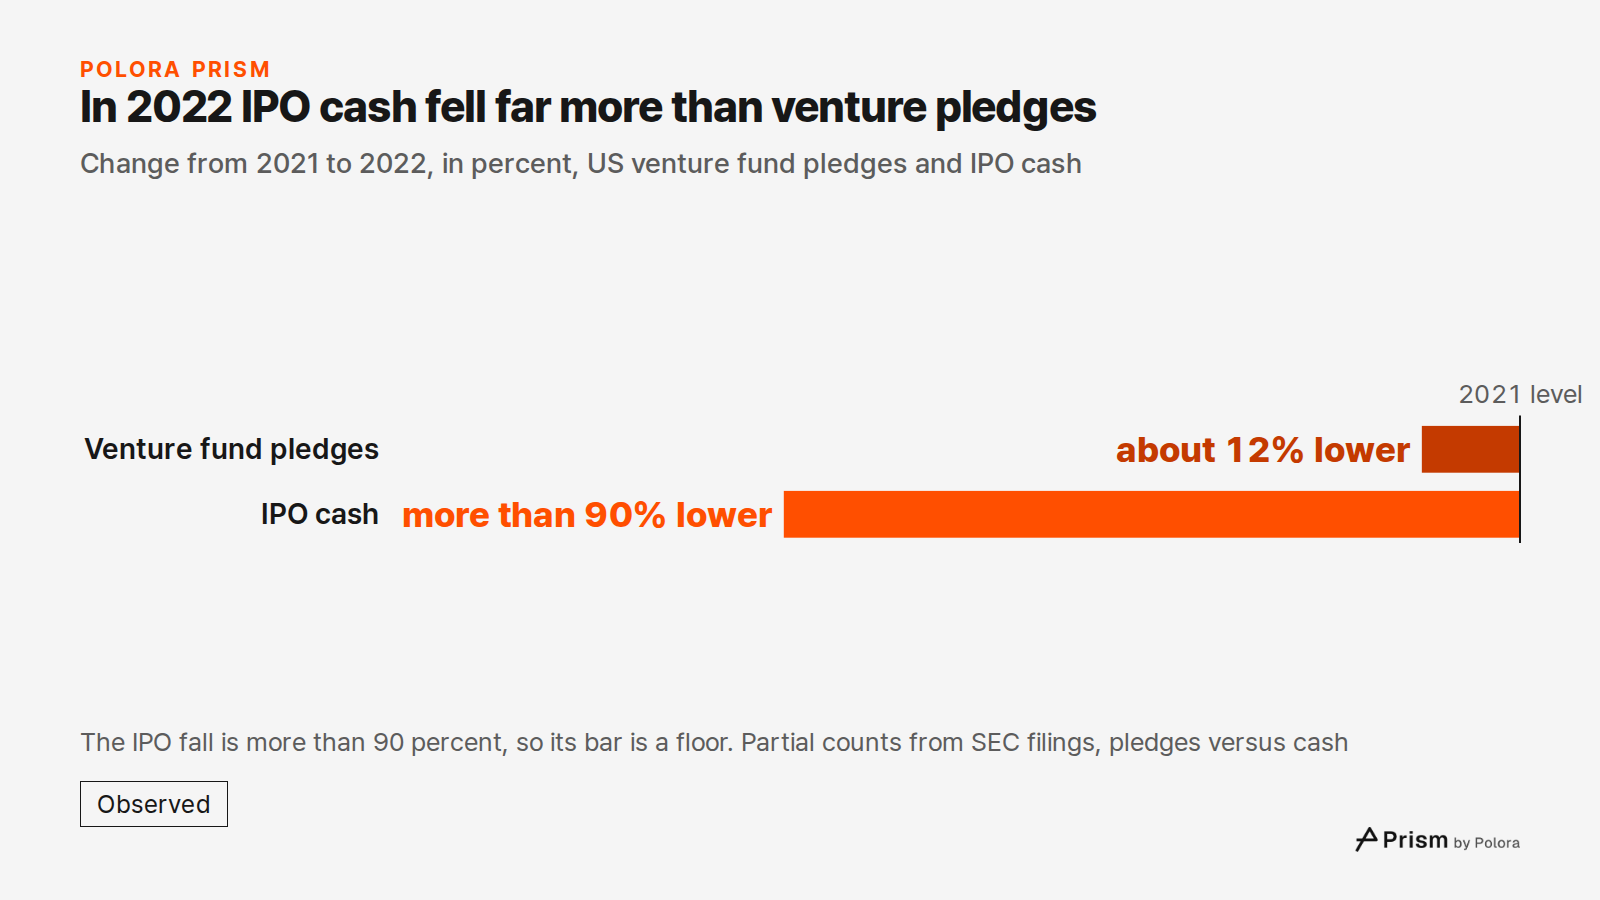
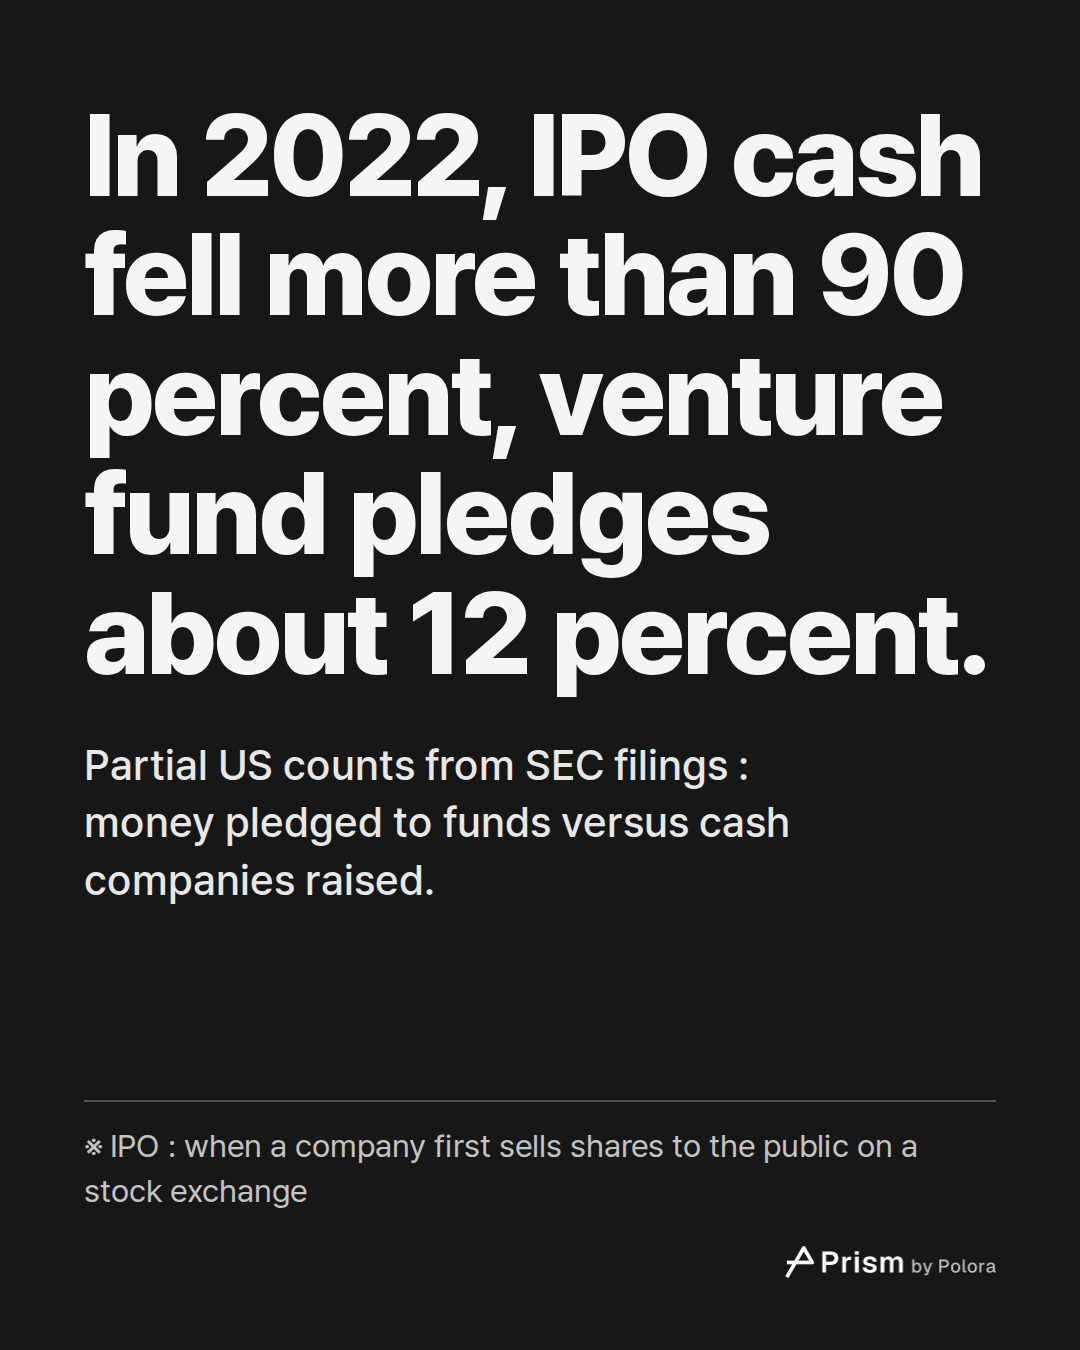
In 2022 IPO cash on this count fell by more than 90 percent from 2021. Four companies that went public in 2022 (Excelerate Energy, ProFrac, Ivanhoe Electric and Arcellx) reported their stock sales under a general stock-sale line instead, about $1.0B between them, and even with that added back the fall is still more than 95 percent. That line covers all the common stock a company sold in its year, so it can include more than the IPO.
Venture funds, meanwhile, were pledged $118.5B, about 12 percent less than in 2021. That is over $15 pledged to venture funds for every IPO dollar. The film says "over $15" rather than a single figure on purpose. On the IPO count as drawn it is about $33; with the four missed IPOs added it is about $26; listings the count still misses would lower it further, by an amount this data cannot show. Both calculations stay well above $15.
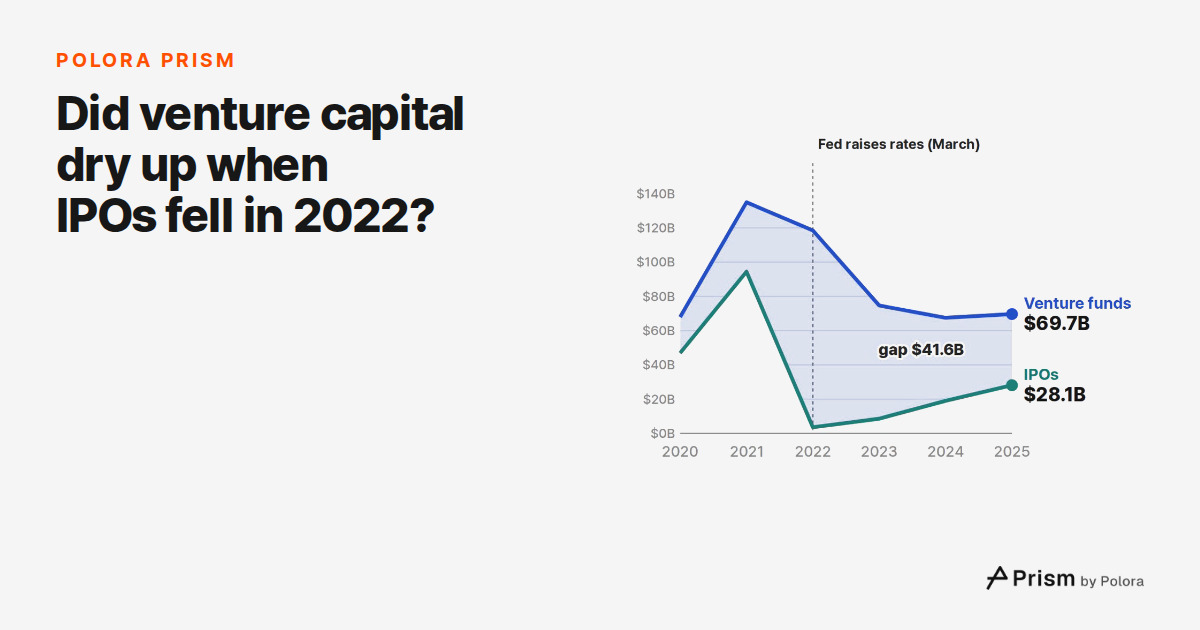
In March 2022, the Federal Reserve raised its target range for the federal funds rate and said further increases would be appropriate. The film marks that date for context. Neither the yearly data nor the sources here show that it caused the drop in IPOs.
The contrast matters because of how venture money gets out. The SEC glossary says venture investments are usually locked in until an event such as a sale of the company or its IPO. In 2022 companies raised very little IPO cash, while funds were still being promised money to invest. This piece's data counts dollars raised; it does not identify which listed companies were venture-backed, measure exits or show how long investors waited for them.
2023–2025 : IPOs climb back, venture pledges settle
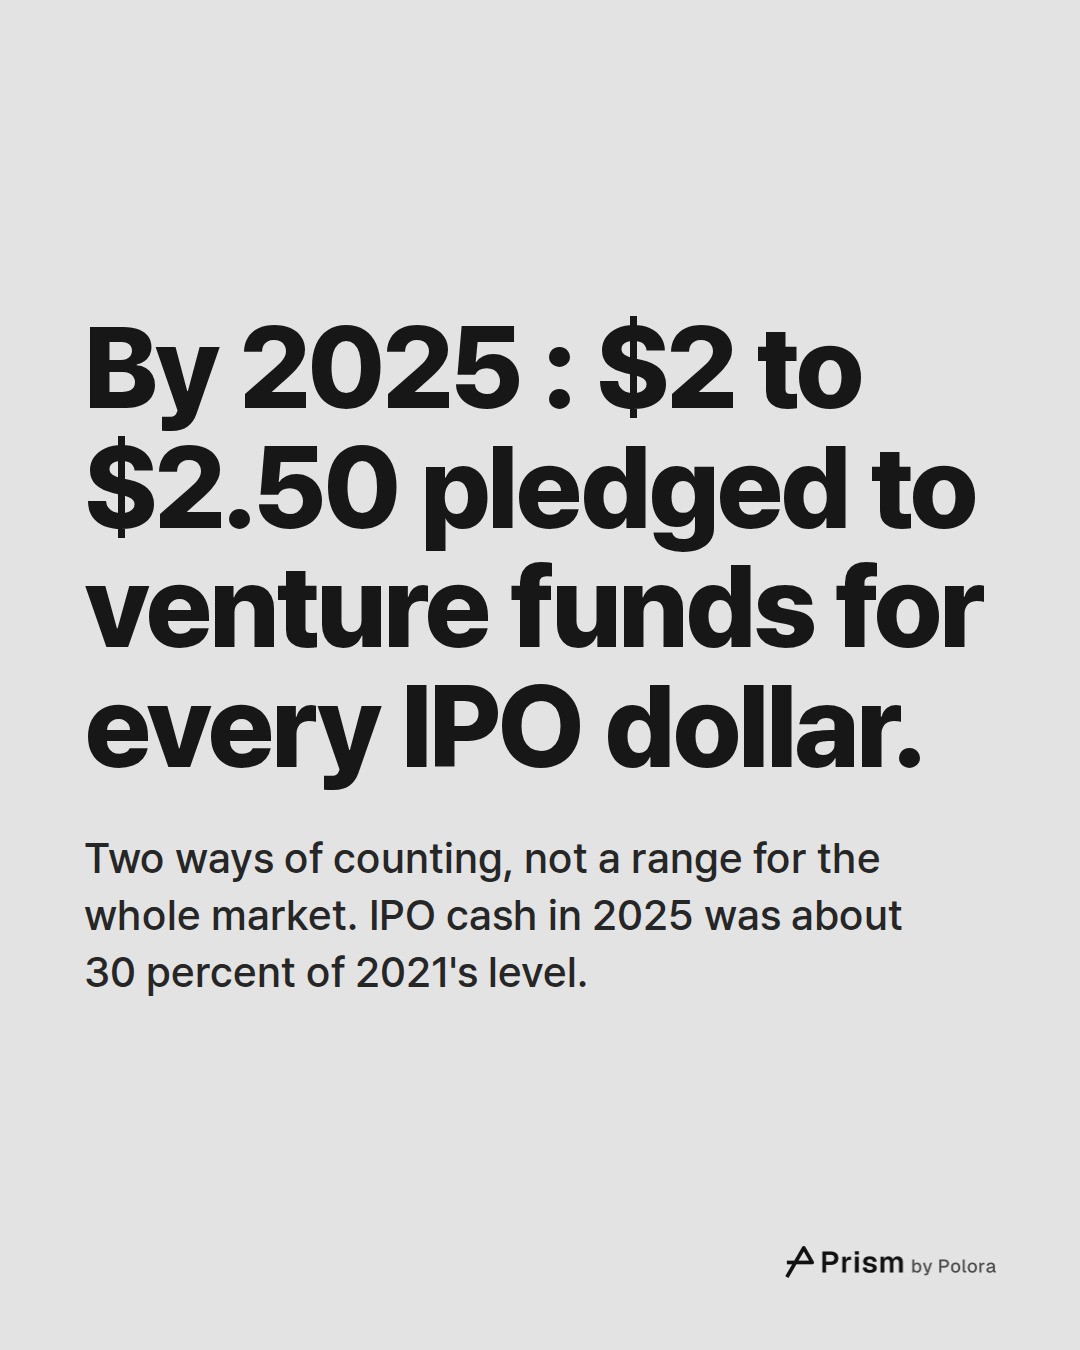
IPO cash on this count rose every year after 2022 : $8.6B in 2023, $19.0B in 2024 and $28.1B in 2025. Even so, 2025 was about 30 percent of 2021's level.
Venture pledges had already dipped in 2022, but their bigger fall came afterwards. From $118.5B in 2022 they dropped by more than 40 percent to $67.5B in 2024. Across 2023 to 2025 they stayed near $70B ($74.7B, $67.5B and $69.7B). Each year is what funds reported net of any reductions, so it can also hold amounts revised down.
By 2025 the gap was far smaller : $2 to $2.50 pledged to venture funds for every IPO dollar. The $2.50 is the film's two lines as drawn (about 2.48). The $2 also counts companies whose IPO prospectus is dated 2025 but which reported the sale under the general stock-sale line, adding what that line shows for each company's own fiscal year, which does not always match the calendar year (about 2.21). That line can include stock sales other than the IPO, so this addition is on the generous side, and the ratio it gives on the low side. These are two ways of counting, not a range for the whole market.
A full-year IPO figure for 2026 cannot be built yet, because this count reads each company's IPO cash from its annual report, filed after its fiscal year ends. On the venture side, Form D notices filed from January to September 2026 already reported $71.7B, more than the $69.7B of all of 2025.
What this does and does not show
The film and this piece show what happened, year by year, on two partial counts taken from SEC filings. They do not show why : a sequence of events is not a cause, and nothing here says the Fed's decision, or anything else, drove the swing. The gap between the lines is the difference between two unlike measures, pledges and cash, and not a measure of money companies needed and did not get. These past years promise nothing about the ones to come.
- SEC, Form D Data Sets (venture fund notices)]
- SEC EDGAR, structured financial data: IPO proceeds reported by each company (frames API, example for 2022)]
- SEC EDGAR, structured financial data: proceeds from issuing common stock (frames API, example for 2022)]
- SEC EDGAR, company filing histories, used to date each IPO prospectus (submissions API)]
- SEC, Filing a Form D Notice]
- SEC, Office of the Advocate for Small Business Capital Formation, Glossary ("Venture Capital Fund")]
- Federal Reserve, FOMC statement of March 2022]
- Sequoia Capital, "The Sequoia Fund: Patient Capital for Building Enduring Companies"]
![Sources 8 : sec.gov · SEC, Form D Data Sets (venture fund notices)], data.sec.gov · SEC EDGAR, structured financial data: IPO proceeds reported by each company (frames API, example for 2022)], data.sec.gov · SEC EDGAR, structured financial data: proceeds from issuing common stock (frames API, exampl](https://media.cdn.polora.ai/picks/2026/11/pickrun_aac9ce4053b14a2f/iGv-Mtcezg_Yy0YU-slide-06--did-venture-capital-dry.jpg)