Where does 'a loss hurts twice as much' come from?
Picture two days. On one you find $100 you did not expect. On the other you lose $100. Most people say the second day stays with them longer, and the popular explanation adds a number : a loss hurts about twice as much as an equal gain pleases.
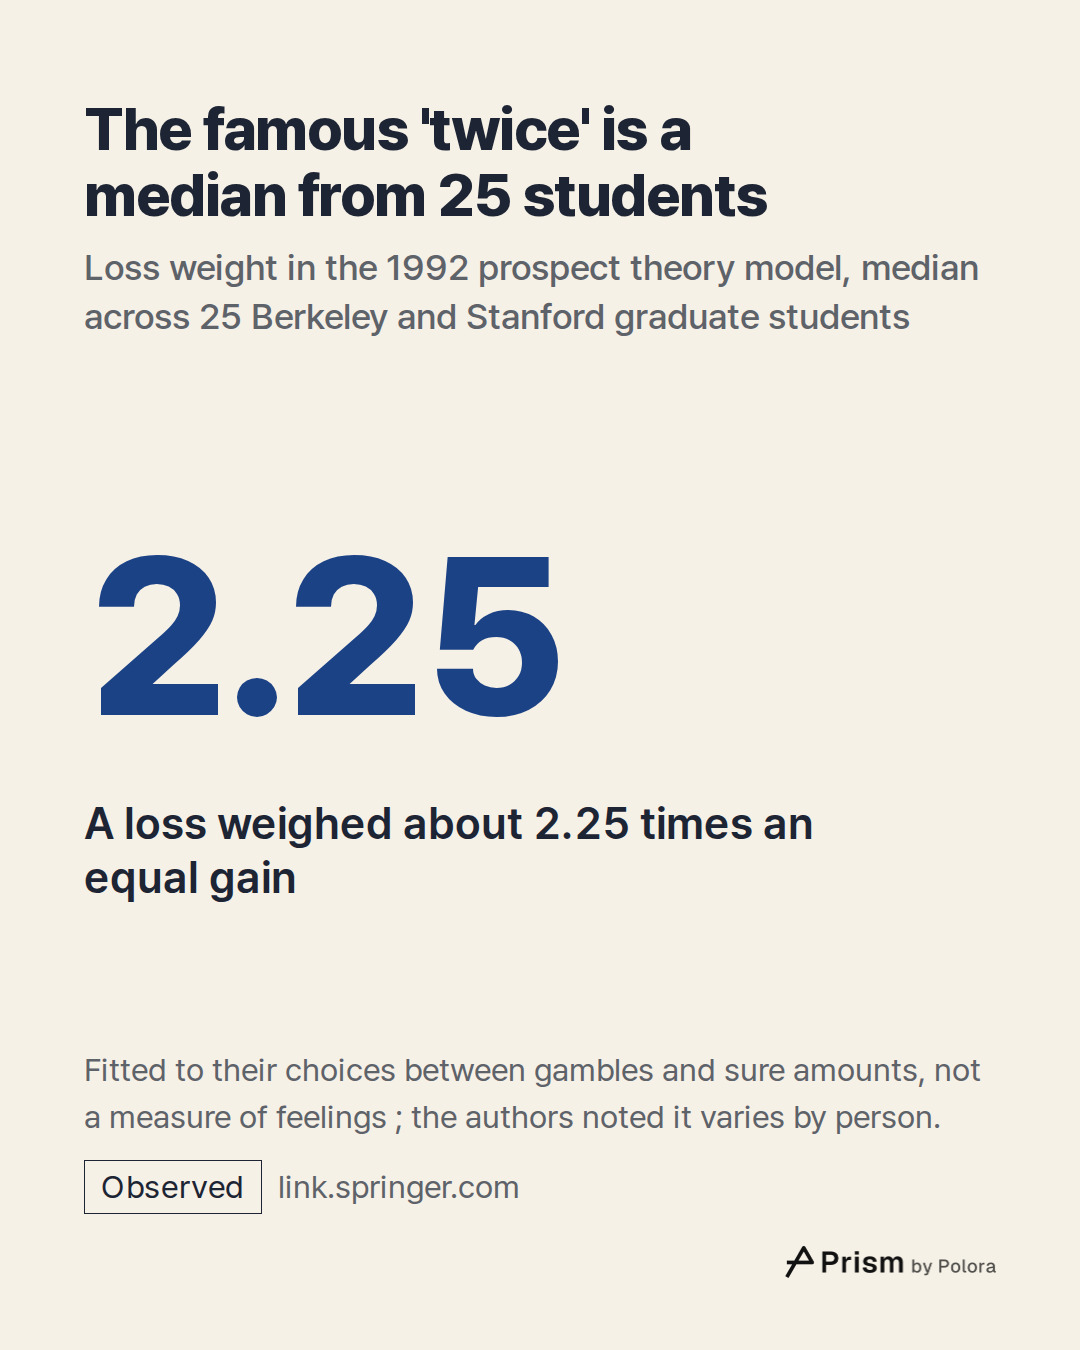
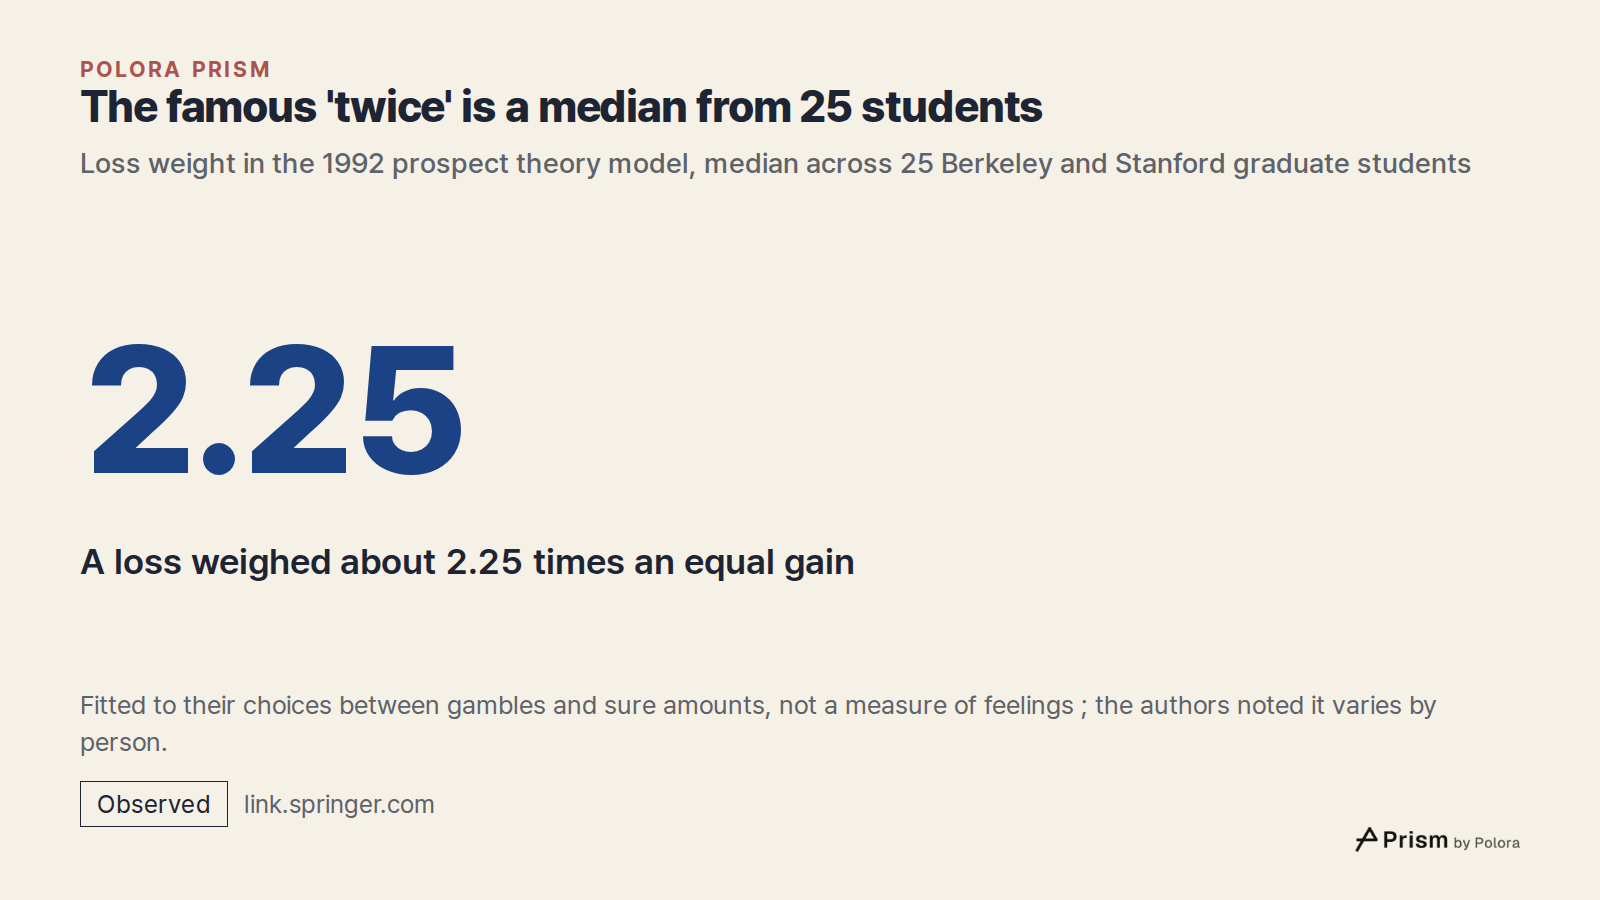
That number has an address. In 1979 the psychologists Daniel Kahneman and Amos Tversky proposed prospect theory, a description of how people actually choose when outcomes are uncertain (Econometrica, 1979). In 1992 they refined it and fitted it to the choices of 25 graduate students from Berkeley and Stanford, each paid $25 to take part, who chose between gambles and sure amounts of money (Journal of Risk and Uncertainty, 1992). The median of their estimates was 2.25 : in the model fitted to that group's choices, a loss was weighted about 2.25 times as heavily as a gain of the same size.
So 'twice' is a median for one small group, under one set of conditions. The authors themselves noted that the curve differs from person to person. And it comes from a model of those students' choices. It was never a measurement of how much any one person, or people in general, feel.
- Kahneman and Tversky (1979), Prospect theory : an analysis of decision under risk, Econometrica
- Kahneman and Tversky (1979), Prospect theory, full text
- Tversky and Kahneman (1992), Advances in prospect theory, Journal of Risk and Uncertainty
- Tversky and Kahneman (1992), Advances in prospect theory, full text
What does the famous loss and gain curve actually show?
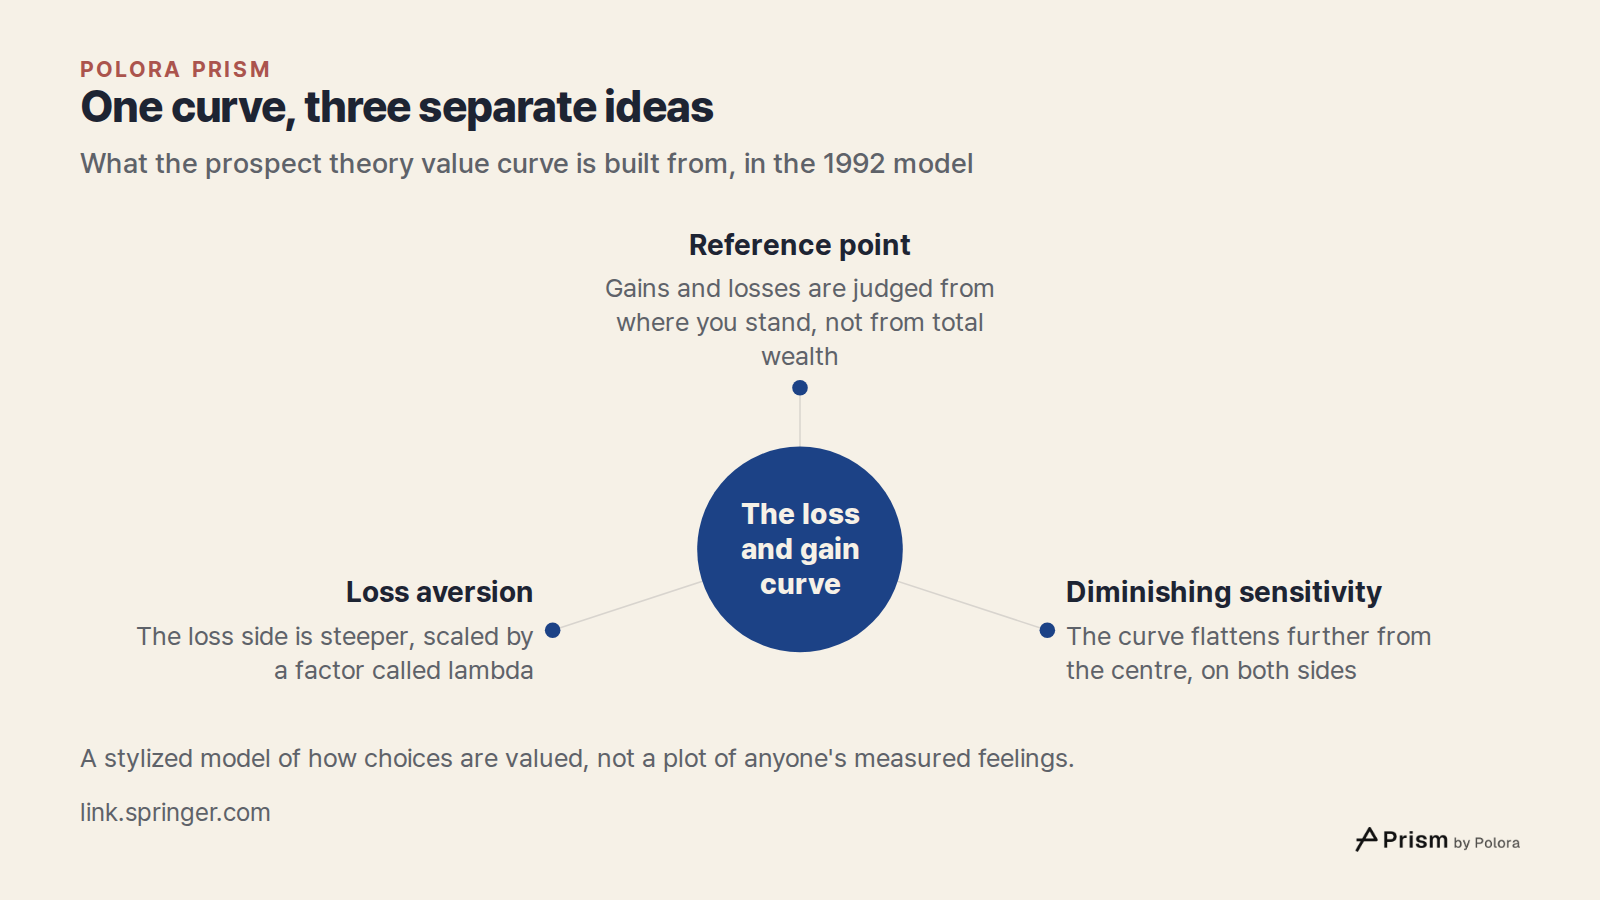
Prospect theory is usually drawn as one curve. Gains run to the right of a central point, losses to the left, and the vertical axis shows how much an outcome is valued. The curve carries three separate ideas, and they are easy to blur.
The first is the reference point. The curve starts where you stand, not at your total wealth. A $100 drop is judged as a loss from where you started or what you expected, whether you hold $1,000 or $1 million.
The second is diminishing sensitivity. The curve flattens as it moves away from the centre on both sides : going from $0 to $100 matters more than going from $1,000 to $1,100, for gains and for losses alike. In the 1992 fit this bend is set by an exponent of 0.88, the same on both sides.
The third is loss aversion, which is the answer to the headline's question. The loss side is steeper than the gain side, so a step to the left drops further than the same step to the right rises. The factor that scales the loss side is called lambda : in the 1992 model, a loss is valued at lambda times what a gain of the same size is worth. A lambda of 1 means losses and gains weigh the same ; 2.25 is the 1992 median.
The curve is a stylized model of how choices are valued, with these parameters plugged in. It is not a plot of anyone's measured feelings.
What did later studies find when they measured it again?
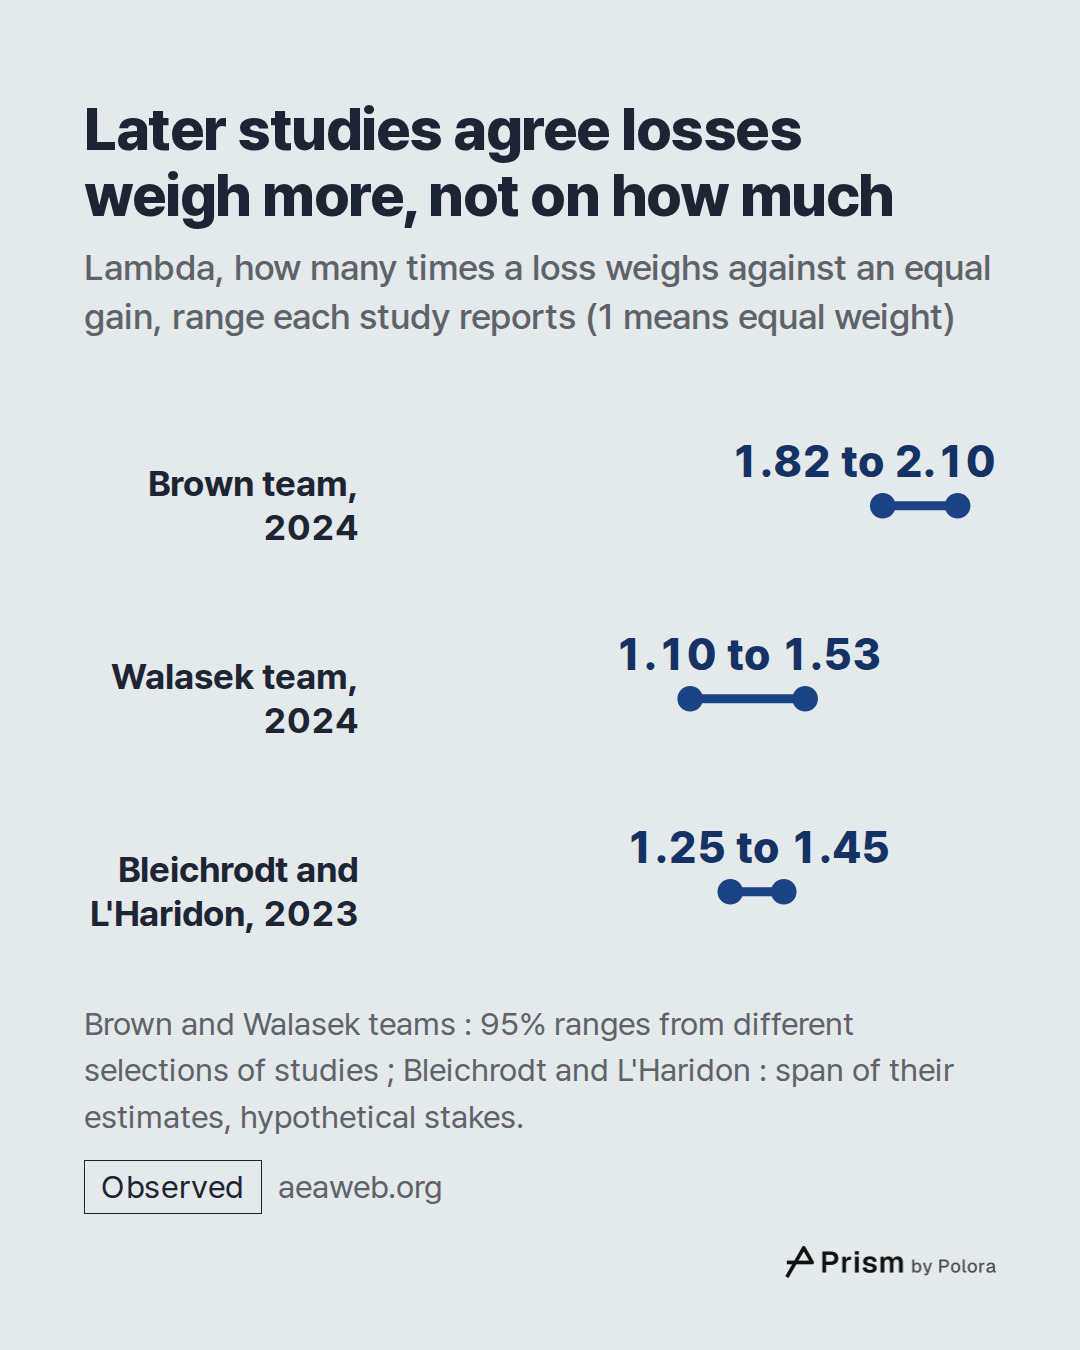
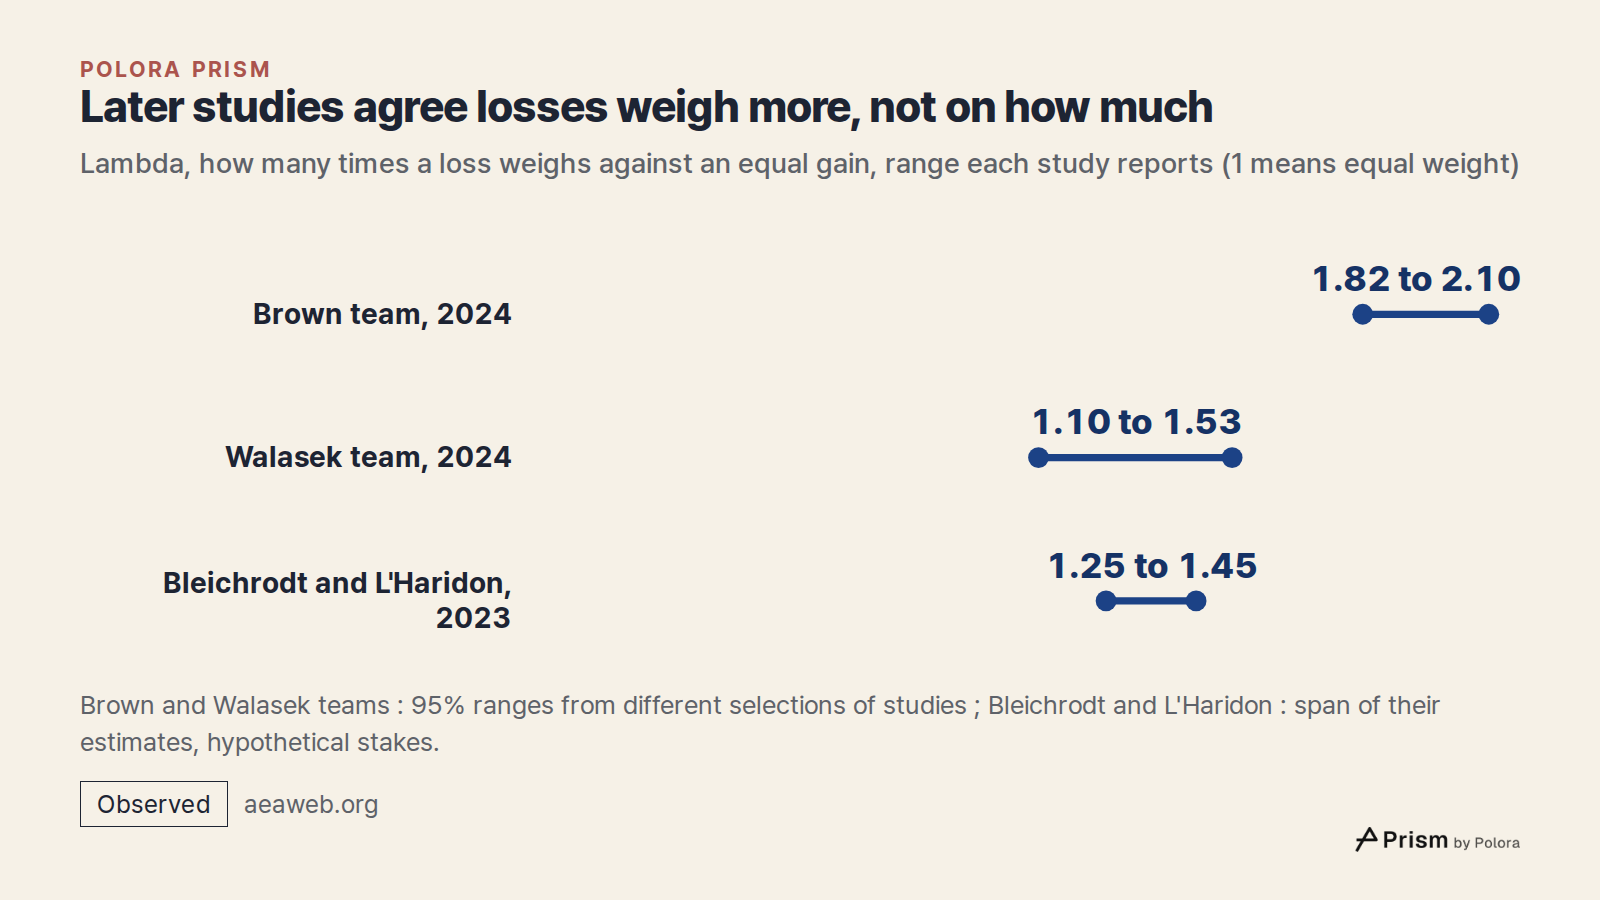
Hundreds of studies have since estimated lambda. The largest summary, by Alexander Brown, Taisuke Imai, Ferdinand Vieider and Colin Camerer (Journal of Economic Literature, 2024), gathered 607 estimates from 150 articles published from 1992 to 2017. Taken as reported, the estimates have a median of 1.69 and a mean of 1.97. After the authors' statistical adjustment their central estimate is 1.955, with a 95% range of 1.82 to 2.10. They found that few of the study design features they recorded lined up with differences in the results.
Other summaries came in lower. Lukasz Walasek, Timothy Mullett and Neil Stewart (Journal of Economic Psychology, 2024) re-estimated lambda from the raw choices in 17 studies of risky gambles and got 1.31, with a 95% range of 1.10 to 1.53, a range that does not reach 2.25 ; they also flagged that much of the data in that set was of poor quality. Michael Neumann and Ulf Böckenholt (Journal of Retailing, 2014), looking at choices between consumer brands, got 1.49 or 1.73 depending on the model. Han Bleichrodt and Olivier L'Haridon (Judgment and Decision Making, 2023), using a test designed to separate loss aversion from the curve's flattening, found loss aversion at both small and large stakes, with lambda between 1.25 and 1.45, which they describe as less than commonly observed. Their stakes were hypothetical.
These are analyses of different selections of evidence, built in different ways, not repeated measurements of one human constant. Asked whether losses weigh more, these studies usually answer yes. Asked how much more, they part ways : from about 2 down to about 1.3.
- Brown, Imai, Vieider and Camerer (2024), Meta-analysis of empirical estimates of loss aversion, Journal of Economic Literature
- Brown, Imai, Vieider and Camerer (2024), Caltech record
- Walasek, Mullett and Stewart (2024), Journal of Economic Psychology, Warwick repository
- Walasek, Mullett and Stewart (2024), full text
- Walasek, Mullett and Stewart (2024), Journal of Economic Psychology
- Neumann and Böckenholt (2014), Journal of Retailing
- Bleichrodt and L'Haridon (2023), Prospect theory's loss aversion is robust to stake size, Judgment and Decision Making
Why does the answer change with how the test is built?
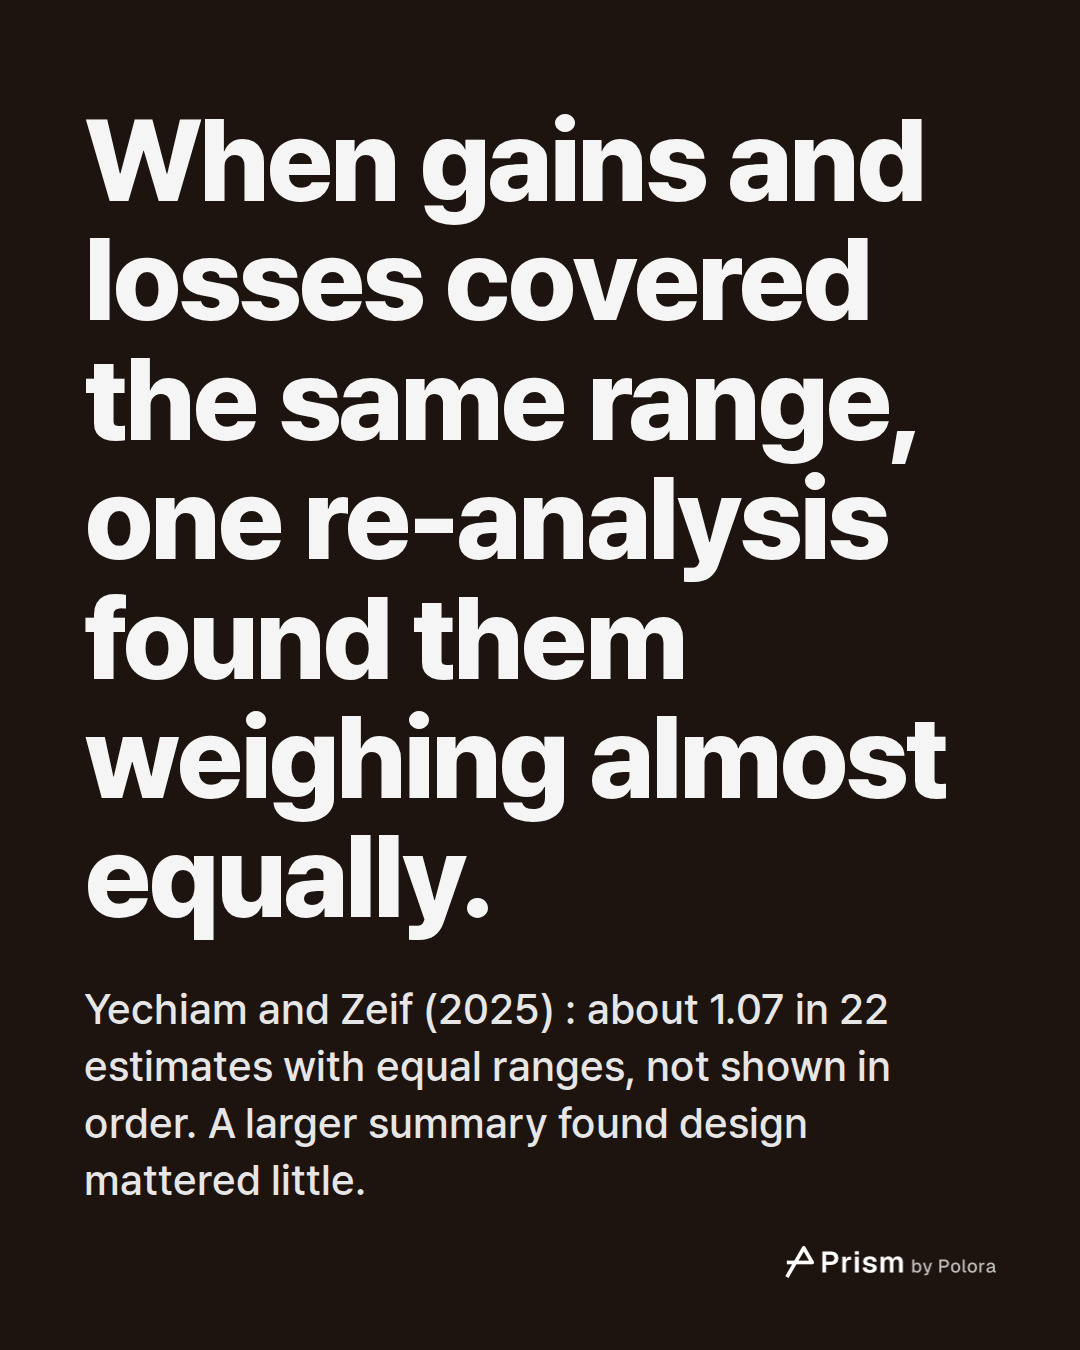
Eldad Yechiam and Dana Zeif (Journal of Economic Psychology, 2025) went back to the Brown team's data and sorted the studies by design. They could do this for 163 of the estimates, from 84 papers. Two features kept turning up where loss aversion looked strong : the possible losses were smaller than the possible gains, or the amounts were shown in order of size. In the 22 estimates where gains and losses covered the same range and were not shown in order, lambda came out at about 1.07, with a range of 0.97 to 1.18, not significantly above 1. They also found lower estimates when the money was real than when it was hypothetical. Their own title states their reading : loss aversion is not robust. That figure holds for the subset they selected ; it challenges how general the larger estimates are, but it does not erase them. The Brown team found that few recorded design features mattered, while Yechiam and Zeif found design differences that did, so the two summaries disagree on this point.
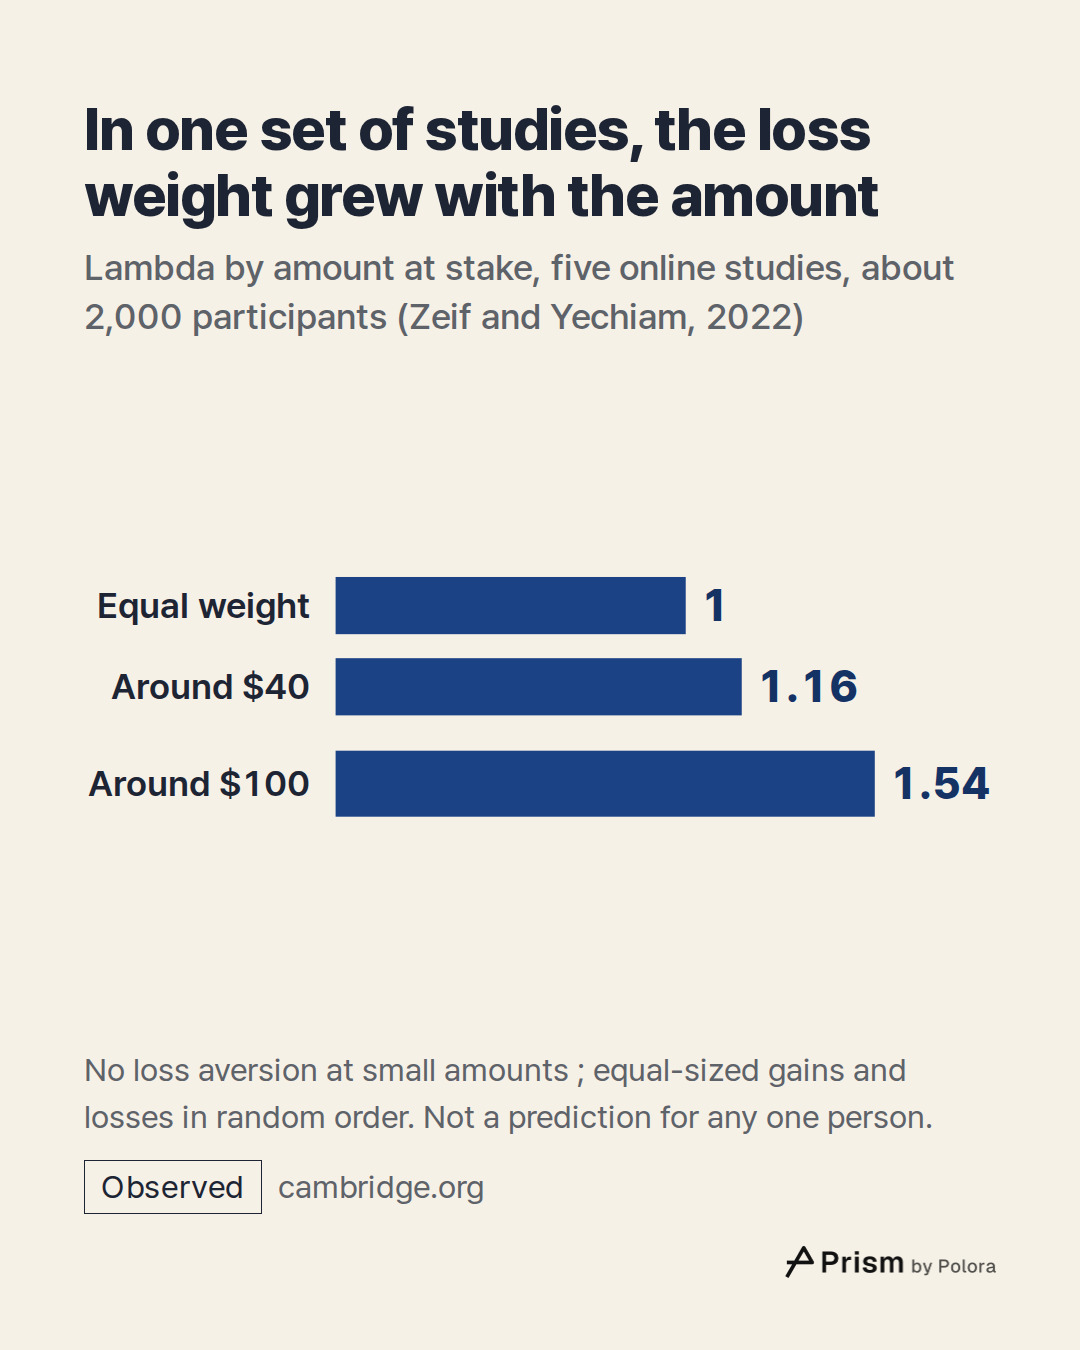
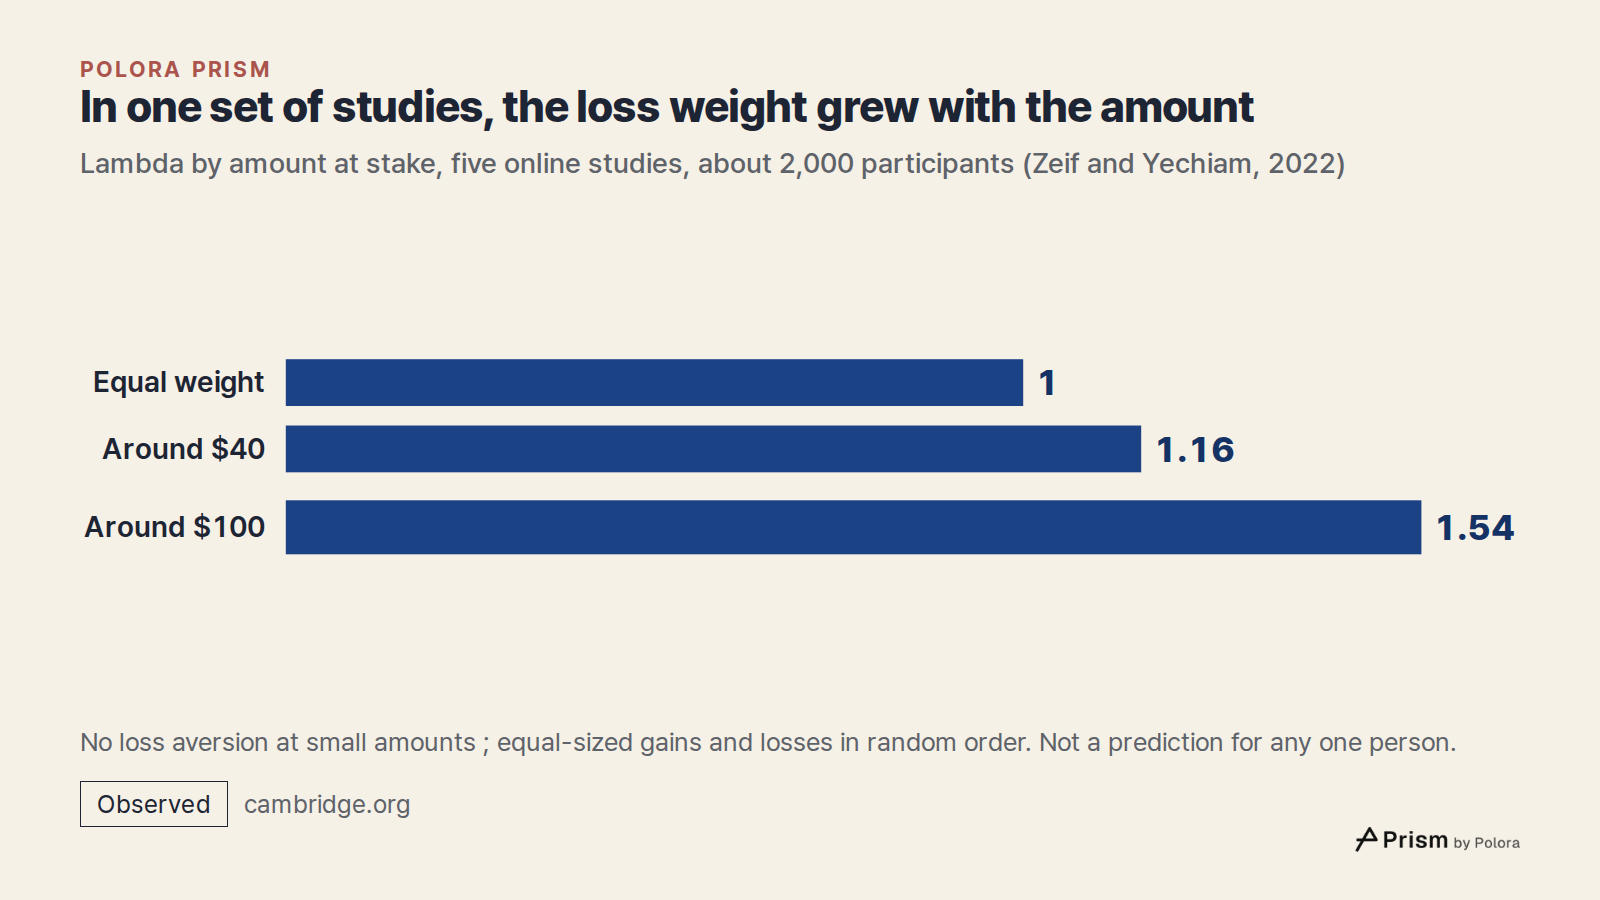
The size of the amount matters to the headline's own $100. In an earlier set of five online studies with about 2,000 participants, Zeif and Yechiam (Judgment and Decision Making, 2022) presented gains and losses of the same size in random order. They found no loss aversion for small amounts, a weak lambda of 1.16 around $40, and 1.54 around $100. Those figures hold under that study's method ; they are not a prediction for any one person's $100.
There is also a gap between choosing and feeling. Most of these numbers come from the choices people make, not from what they later feel. In two gambling studies, Deborah Kermer and colleagues (Psychological Science, 2006) found that people predicted a loss would hurt more than an equal win would please, but when they actually gambled, the losses hurt less than they had predicted. That shows a gap between forecast and experience in those studies ; it does not show that a real loss never feels worse than an equal gain.
Not everyone reads the evidence the same way. David Gal and Derek Rucker (Journal of Consumer Psychology, 2018) argued in a review, not a new estimate, that losses do not loom larger than gains as a general rule and that it depends on context. Itamar Simonson and Ran Kivetz replied in the same issue that the conclusion was overstated. The question is still open, with careful researchers on both sides.
- Yechiam and Zeif (2025), Loss aversion is not robust : a re-meta-analysis, preprint
- Yechiam and Zeif (2025), Journal of Economic Psychology
- Yechiam and Zeif (2025), Journal of Economic Psychology
- Yechiam and Zeif (2025), research record
- Zeif and Yechiam (2022), Judgment and Decision Making
- Zeif and Yechiam (2022), Loss aversion (simply) does not materialize for smaller losses
- Kermer and others (2006), Psychological Science
- Kermer and others (2006), Psychological Science
What does the curve have to do with a stock you own?
For an investor, the reference point is often the price paid. A share bought at $50 and now at $40 feels like a $10 loss, though the market price is the same for everyone who holds it, whatever they paid.
The bend on the loss side matters here more than lambda does. Because the curve flattens as losses grow, the model predicts that people facing a loss will take a gamble rather than accept a sure loss. In the 1979 paper, 80% of respondents preferred a sure $3,000 to an 80% chance of $4,000, but when the same choice was put as losses, 92% took the gamble.
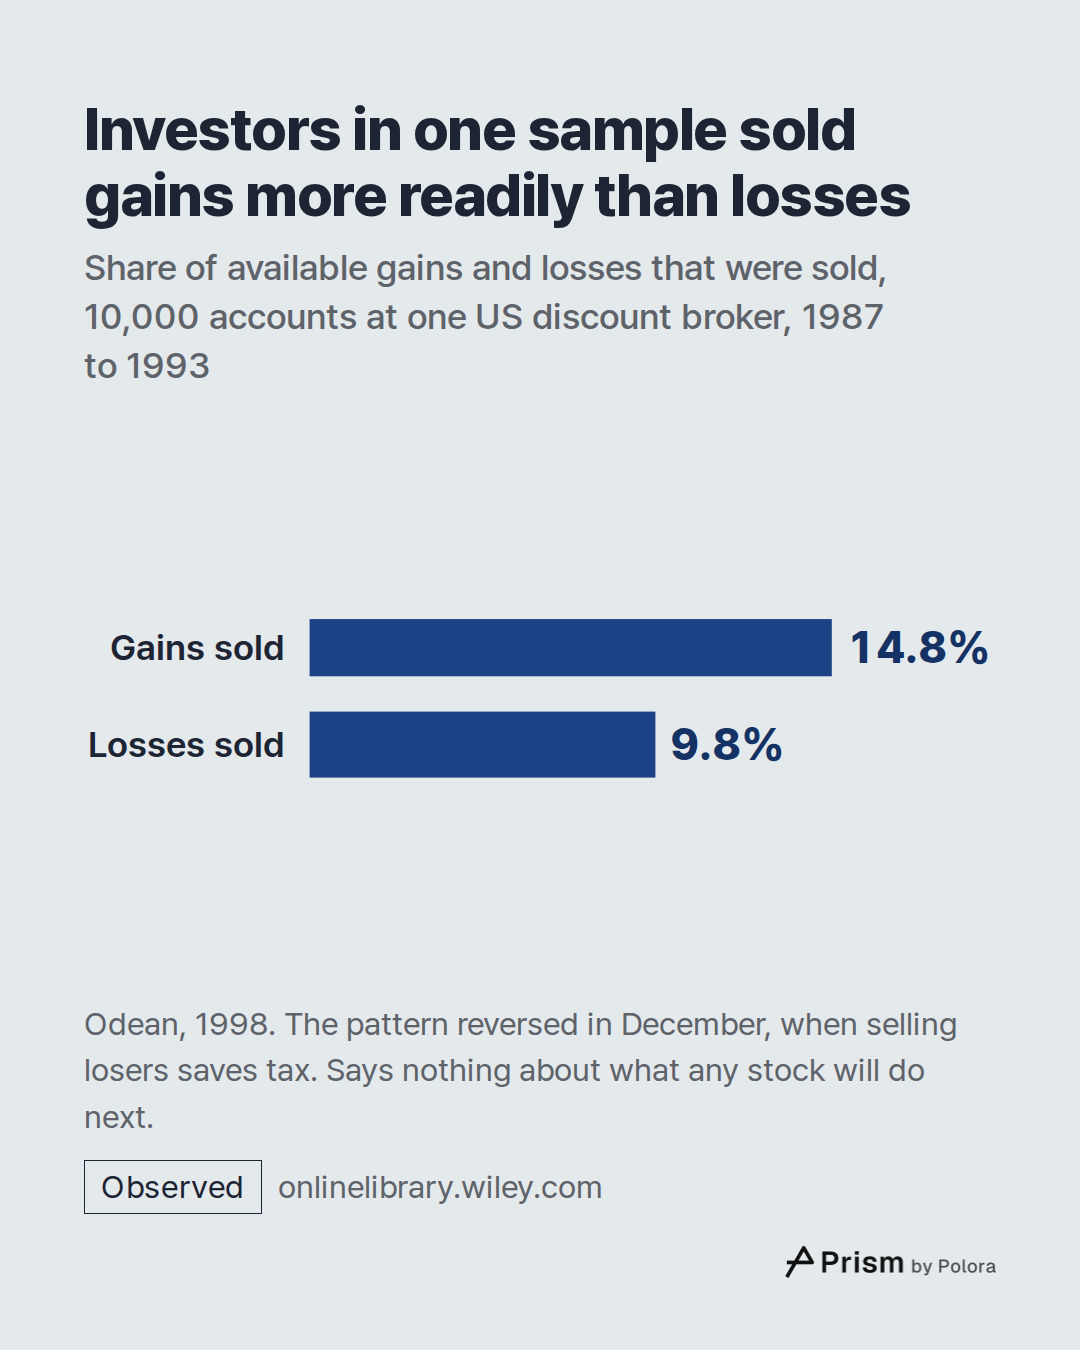
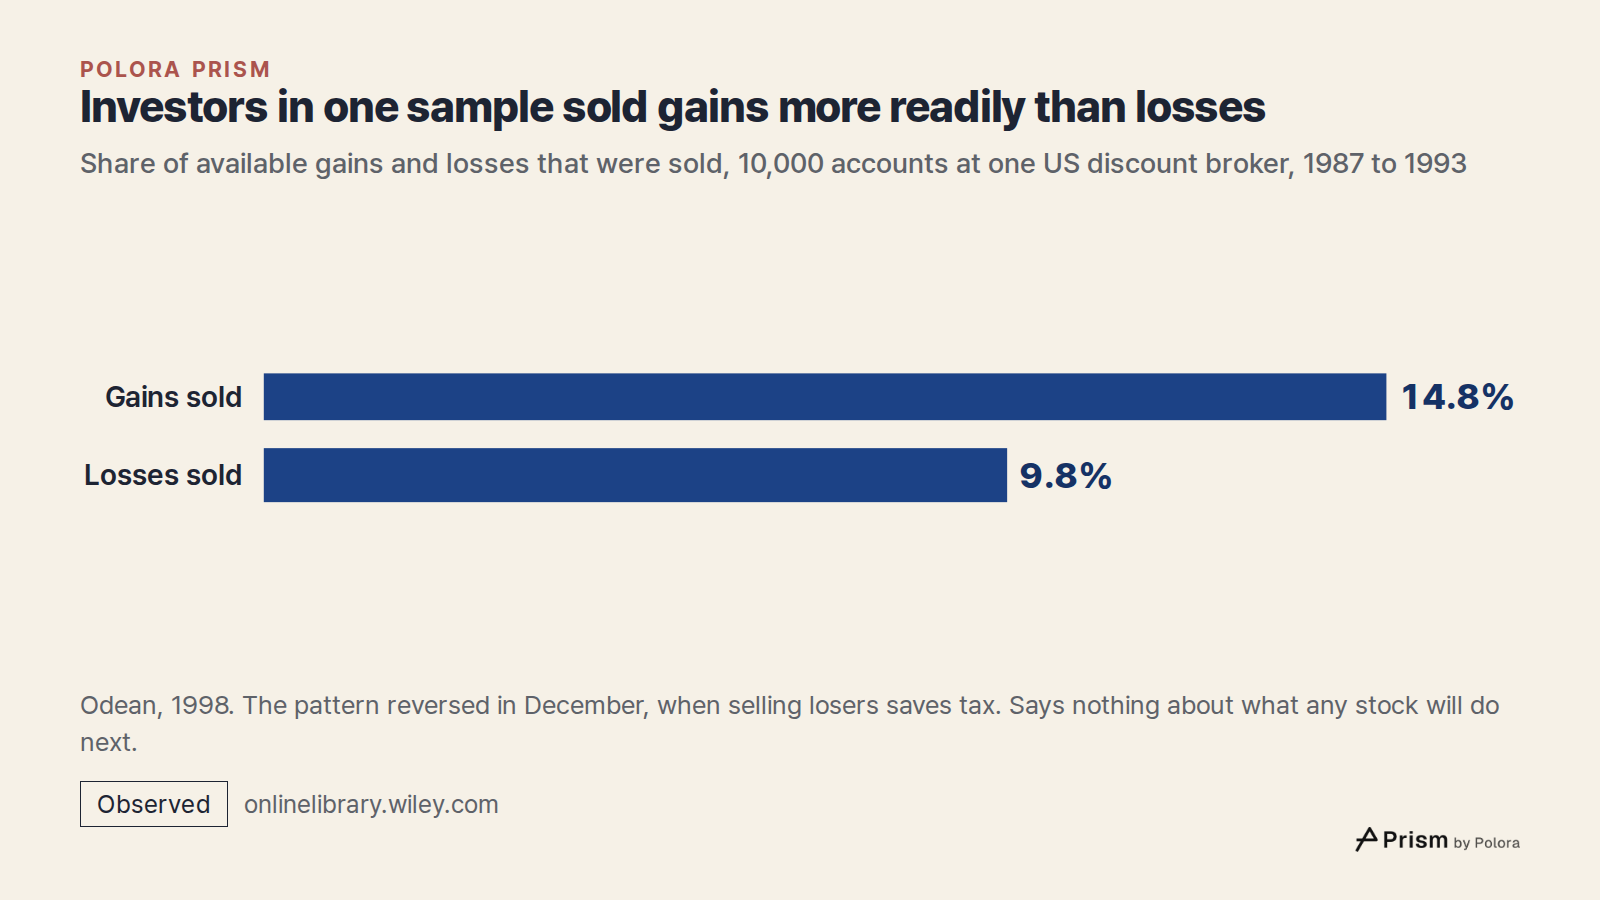
Hersh Shefrin and Meir Statman (Journal of Finance, 1985) gave a name to a related pattern in investing, the disposition effect : selling winners too early and riding losers too long. They explained it with several things together, including mental accounting, regret and tax, not with one curve. Terrance Odean (Journal of Finance, 1998) then tested it on the trades in 10,000 randomly chosen accounts at one large US discount broker from 1987 to 1993. Those investors sold 14.8% of the gains available to them but only 9.8% of the losses ; in December, when selling losers saves tax, the pattern reversed. In that sample, the winners they sold went on to beat the losers they kept by 3.4 percentage points over the following year. That is a finding about those accounts in those years, and it says nothing about what any stock will do next or when anyone should sell.
The link from the curve to that behaviour is less direct than it looks. Nicholas Barberis and Wei Xiong (Journal of Finance, 2009) worked through simple versions of prospect theory and found that a version based on annual gains and losses often fails to predict the disposition effect and sometimes predicts the opposite, while a version based on gains and losses actually realized predicts it more reliably.
- Kahneman and Tversky (1979), Prospect theory, Econometrica
- Kahneman and Tversky (1979), Prospect theory, full text
- Shefrin and Statman (1985), Journal of Finance
- Odean (1998), Are investors reluctant to realize their losses?, full text
- Odean (1998), Journal of Finance
- Barberis and Xiong (2009), What drives the disposition effect?, Journal of Finance
So does a loss really hurt more?
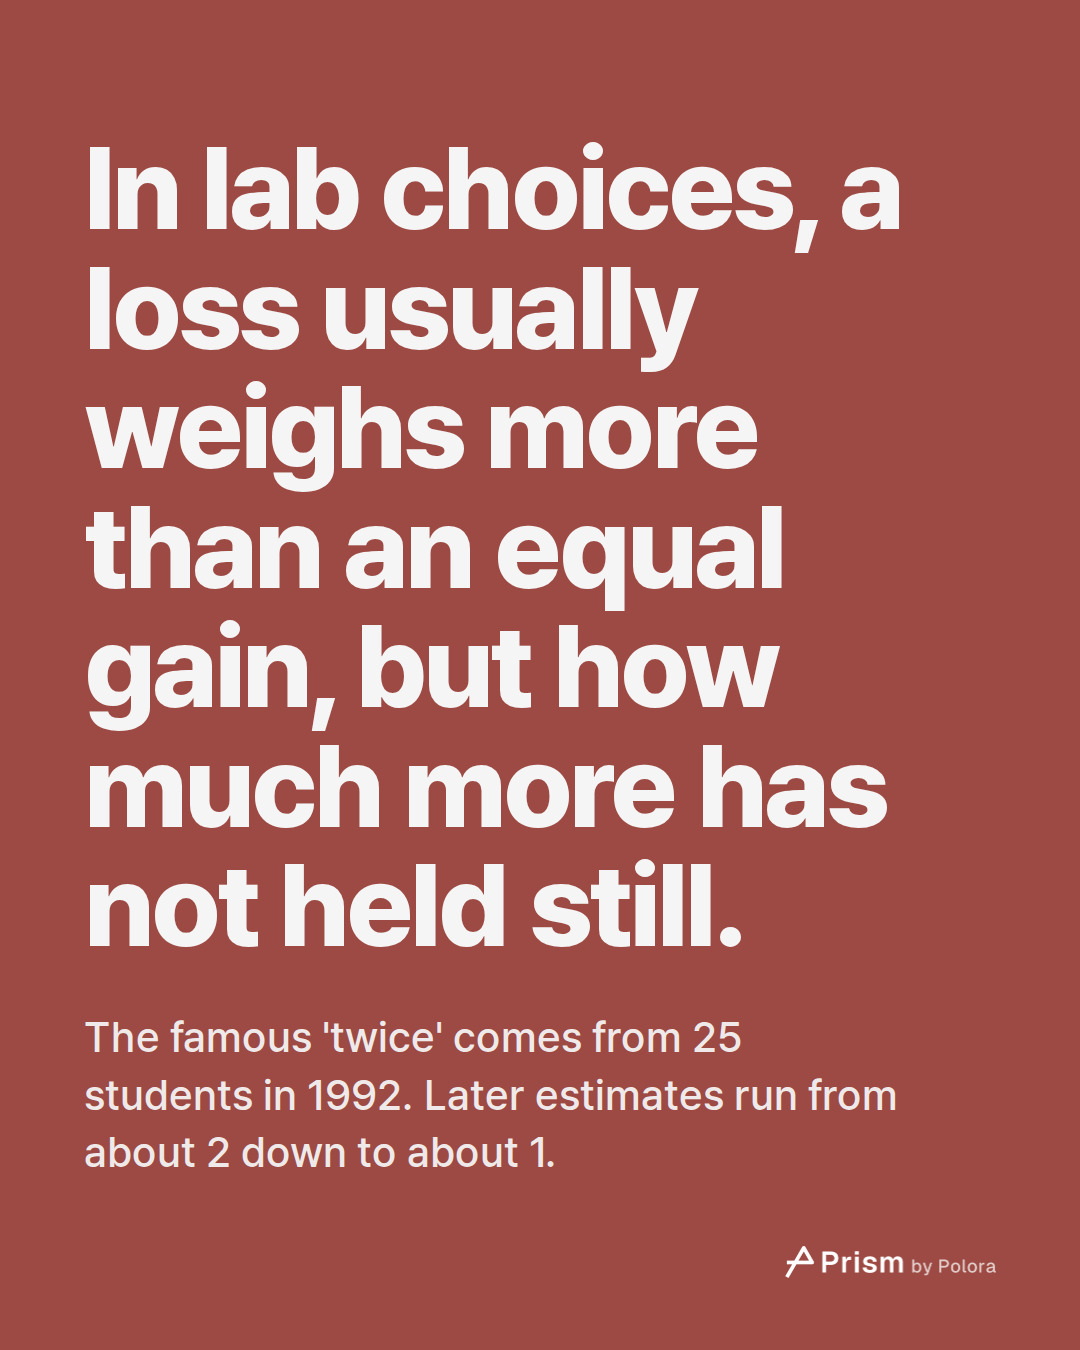
In many experiments people's choices do weigh a loss more than an equal gain, and that pattern has been found again and again. What has not held still is the size. The 'twice' you hear comes from 25 students in 1992 ; summaries of later work, each drawing on a different selection of studies, put it near 2, near 1.3, or close to 1, depending on whether the losses were smaller than the gains, how the choices were laid out, whether the money was real and how much was at stake.
These numbers describe choices. How a loss feels once it happens has been measured far less, and in one pair of gambling studies it hurt less than people had expected.
So the sentence worth keeping is this : losses usually weigh more than gains in the lab, but by how much depends on how the test was built as much as on people. When you next see '2x', the useful question is how it was measured, and whether it measured a choice or a feeling.