What counts as US corporate profits
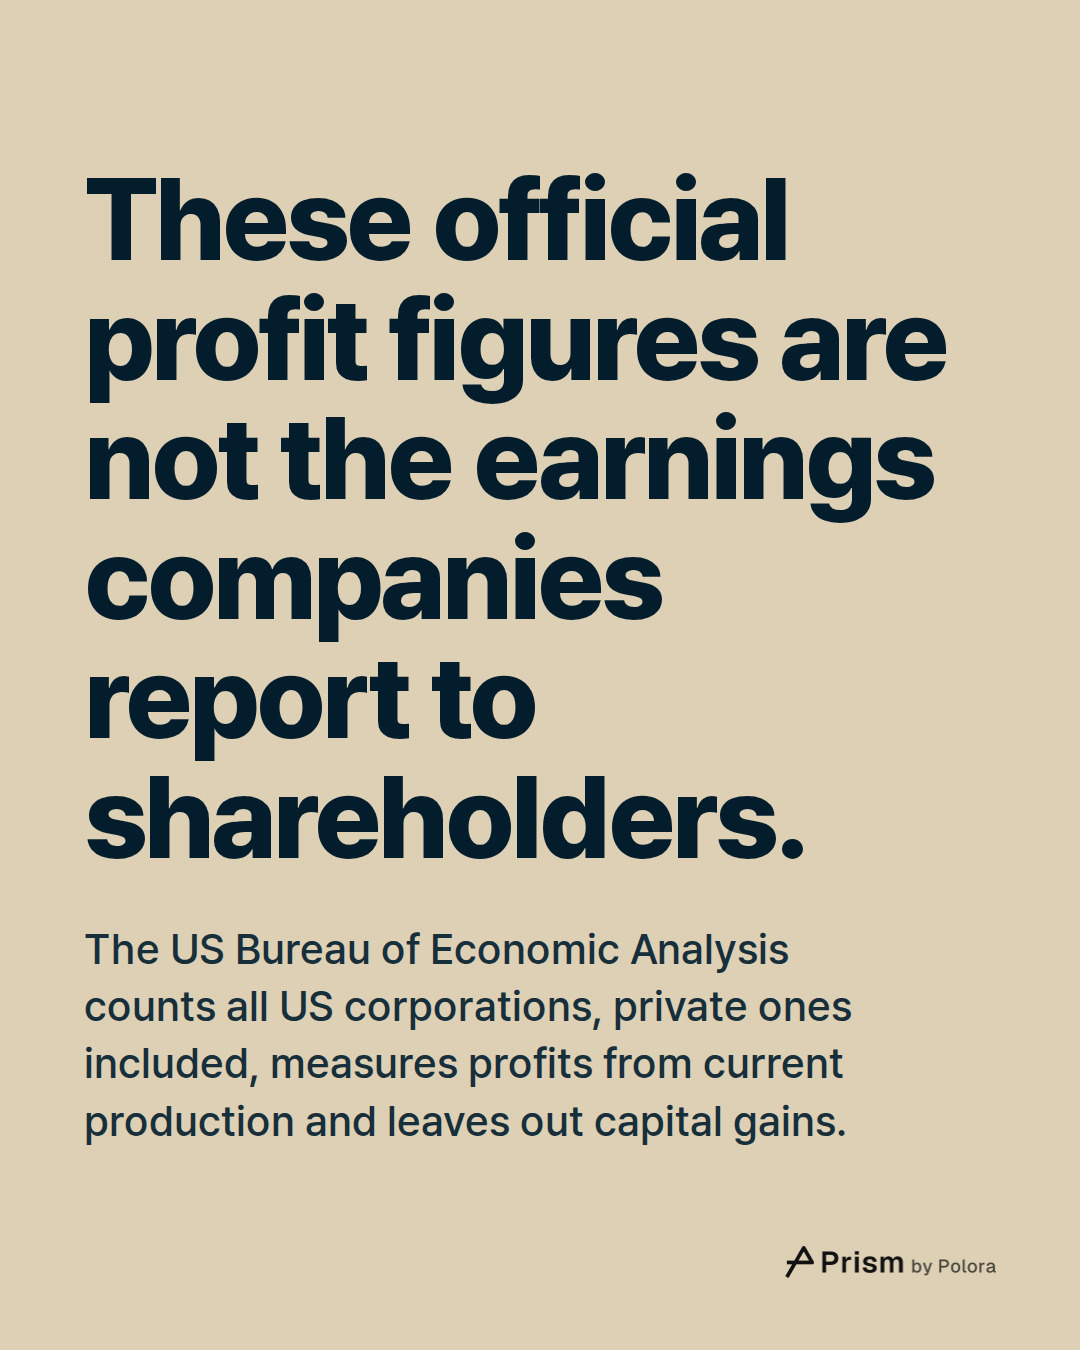
The figures come from the US Bureau of Economic Analysis (BEA), which estimates the profits of all US corporations as part of the national accounts. That covers everything BEA treats as a corporation, private companies included, not just companies listed on the stock market. BEA measures profits from current production. It leaves out capital gains, and it adjusts companies' own accounts so that inventories and the wear on buildings and equipment are valued at today's prices. So these are not the earnings that companies report to shareholders.
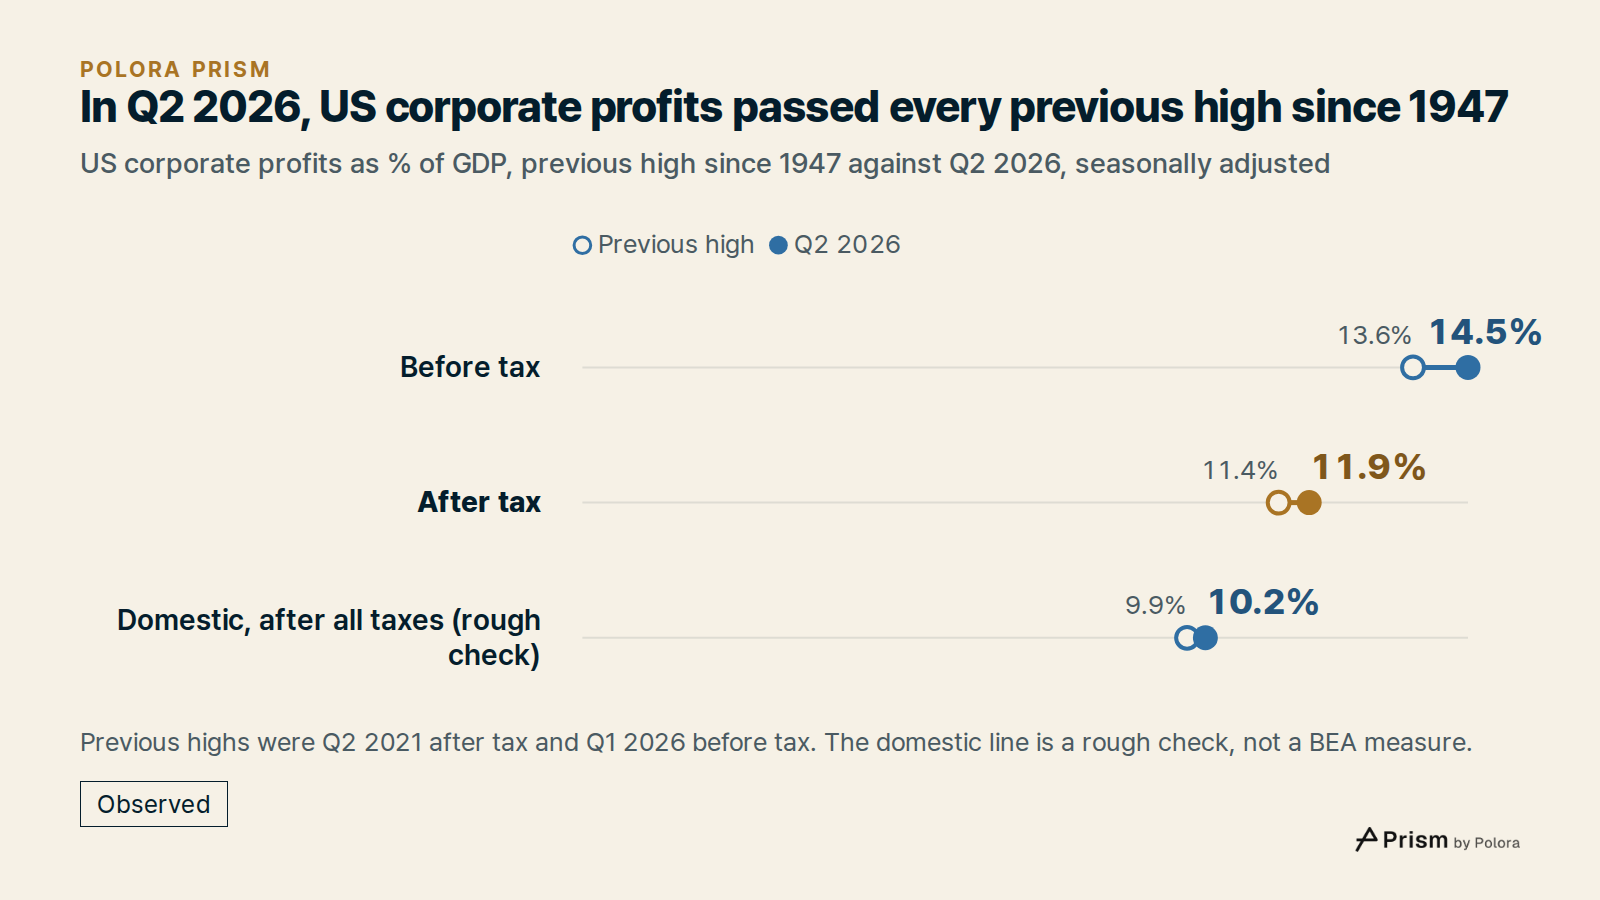
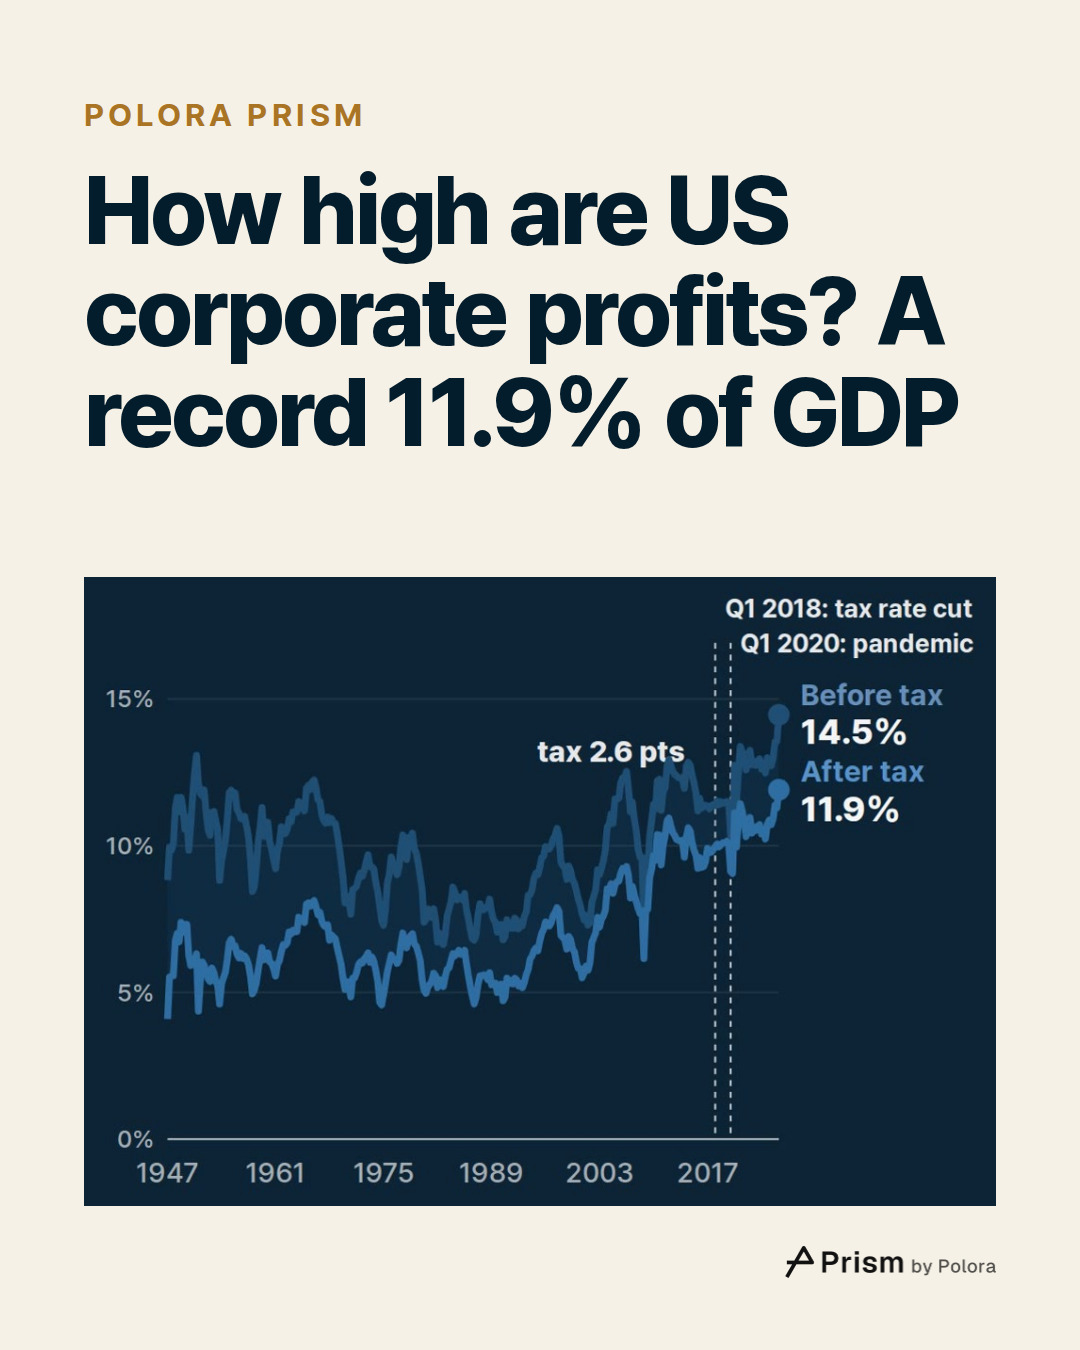
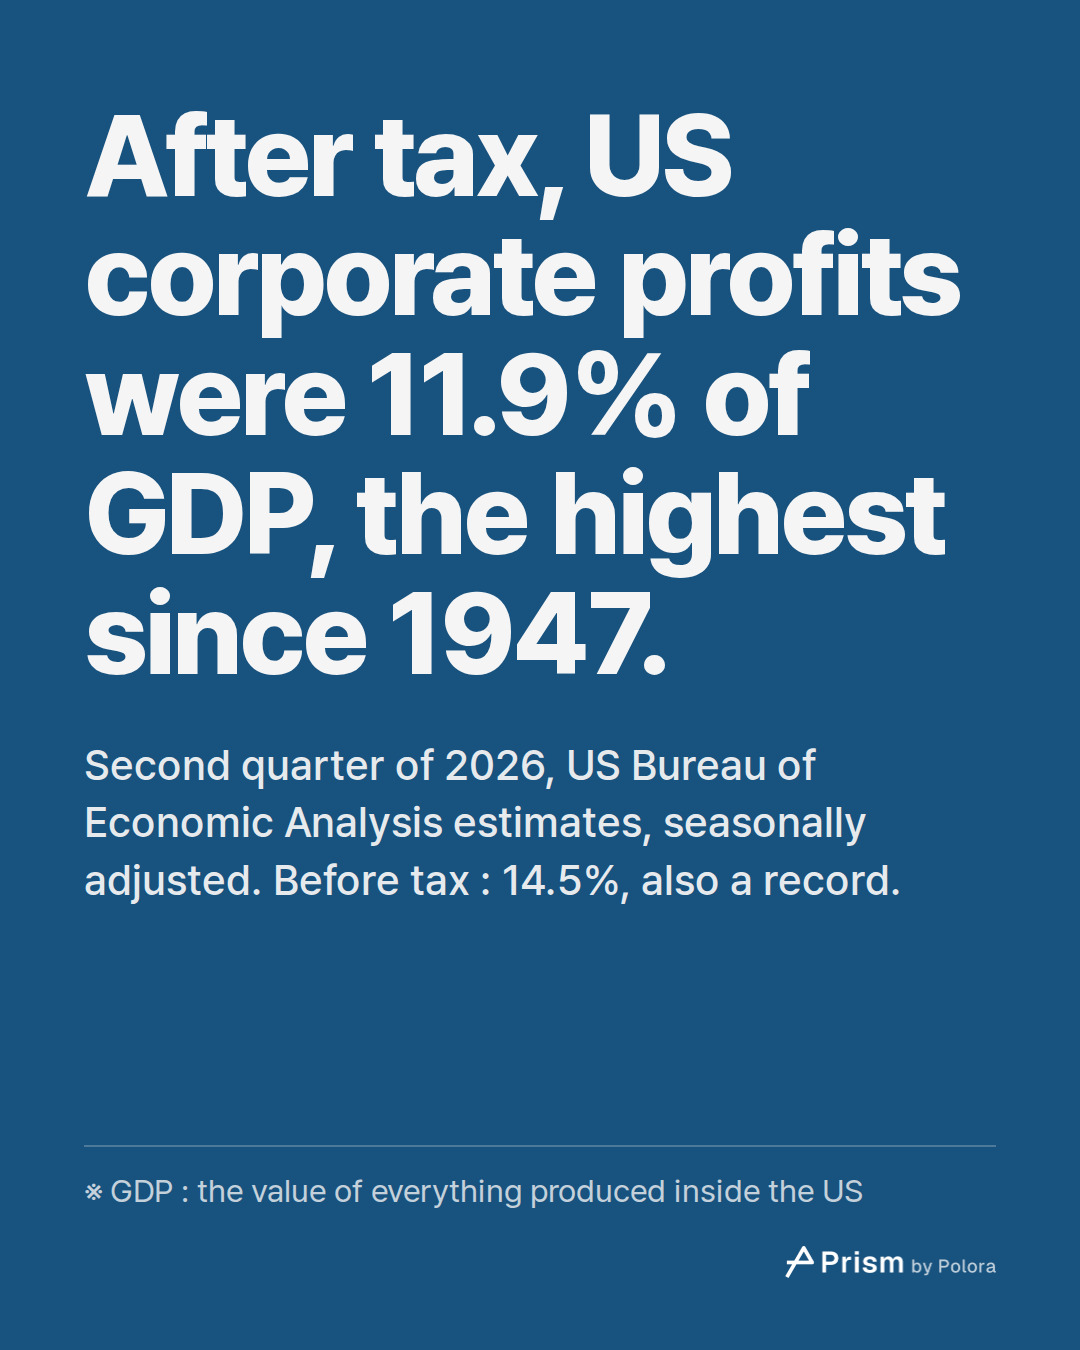
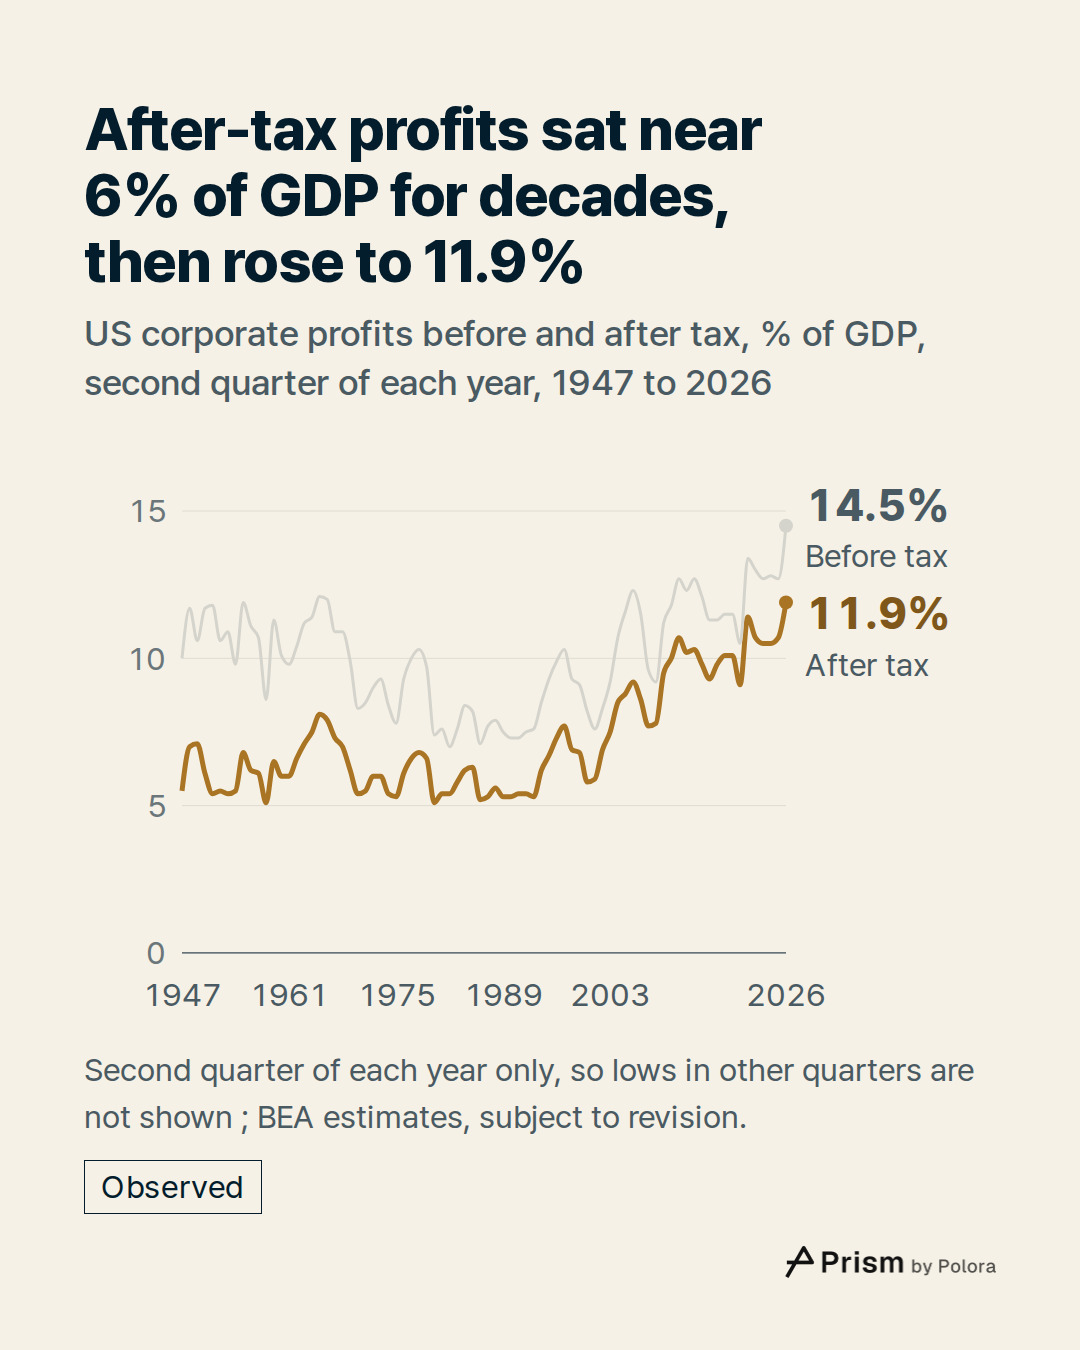
In the April to June quarter of 2026, BEA put profits after tax at about $3.9 trillion at an annual rate, against GDP of $32.6 trillion. Before tax, profits were $4.7 trillion, or 14.5% of GDP. Both figures are seasonally adjusted, and both are in the dollars of their own day, like GDP, so the ratio needs no adjustment for inflation.
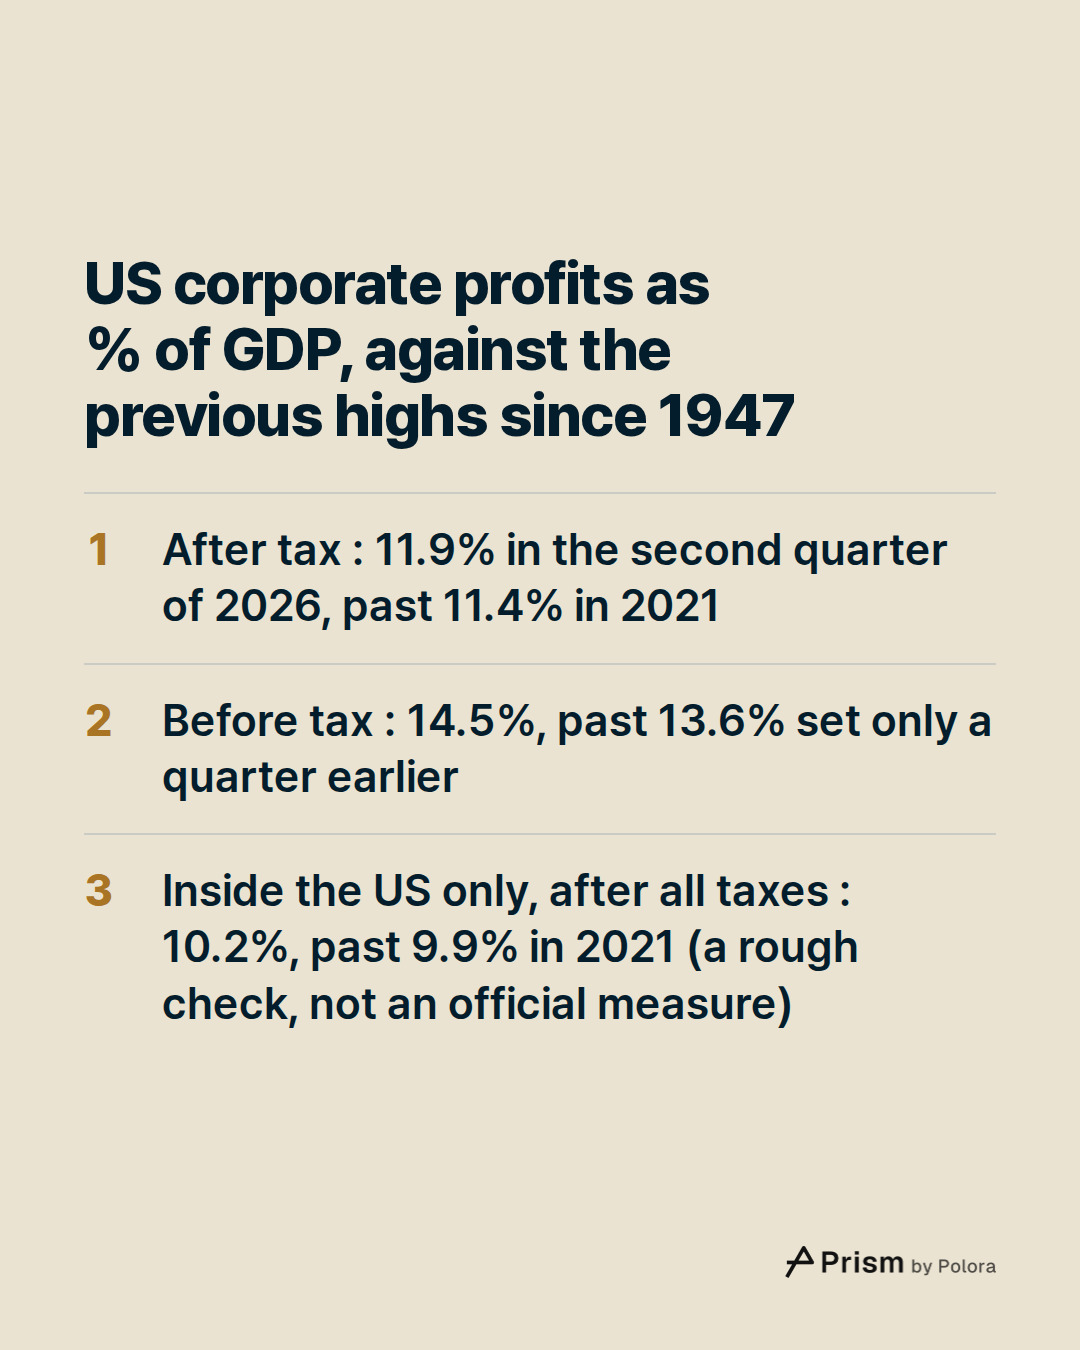
The ratio is not quite a slice of GDP. GDP counts what is produced inside the US. BEA's profits also include a net amount from the rest of the world : mainly the earnings of US companies' foreign affiliates and dividends from abroad, less the same kinds of income flowing out to foreign owners. That net amount was equal to 1.7% of GDP in the second quarter. The record does not depend on it, though. BEA also publishes the profits of domestic industries, the operations inside the US. Taking all taxes on corporate income away from those profits, as a rough check rather than an official BEA measure, leaves 10.2% of GDP. That is also the highest since 1947; the previous high was 9.9%, in the second quarter of 2021.
The old after-tax high was 11.4%, in the second quarter of 2021. Before tax, the old high was 13.6%, set only a quarter earlier, in the first quarter of 2026. Before 1947, BEA has only yearly estimates, going back to 1929. None of those years reaches these levels, but yearly and quarterly estimates are not measured in quite the same way, so the record is stated here since 1947.
Seventy-nine years of US corporate profits
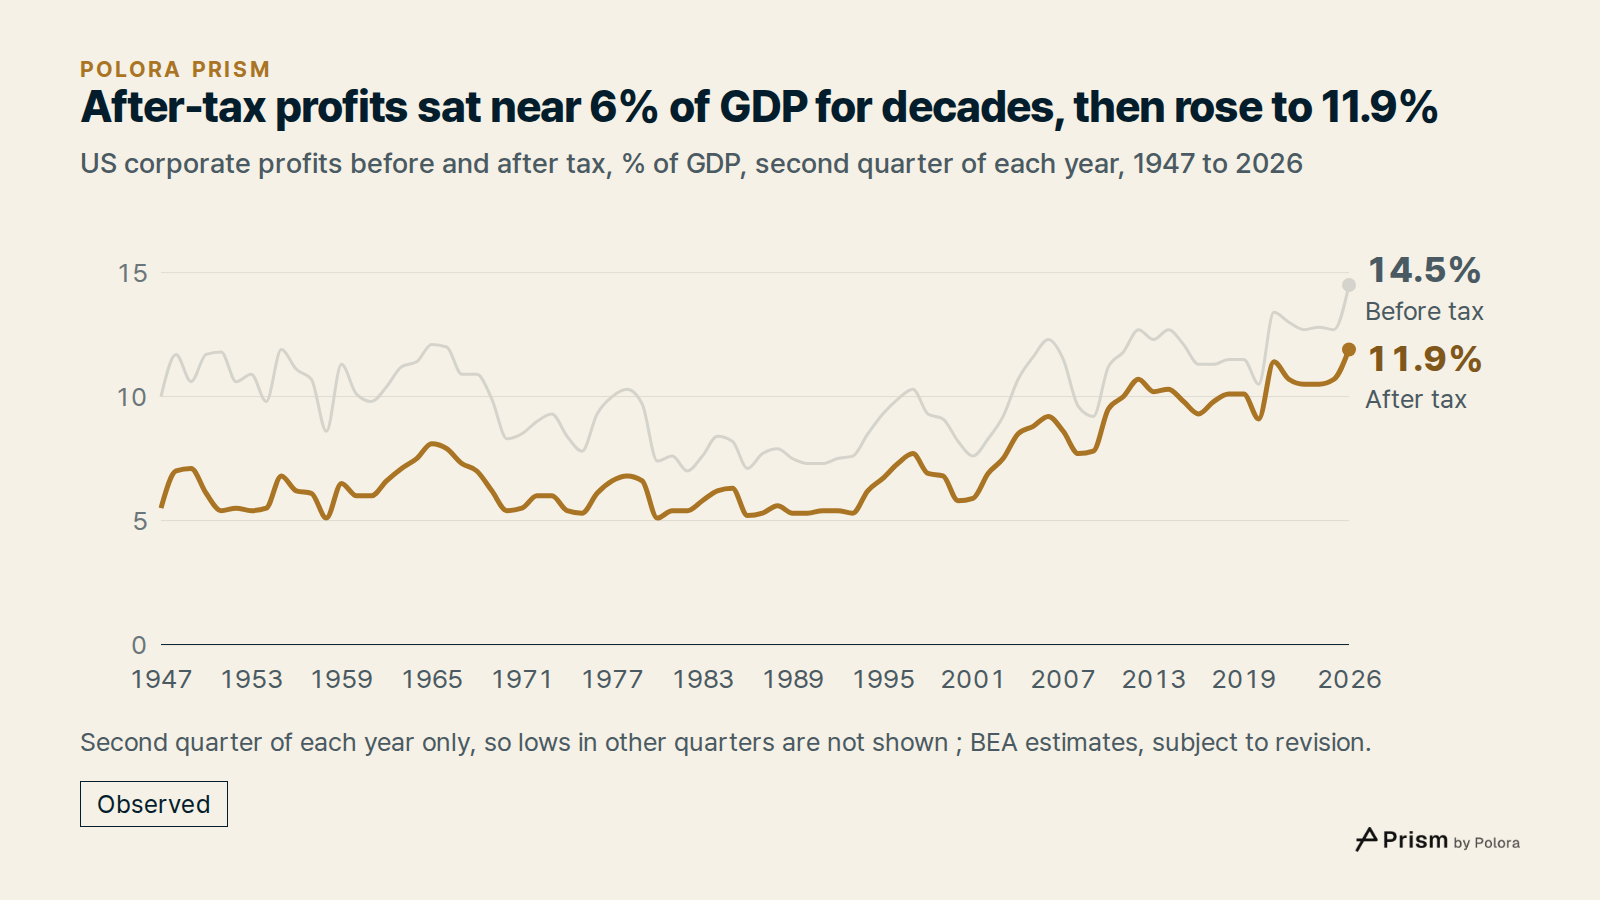
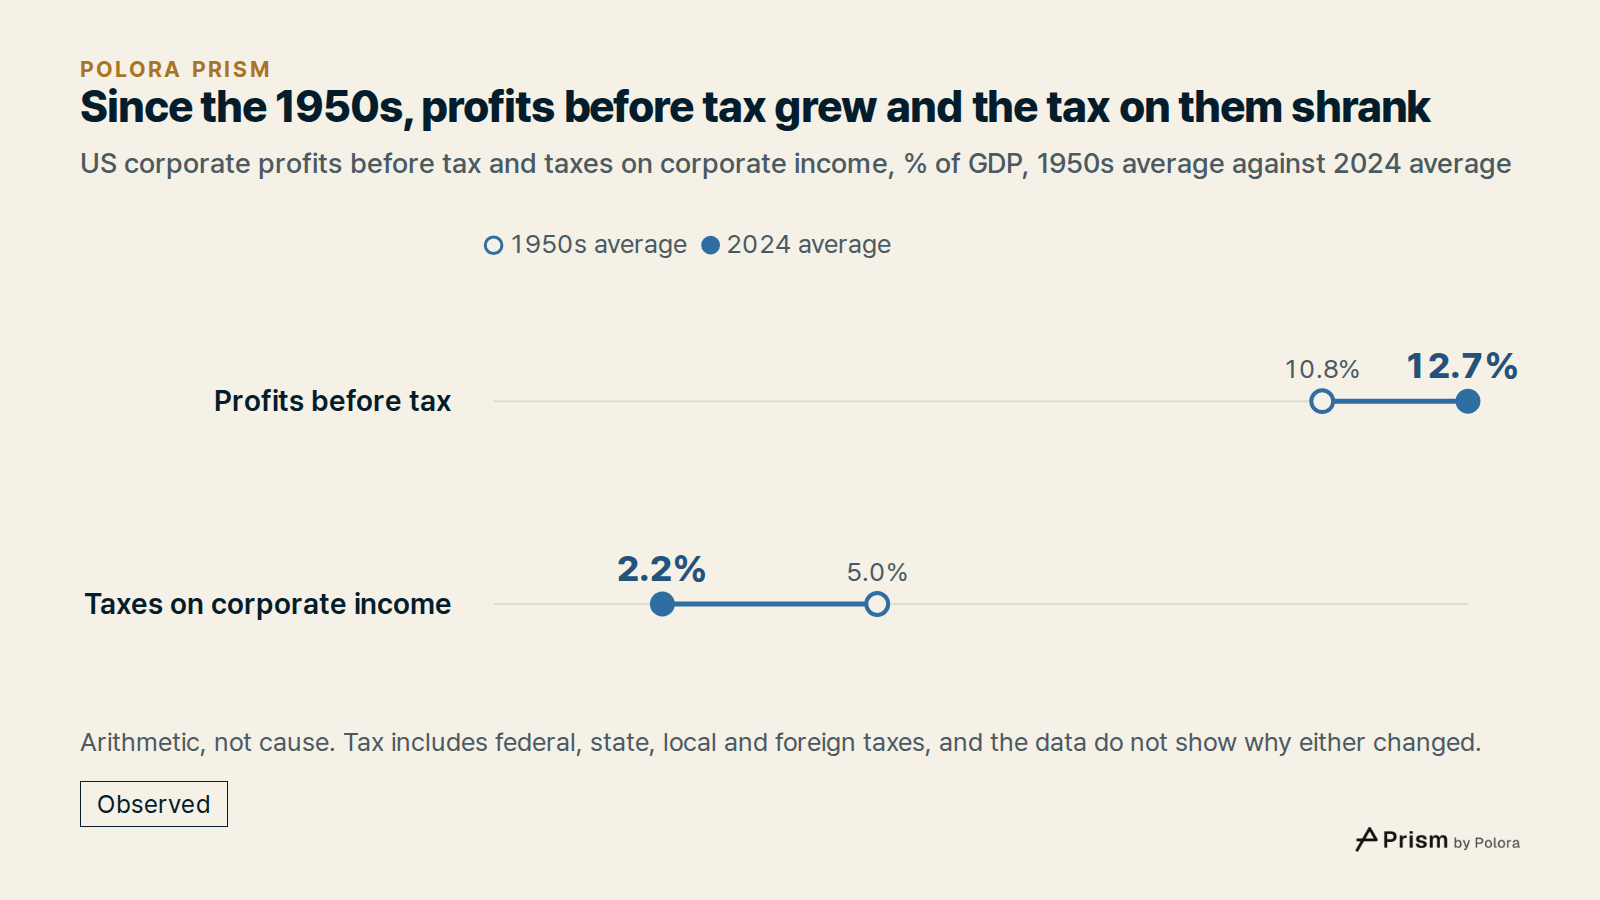
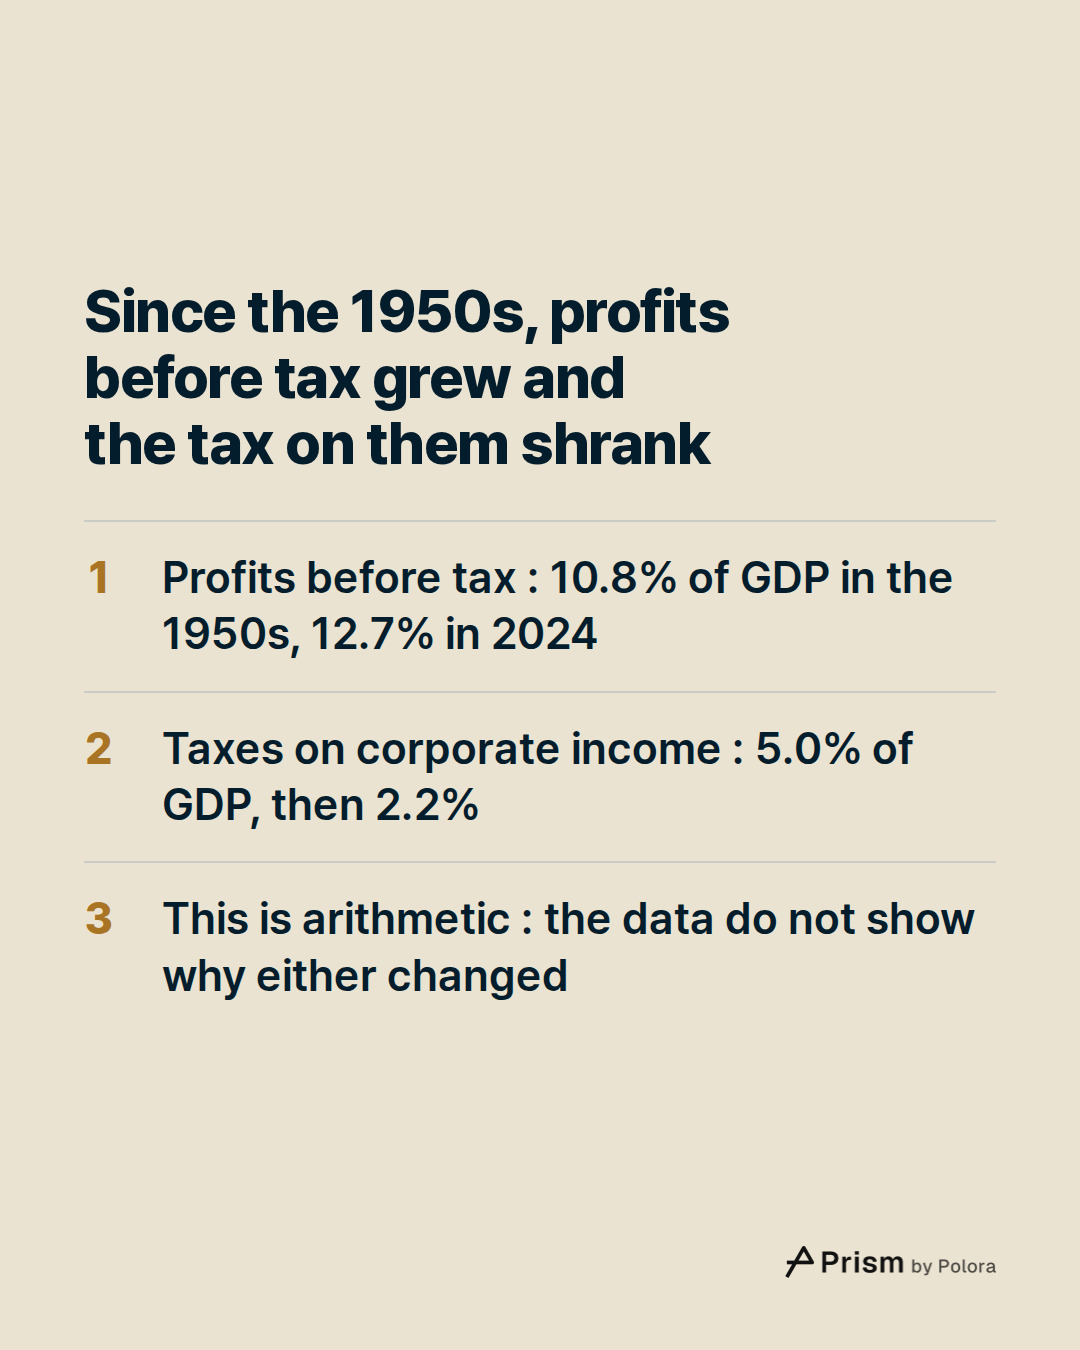
In the 1950s, profits before tax averaged 10.8% of GDP. Tax took 5.0 percentage points of that. Added up over the decade, taxes on corporate income came to 45 cents for every dollar of profit. That followed a war economy in which the tax share had been even larger : in 1942, profits before tax were 12.5% of GDP, but after tax only 5.6%.
From 1960 to 1999, profits after tax averaged 6.2% of GDP. They rose and fell along the way, down to 4.6% at the end of 1986. Added up decade by decade, from the 1950s to the 2010s, tax took a smaller part of profits in each decade than in the one before.
Profits then climbed. In the third quarter of 2010, profits after tax reached 10.4% of GDP, the first quarter above 10%. Across the 2010s, taxes came to 16 cents per dollar of profit. In 2018, the Tax Cuts and Jobs Act cut the top federal corporate income tax rate from 35% to a flat 21%, starting that January.
In the pandemic, profits after tax fell to 9.1% of GDP in the second quarter of 2020. The drop was short. A year later, in the second quarter of 2021, they reached 11.4%, a high that stood until 2026. Profits were at 10.7% at the end of 2024 and 11.3% in the first quarter of 2026, with dips along the way, before reaching 11.9% in the second quarter.
More profit, less tax
Profits after tax are profits before tax less the tax. So a record after tax can come from higher profits, from lower tax, or both. Compared with the 1950s, both moved.
In 2024, profits before tax averaged 12.7% of GDP, against 10.8% in the 1950s. Tax took 2.2 percentage points, against 5.0. In the second quarter of 2026, profits before tax were 14.5% of GDP, and tax took 2.6 points. Per dollar of profit, that is 17.7 cents of tax. More profit before tax and a smaller tax share each added to profits after tax.
The cents-per-dollar figures are a ratio of two national totals, not a tax rate that any company pays. BEA's taxes on corporate income include federal, state and local taxes, and taxes paid to foreign governments. They also include tax on capital gains, which BEA leaves out of profits.
This is arithmetic, not an explanation. The data show how much profits rose and how much the tax share fell. They do not show why either happened. The 2018 tax law and the pandemic are dates in this story, not measured causes of it.
What the next estimate could change
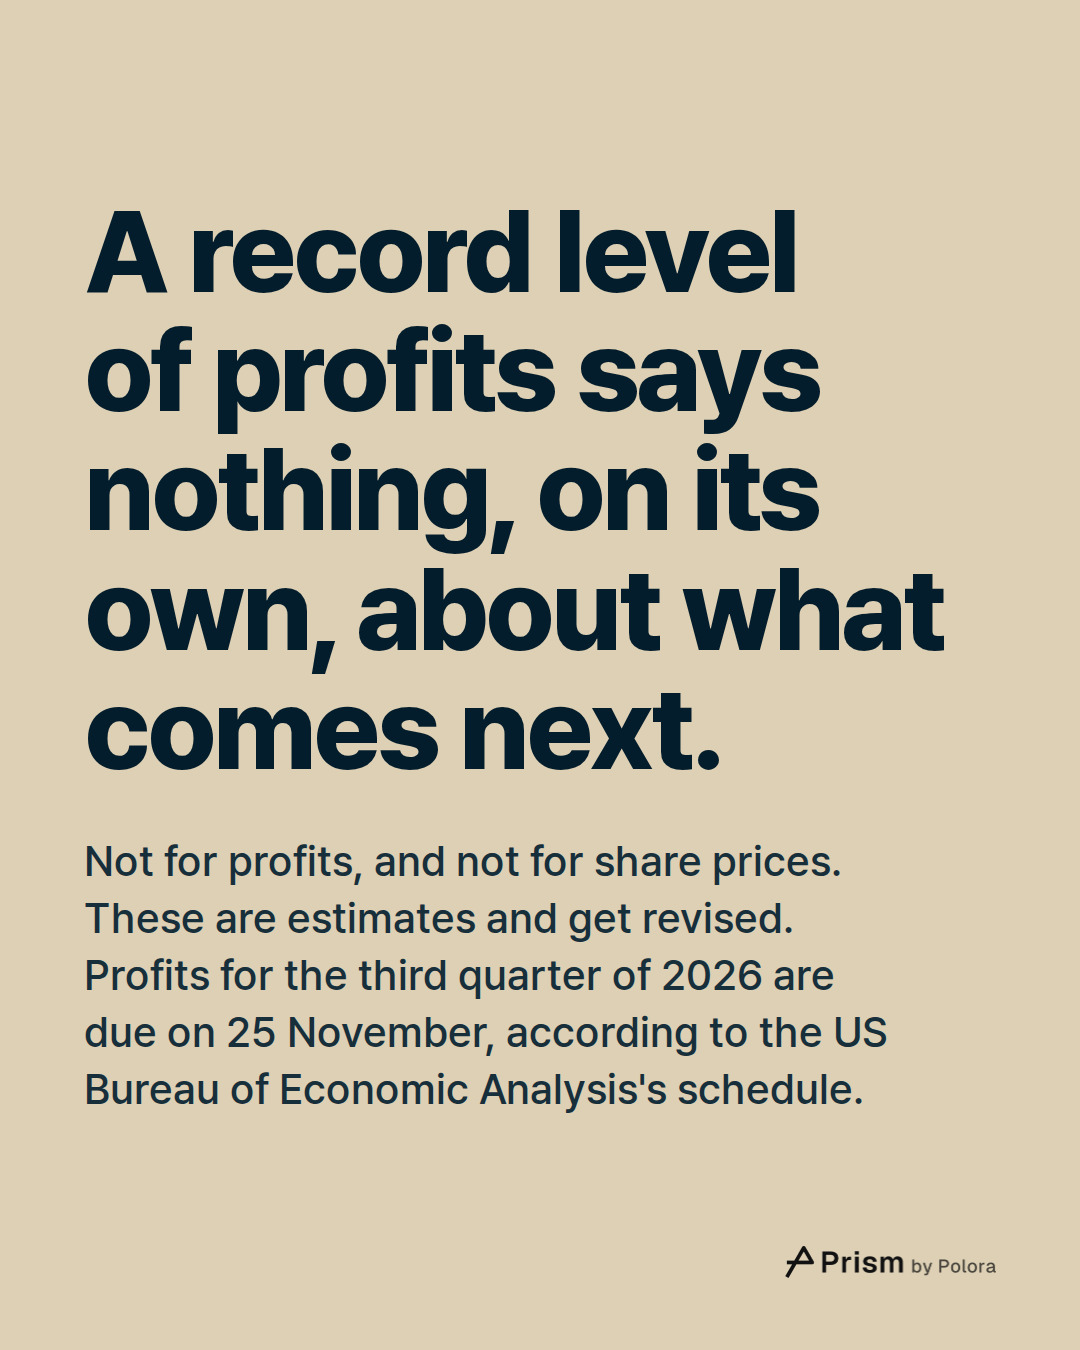
These are estimates, and BEA revises them. BEA does not publish profits with its first estimate of a quarter's GDP; profits for the third quarter of 2026 are due on 25 November, according to its schedule. That release could set a new high, end the run, or revise the quarters before it. A record level of profits says nothing, on its own, about what comes next for profits or for share prices.
- US Bureau of Economic Analysis, National Income and Product Accounts, quarterly data file]
- US Bureau of Economic Analysis, National Income and Product Accounts, annual data file]
- FRED, Federal Reserve Bank of St. Louis, BEA series CPATAX, CPROFIT, A054RC1Q027SBEA, A445RC1Q027SBEA, B394RC1Q027SBEA and GDP]
- FRED, Federal Reserve Bank of St. Louis, BEA annual series A551RC1A027NBEA, A051RC1A027NBEA and GDPA]
- US Bureau of Economic Analysis, Corporate Profits]
- US Bureau of Economic Analysis, NIPA Handbook, Chapter 13: Corporate Profits]
- US Bureau of Economic Analysis, glossary: corporate profits with inventory valuation and capital consumption adjustments]
- Wikipedia, Tax Cuts and Jobs Act]
![Sources 8 : apps.bea.gov · US Bureau of Economic Analysis, National Income and Product Accounts, quarterly data file], apps.bea.gov · US Bureau of Economic Analysis, National Income and Product Accounts, annual data file], fred.stlouisfed.org · FRED, Federal Reserve Bank of St. Louis, BEA series CPA](https://media.cdn.polora.ai/picks/2026/11/pickrun_f77f75fa691647e7/JG7dDxtIRrr1-NXq-slide-08--how-high-are-us.jpg)